Yuan bounces from 5-month low after PBOC pledges to keep market stable

Yuan bounces from 5-month low after PBOC pledges to keep market stable

SHANGHAI/SINGAPORE: China’s yuan clambered off a five-month low against the dollar in early trade on Monday, after the central bank pledged to do its utmost to prevent large fluctuations in the local unit.

Investors have refrained from aggressively testing new lows for the yuan after the central bank on Friday vowed to curb speculation and urged key participants to keep the market stable, traders said.

More action might be taken to prevent yuan depreciation following the verbal warnings, they added.

On Friday, major state-owned banks were seen swapping yuan for dollars in the onshore forwards market – a sign that authorities were trying to manage the rapid fall in the currency.

Prior to Monday’s opening, the People’s Bank of China (PBOC) set the midpoint rate at 7.0157 per dollar, 199 pips or 0.28% firmer than the previous fix of 7.0356.

That was 16 pips weaker than a Reuters estimate of 7.0141. In the spot market, the onshore yuan was changing hands at 7.0194 as of 0233 GMT, compared with 7.0615 – its lowest point in more than five months – hit on Friday.

Implied volatility, an options market gauge of future volatility, also stabilised in morning deals after sharp rises last week.

China’s yuan plumbs fresh Dec lows after weak PBOC fixing

Goldman Sachs analysts revised down their yuan forecasts, saying a lack of confidence in China’s economy was the biggest risk to the country’s recovery outlook for the second half.

“If confidence continues to erode and the negative feedback loop takes hold, a soft patch in Q2 could turn into disappointing growth in subsequent quarters,” they wrote in a note to clients.

They predict the yuan to trade at 7.1 per dollar in three months, 7.0 in six months, and 6.8 in 12 months, down from 6.8, 6.7, 6.5.

Yuan weakness and widening yield differentials with the United States have also limited the scope for substantial monetary easing, and China on Monday kept its benchmark lending rates unchanged for a ninth straight month.

As of 0233 GMT, the global dollar index was down at 103.033 compared with its previous close of 103.198, while the offshore yuan was trading at 7.0298 per dollar.


Sanctioned Crypto Mixer Tornado Cash Hijacked By Hackers

Sanctioned Crypto Mixer Tornado Cash Hijacked By Hackers

Tornado Cash, a service that allows users to mask cryptocurrency transactions, suffered a hostile takeover by hackers through a malicious governance proposal.

Samczsun, a security researcher at crypto investment firm Paradigm, said on Twitter that an attacker granted themselves 1.2 million fake votes on Saturday. As the fake votes exceeded the 700,000 legitimate votes, it allowed the attacker to gain full control over the governance of Tornado Cash.

Tornado Cash couldn’t immediately be reached for comment via Twitter.

Tornado Cash is a blockchain protocol and TORN, its governance token, enables holders to vote on proposed changes in the service.

“Now that they have all the votes, they can do whatever they want. In this case, they simply withdrew 10,000 votes as TORN and sold it all,” Samczsun said in a tweet.

Soon after the news of the exploit, crypto exchange Binance said that it will temporarily pause deposits of TORN. The token steadied on Monday in Asia after sliding on Sunday. Its price is down by over a third to about $4.56 compared with an intraday high on Saturday, according to CoinGecko data.

Tornado Cash is allegedly the preferred tool for hackers and criminals to launder stolen or illicit funds. Data from Dune Analytics showed over $8 billion had been sent through Tornado Cash since the service started in 2019.

The US Treasury Department imposed sanctions on Tornado Cash in August after saying the service was used by North Korean hackers to launder illicit gains. North Korea’s Lazarus Group laundered about $450 million through the service, a Treasury official said then.

Crude Oil Price Creates a Range After Failing to Gain. Where to for WTI?

Crude Oil Price Creates a Range After Failing to Gain. Where to for WTI?

Crude oil continues to consolidate at the start of the Monday after posting a small gain last week with the US debt ceiling lurching toward the so-called X-date.

Negotiations between US President Joe Biden and House Speaker Kevin McCarthy are due to resume on Monday. Mr McCarthy said that a productive phone call transpired between the two on Sunday.

A softer US Dollar appears to be more pronounced in currency pairs and the gold price over the last few sessions. Higher Treasury yields saw some support for the ‘big dollar’ with the benchmark 2-year bond nudging 4.35% on Friday after having traded at 3.66% earlier this month.

US Federal Reserve Chair Jerome Powell made remarks on Friday that were seen as potentially less hawkish than previous commentary. In regard to future policy decisions, he said, “the risks of doing too much versus doing too little, have become more balanced.”

Minneapolis Federal Reserve President Neel Kashkari also stated that he would be open to skipping a hike at the next Federal Open Market Committee (FOMC) meeting in mid-June.

The futures and swaps markets are pricing in almost a 50-basis point cut to the Fed funds target rate by the end of the year.

The Alberta, British Columbia and Saskatchewan provinces in Canada are experiencing severe wildfires and the nation’s oil production output is expected to be reduced as a result. Current estimates are for a reduction of almost 250k barrels per day.

The weekly US Energy Information Agency (EIA) data will be released on Wednesday, and it will be closely watched after last week’s surprise leap in oil inventory.

5.04 million barrels were added to stockpiles which were way above the detraction of 920k that had been anticipated.

Update crude oil prices can be found here.

WTI CRUDE OIL TECHNICAL ANALYSIS

WTI failed to overcome resistance at 73.93 last Friday when it made a high at 73.58 and these levels may continue to offer resistance.

The 34- and 100-day Simple Moving Average (SMA) is just above these levels and may lend resistance.

On the downside, support might reside at the breakpoints and prior lows of 69.41, 66.82, 66.12, 64.36, 63.64 and 62.43.

image1.png

GBP/USD Price Analysis: Climbs firmly above 1.2450 ahead of Monday’s US borrowing cap talks

GBP/USD Price Analysis: Climbs firmly above 1.2450 ahead of Monday’s US borrowing cap talks

The GBP/USD pair has climbed back above the immediate resistance of 1.2450 in the early Asian session. An absence of positive development in US debt-ceiling talks this weekend has fueled worries of a default by the US Treasury. US President Joe Biden and House of Representatives Joseph McCarthy are scheduled to meet on Monday as less than two weeks are left for US Treasury to avoid a default on obligated payments.

S&P500 futures have added decent loss in early Tokyo amid sheer volatility. The US Dollar Index (DXY) is returning back to 103.00 after a short-lived pullback move. Rising chances of a steady interest rate policy by the Federal Reserve (Fed) and volatility associated with US debt-ceiling issues have restricted the upside for the USD Index.

The Pound Sterling is to remain in action ahead of preliminary United Kingdom’s S&P PMI (May) data.  Manufacturing PMI is seen higher at 48.0 while Services PMI is expected to soften to 55.5.

GBP/USD witnessed a steep fall after a breakdown of the upward-sloping trendline plotted from April 03 low at 1.2275 on a four-hour scale. The Cable is consistently making lower highs, indicating the strength of the US Dollar bulls. Potential support is placed from April 10 low at 1.2344.

The 50-period Exponential Moving Average (EMA) at 1.2486 is acting as a barricade for the Pound Sterling bulls.

Meanwhile, the Relative Strength Index (RSI) (14) has not shifted into the bearish range of 20.00-40.00 comfortably. An occurrence of the same will strengthen the US Dollar bulls further.

Should the asset decline below May 19 low at 1.2390, US Dollar bulls will get strengthened further and will drag the Cable toward April 10 low at 1.2344 followed by April 03 low at 1.2275.

On the flip side, a recovery move above May 09 high at 1.2640 will drive the major toward the round-level resistance at 1.2700 and 26 April 2022 high at 1.2772.

GBP/USD four-hour chart

GBP/USD


Is the Downward Correction in Gold Over?

Is the Downward Correction in Gold Over?

Last week’s drop to a six-week low could be a sign that cracks have started to emerge in gold’s uptrend. To be sure, it doesn’t mean ‘down’ is the only way forward – it probably means that the top side is now more or less defined.

XAU/USD slipped below a crucial floor at the mid-April low of 1970 – a fall below a vital price pivot for the first time since the rally began in early November – suggesting that the tide could be beginning to turn against gold. That is, the trend could be changing from up to sideways or down on the daily charts.

Given the pace and the extent of the gains since the end of 2022, and still-supportive upward momentum on higher timeframe charts, it could well be a sideways with a downward bias, rather than a unidirectional slide — and Friday’s rebound reinforces this point.

XAU/USD Daily Chart

image1.png

Gold rebounded on Friday after US Federal Reserve Chair Jerome Powell left the door open for a pause at the June meeting. Tighter credit conditions mean that “our policy rate may not need to rise as much as it would have otherwise to achieve our goals,” Powell said. The central bank chair reiterated that the central bank would now make decisions “meeting by meeting”. Markets are pricing in an 90% chance of a pause at the June FOMC meeting.

XAU/USD 240-minute Chart

image2.png

On technical charts, the trend varies depending on the timeframe of reference. On the intraday charts, XAU/USD’s trend has turned bearish – see the 240-minute colour-coded candlestick charts based on trending/momentum indicators. Hence, Friday’s rebound could run out of steam ahead of the tough barrier around 2005-2020 (including the 200-period moving average and the mid-March high on the 240-minute charts).

XAU/USD 240-minute Chart

image3.png

On the daily charts, as the colour-coded candlestick charts show, the trend has moved to a consolidation phase within the overall bullish structure. If history is any guide, consolidations can extend from a few days to a few weeks.

XAU/USD Daily Chart

image4.png

So far, XAU/USD is holding above the key converged cushion area of 1925-1950 (including the 89-day moving average and the lower edge of the Ichimoku channel on the daily charts). A break below could trigger a reassessment of the six-month-long bullish structure. In recent months, the momentum on higher timeframe charts has been a concern – see previous updateson March 28,April 16,April 24,May 10, and last week’s update “Is This the Moment of Reckoning for Gold?”, published May 17.

Note: In the above colour-coded charts, Blue candles represent a Bullish phase. Red candles represent a Bearish phase. Grey candles serve as Consolidation phases (within a Bullish or a Bearish phase), but sometimes they tend to form at the end of a trend. Note: Candle colors are not predictive – they merely state what the current trend is. Indeed, the candle color can change in the next bar. False patterns can occur around the 200-period moving average, or around a support/resistance and/or in sideways/choppy market. The author does not guarantee the accuracy of the information. Past performance is not indicative of future performance. Users of the information do so at their own risk.

AUD/USD Price Forecast: Aussie Slips on Chinese LPR & Risk Sentiment

AUD/USD Price Forecast: Aussie Slips on Chinese LPR & Risk Sentiment

AUSTRALIAN DOLLAR FUNDAMENTAL BACKDROP

The Australian dollar looks to be facing another challenging week after US factors weighed on the pro-growth AUD. Beginning late on Friday, Treasury Secretary Janet Yellen addressed bank CEO’s and stated there may be a need for additional mergers due to the slew of bank failures seen over the last few months. This dampened risk sentiment leaving the AUD on the backfoot against the US dollar. Market caution gained traction over the weekend as optimism around the US debt ceiling was quickly dispelled when President Joe Biden mentioned that the demands from Republicans were ‘unacceptable’. President Biden and House of Representatives Speaker Kevin McCarthy will hash it out once more later today as time runs out.

That being said, Fed Chair Jerome Powell relayed a rather dovish statement last week which was largely lost in the debt ceiling shadow, hinting that the Fed may pause their hiking cycle. In summary, the week should be dominated by debt ceiling negotiations but Fed monetary policy should be a close second.

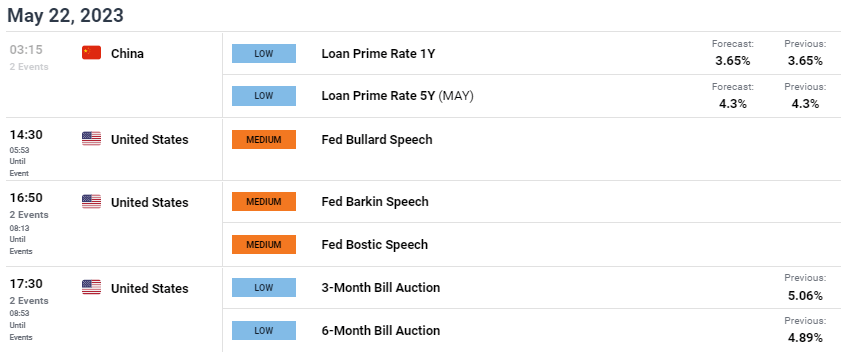
Earlier this morning China kept its 1 and 5-year Loan Prime Rates (LPR) unchanged. The increasing interest rate differential between the US and China has weighed on the Yuan and the PBoC’s desire to cut rates (as a stimulus measure) to meet their 5% GDP growth target. Commodity prices (Australian specific exports) have weakened thus exacerbating downside for the Aussie dollar.

The day ahead will be led by Fed speakers (see economic calendar below) and it will be interesting to see how the scheduled officials react to Fed Chair Powell’s recent comments.

ECONOMIC CALENDAR

image1.png

TECHNICAL ANALYSIS

AUD/USD DAILY CHART

image2.png

Chart prepared by Warren Venketas, IG

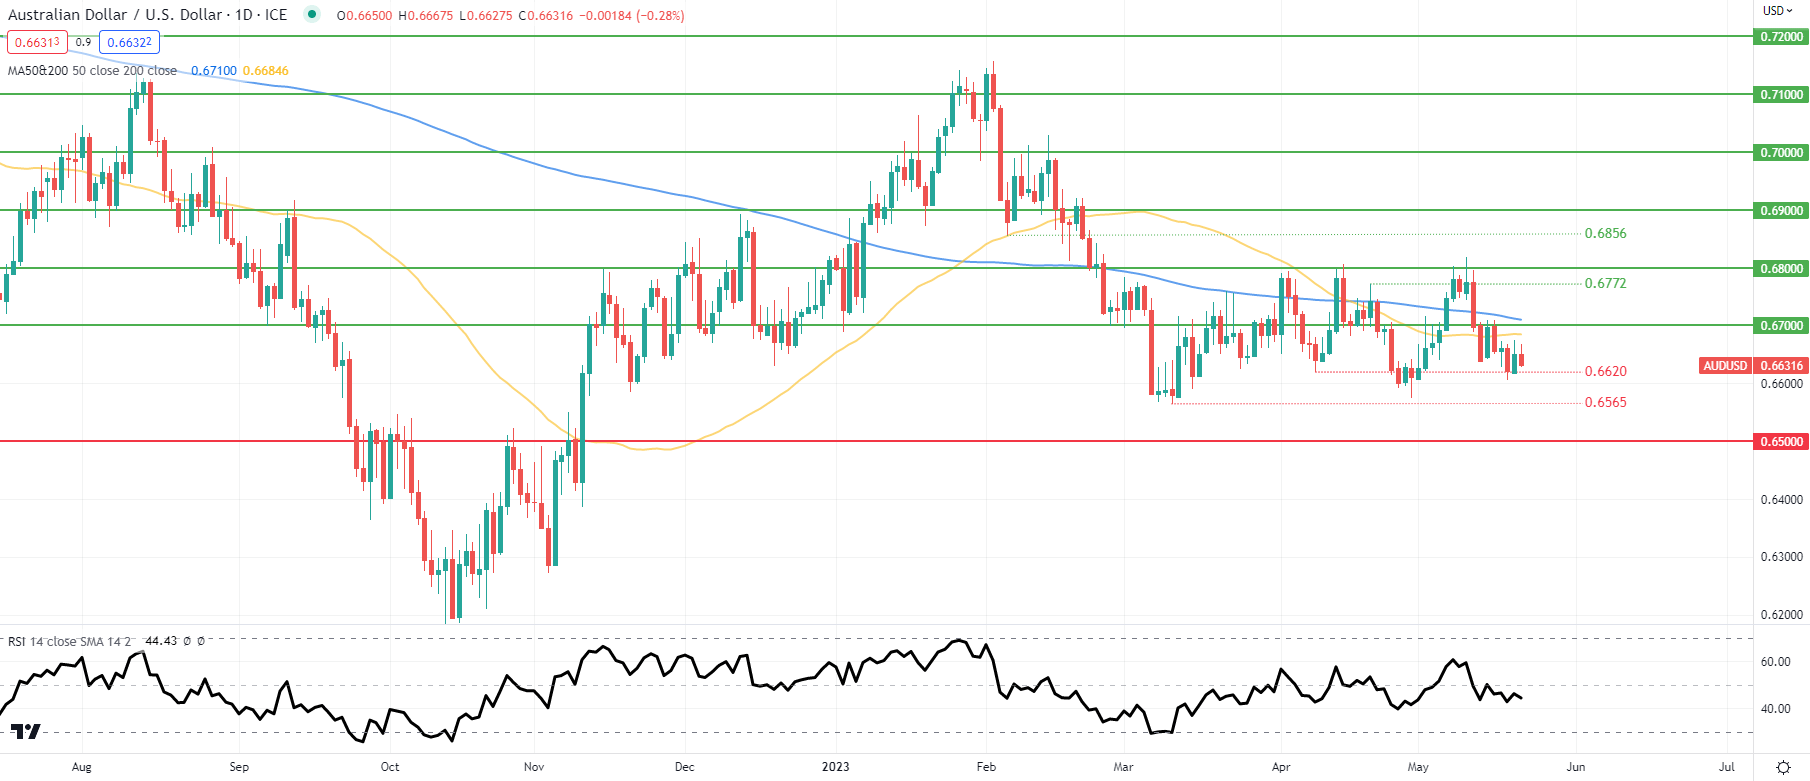
Daily AUD/USD price action reveals recent uncertainty in global markets as the pair fluctuates between the 0.6600 and 0.6800 psychological levels. The Relative Strength Index (RSI) further reiterates investor skepticism due to fundamental ambiguity. This week may be a ‘wait and see’ mindset from traders awaiting external cues.

EUR/CHF: Decline to persist on a break below support zone of 0.9710/0.9670 – SocGen

EUR/CHF: Decline to persist on a break below support zone of 0.9710/0.9670 – SocGen

Last week’s peak near 0.9770 must be overcome for affirming a meaningful up move

“EUR/CHF is now challenging the interim support zone of 0.9710/0.9670 representing the low of March and the 61.8% retracement from last year. An initial bounce is not ruled out however the peak achieved last week near 0.9770 must be overcome for affirming a meaningful up move.”

“Break below 0.9710/0.9670 could mean a persistent decline towards projections of 0.9600 and 0.9540.”

US Dollar Slides on Uncertainties While Japanese Yen Firms Despite Poor Data

US Dollar Slides on Uncertainties While Japanese Yen Firms Despite Poor Data

The US Dollar dipped again against the Suisse, Euro, Sterling and Yen to start the week with the US debt ceiling creating doubt in traders’ minds.

Talks are due to resume later today between US President Joe Biden and House Speaker Kevin McCarthy. The latter said that a phone call between the two on Sunday had been ‘productive’.

Treasury yields are a few basis points lower across the curve so far today and might be contributing to the weakening US Dollar.

US Federal Reserve Chair Jerome Powell made remarks on Friday that were seen as potentially less hawkish than previous commentary. In regard to future policy decisions, he said, “the risks of doing too much versus doing too little, have become more balanced.”

Minneapolis Federal Reserve President Neel Kashkari also stated that he would be open to skipping a hike at the next Federal Open Market Committee (FOMC) meeting in mid-June.

Interest rate markets are pencilling in a 25-basis point cut to the Fed funds target rate by November.

The Japanese Yen is firming even though core machine orders there for March came in much lower than forecasts today.

New orders fell -3.9% month-on-month in March rather than increasing by 0.4% as anticipated. Year-on-year, core machine orders dropped by -3.5% to the end of March, well below the estimates of a 1.3% increase.

USD/JPY is over a big figure lower from the 6-month peak 0f 138.75 seen last Thursday.

The People’s Bank of China (PBOC) left the 1- and 5-year loan prime rates unchanged at 3.65% and 4.30% respectively.

Hong Kong’s Hang Seng Index (HSI) is the best of the APAC equity indices, it was up over 1.5% at one stage. The rest of the major Asian bourses are mostly in the green although Australia’s ASX 200 is slightly in the red.

The buy now pay later (BNPL) sector is facing further scrutiny after the Australian government today announced measures to bring those debt providers under existing universal credit laws. The companies will now need to secure a credit license to operate.

Gold has held onto Friday’s gains but is little moved going into the European session, trading near US$ 1,980 at the time of going to print.

Crude oil is struggling today after making after spiking on Friday but remains in a broad range. The WTI futures contract is near US$ 71 bbl while the Brent contract is close to US$ 75 bbl.

It is a relatively quiet day ahead in terms of data releases, but several speakers from the ECB and the Fed will be making speeches.

USD/JPY TECHNICAL ANALYSIS

USD/JPY tried to run higher last week after breaking above a prior peak and making a high of 138.75.

It appears that the market has rejected the move for now with the price moving back below those previous resistance levels. This might be suggestive of a false and a new high will need to be made to allay these concerns.

Resistance might be at previous highs of 138.17, 138.75 and 139.90. On the downside, support may lie at the 200- and 260-day Simple Moving Averages (SMA) currently at 137.12 and 136.46 respectively.

image1.png


EUR/USD eases to 1.0800 as US Dollar recovers ahead of debt ceiling talks

EUR/USD eases to 1.0800 as US Dollar recovers ahead of debt ceiling talks

EUR/USD is easing to test 1.0800 in the European morning. The US Dollar is recovering ground amid a risk-off market profile, as traders stay cautious ahead of another round of US debt-ceiling talks.

From a technical perspective, the overnight breakdown and acceptance below the 100-day Simple Moving Average (SMA) for the first time since November 2022 could be seen as a fresh trigger for bearish traders. The said support breakpoint, around the 1.0800 round-figure mark, coincided with the 50% Fibonacci retracement level of the March-May rally and should now act as a pivotal point. Meanwhile, oscillators on the daily chart are still far from being in the oversold zone and add credence to the negative outlook.

That said, any further decline is more likely to find some support near the 61.8% Fibo. level, around the 1.0730-1.0725 region. Some follow-through selling will reaffirm the bearish bias and drag the EUR/USD pair below the 1.0700 mark, towards the next relevant support near the 1.0675-1.0670 horizontal zone. Spot prices could slide further towards the 1.0635 region before eventually dropping to test the 1.0600 round figure.

On the flip side, the 1.0800 confluence now seems to act as an immediate strong barrier, above which a bout of a short-covering has the potential to lift the EUR/USD pair towards the 38.2% Fibo. level, around the 1.0865-1.0870 region. Some follow-through buying, leading to a subsequent strength beyond the 1.0900 mark, suggests that the recent pullback from over a one-year high has run its course and shift the bias in favour of bullish traders.

The shared currency fails to gain any respite from bets for more rate hikes by the European Central Bank (ECB). It is worth recalling that ECB President Christine Lagarde has already made it clear that efforts to curb stubbornly high inflation aren’t over and said that there are factors that can induce significant upside risk to the inflation outlook. This, however, fails to impress bulls or lend any support to the EUR/USD pair. Investors now look to the ECB Bulletin for some impetus, though the focus will remain glued to Fed Chair Jerome Powell’s appearance later this Friday.

Market players will closely scrutinize Powell’s remarks for fresh clues about the US central bank’s next policy move. This, along with the US bond yields, the US debt-limit negotiations and the broader risk sentiment, will influence the USD price dynamics and provide some impetus to the EUR/USD pair on the last day of the week. Nevertheless, spot prices remain on track to register heavy losses for the second straight week and the aforementioned fundamental backdrop supports prospects for additional losses. Hence, any attempted recovery might still be seen as a selling opportunity.

AUDUSD in tight range; decisive breakout needed

AUDUSD in tight range; decisive breakout needed

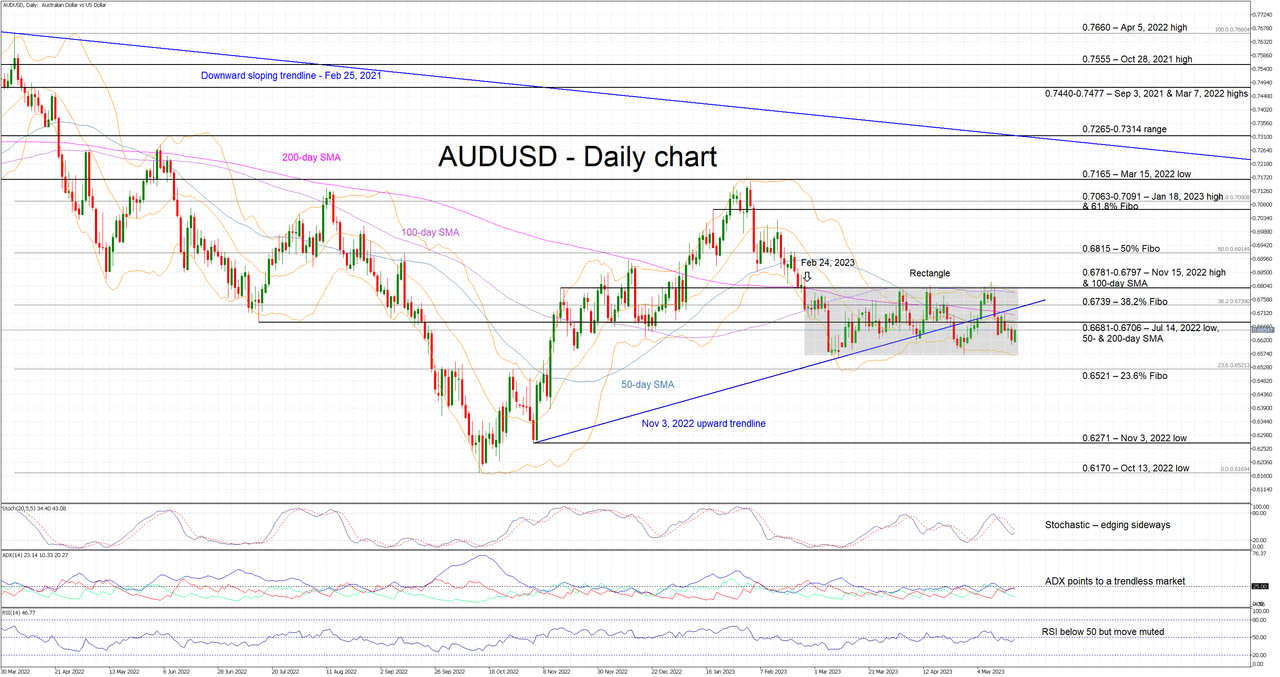
AUDUSD is edging higher today but remains well inside the rectangle that has formed since February 24. This recent range-trading is a depiction of the indecisiveness of market participants to commit to a specific move. As the direction of the breakout is unknown ahead of time, the focus turns to the momentum indicators for valuable information.However, the subdued Average Directional Movement Index (ADX) confirms the current range-trading theme, and the RSI is just a tad below its 50-threshold. In addition, the usually volatile stochastic oscillator is hovering below its moving average but appears to be moving sideways now. More interestingly, there is a convergence of the simple moving averages (SMAs), just above the current AUDUSD pricing, that is usually associated with an imminent move.

Should the bears manage to break the current rectangle, they would quickly come up against the 23.6% Fibonacci retracement of the April 5, 2022 – October 13, 2022 downtrend at 0.6521. The path then appears to be clear until the November 3, 2022 low of 0.6271.

On the other hand, if the bulls decide to take market control, they will try to clear the busy 0.6681-0.6706 area populated by the 50- and 200-day SMAs, and the July 14, 2022 low. They would then aim for 0.6739, before setting their eyes on the key 0.6781-0.6797 range, where the upper boundary of the rectangle lies.

To conclude, AUDUSD range-trading continues as market participants remain on the sidelines. A sizeable move appears to be on the cards, but a rectangle breakout is needed first.