Gold Price Finds Traction as US Dollar Pauses Despite Higher Yields

Gold Price Finds Traction as US Dollar Pauses Despite Higher Yields

The gold price dipped to a 2-month low last week but has since consolidated with the US Dollar appreciation pausing from its recent run higher.

Treasury yields have been supportive of the ‘big dollar’ with the benchmark 2-year bond clipping 4.35% on Friday and again this week after having traded at 3.66% earlier this month.

Similarly, the 10-year note is trading above 3.7% after touching 3.30% a few weeks ago. Perhaps the focus for gold traders though is the rise of US real yields.

The real yield is the nominal yield less the market-priced inflation rate derived from Treasury inflation-protected securities (TIPS) for the same tenor.

The US 10-year real yield is currently eyeing a move over 1.50%. Of some concern for gold bulls, when it was at this level prior to the collapse of Silicon Valley Bank Financial et al, gold was below US$ 1,850.

Going into Tuesday’s session, the debt ceiling issue in the US appears to be finally heading in the right direction. After talks on Monday, President Joe Bidden and House Speaker Kevin McCarthy have both said that a default is not on the cards.

While the news is mostly welcomed, markets appear to be waiting for further clarity with little price response across markets thus far.

The US Dollar has been gathering some bullish momentum of late and direction in the DXY (USD) Index might lead the precious metal on its next move.

GC1 (GOLD FUTURES), US 10-YEAR REAL YIELD, DXY (USD) INDEX

image1.png

GC1 (GOLD FRONT FUTURES CONTRACT) TECHNICAL ANALYSIS

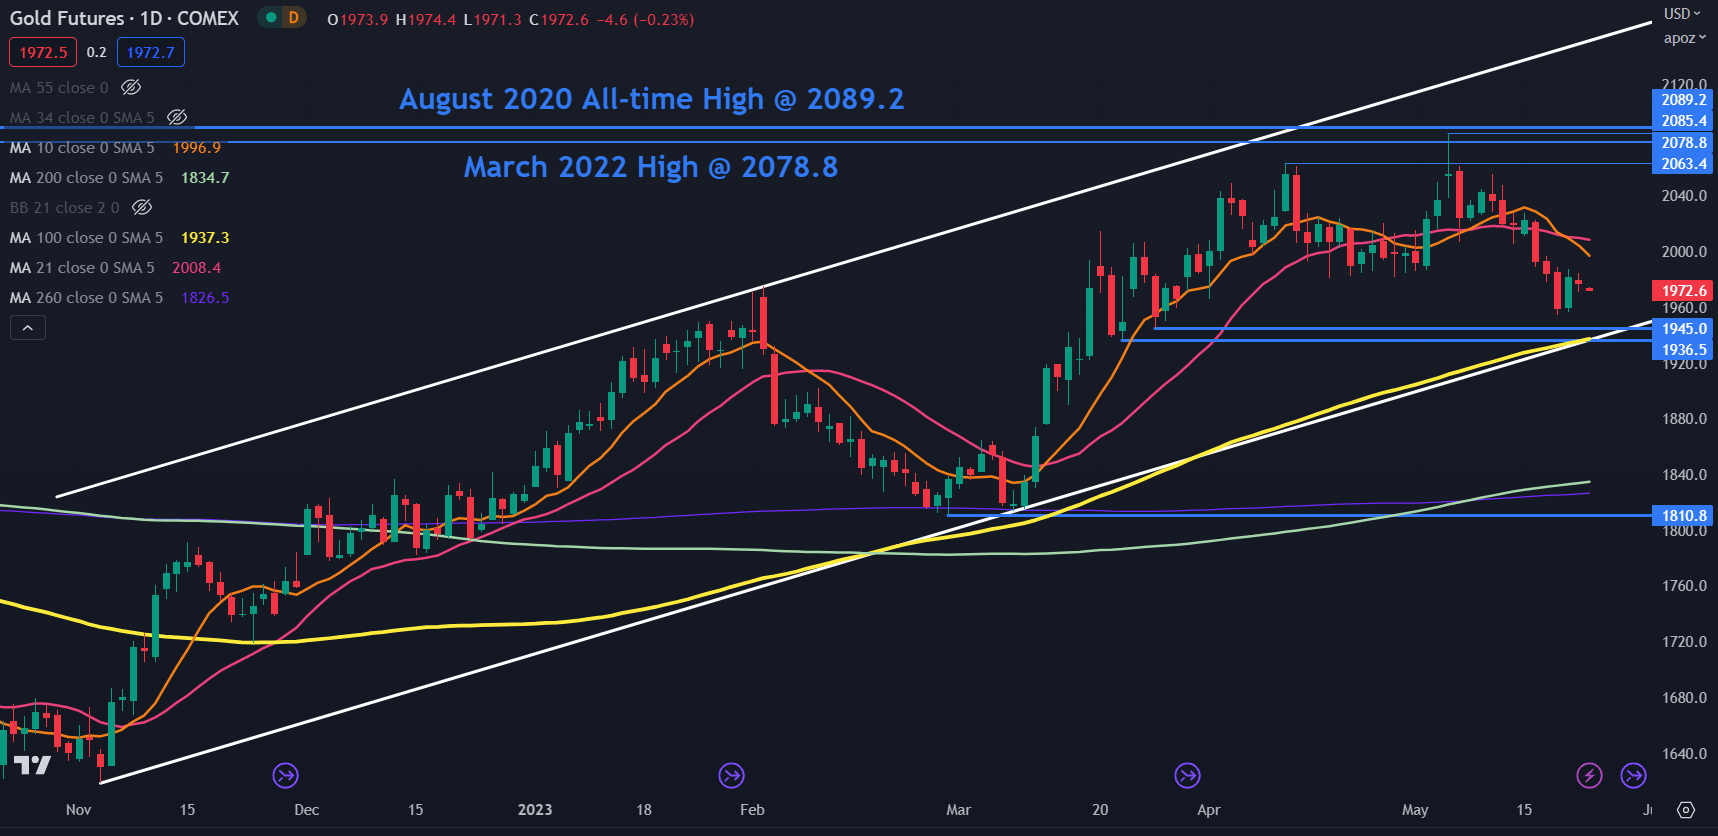
Gold remains in an ascending trend channel that began in November last year.

At the start of this month, GC1 made a high of 2085.4 after clearing the March 2022 peak of 2078.8 but fell short of overcoming the all-time high of 2089.2. The wholesale spot price of gold has also seen a similar setup.

This may indicate that the 2080 – 2090 area might offer a resistance zone. This is also a Triple Top which is an extension of a Double Top formation. It could indicate that there is strong resistance at those levels. A move above 2090 would be needed to dismantle this formation.

A break above there may open the way for a test of the ascending trend line, currently dissecting at 2150.

On the downside, support might be provided at the prior lows of 1945.0 and 1936.5 ahead of the ascending trend that currently lies at 1935. The 100-day SMA is also in that vicinity and could add support near there.

image2.png

USD Price Forecast: Debt Ceiling Optimism Supportive of Dollar Index (DXY)

USD Price Forecast: Debt Ceiling Optimism Supportive of Dollar Index (DXY)

USD FUNDAMENTAL BACKDROP

The Dollar Index (DXY) has been dancing to the tune of US debt ceiling negotiations and yesterday’s discussions prompted renewed optimism in global markets. The dollar ticked slightly higher and trades relatively flat this Tuesday morning. While no deal was struck, both representatives (president Joe Biden and House Speaker Kevin McCarthy) stated the talks were constructive; however, more negotiations will be required to avoid a default.

Yesterday included a slew of Fed speakers with the Fed’s Bullard surprising markets by calling for possibly two more interest rate hikes while Mr. Kashkari opted for a more cautious tone unsure of a pause or hike in the June meet. This slightly hawkish rhetoric has now cut down rate cut expectations as seen by the implied Fed funds futures below. Money markets are now pricing in roughly 34bps of rate cuts by year end as opposed to 41bps just yesterday. Limiting upside for the dollar has been aggressive ECB officials who have been ramping up monetary policy tightening dialogue – eurozone PMI will also add to the economic outlook for the region later this morning.

FEDERAL RESERVE INTEREST RATE PROBABILITIES

image1.png

Source: Refinitiv

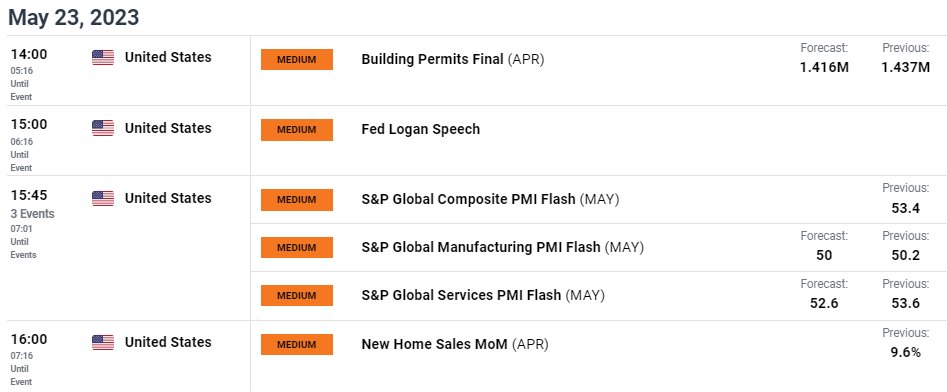
That being said, the week ahead contains several high impact economic data from the US including GDP, durable goods orders, consumer sentiment and core PCE; all of which will give markets and the Fed valuable data as to forward guidance. Later today, more Fed speak will provide short-term volatility as well as US PMI (S&P). Both manufacturing and services are projected to decline possible pushing manufacturing into contractionary territory should actual figures come in lower.

ECONOMIC CALENDAR

image2.png

TECHNICAL ANALYSIS

U.S. DOLLAR INDEX DAILY CHART

image3.png

Chart prepared by Warren Venketas, IG

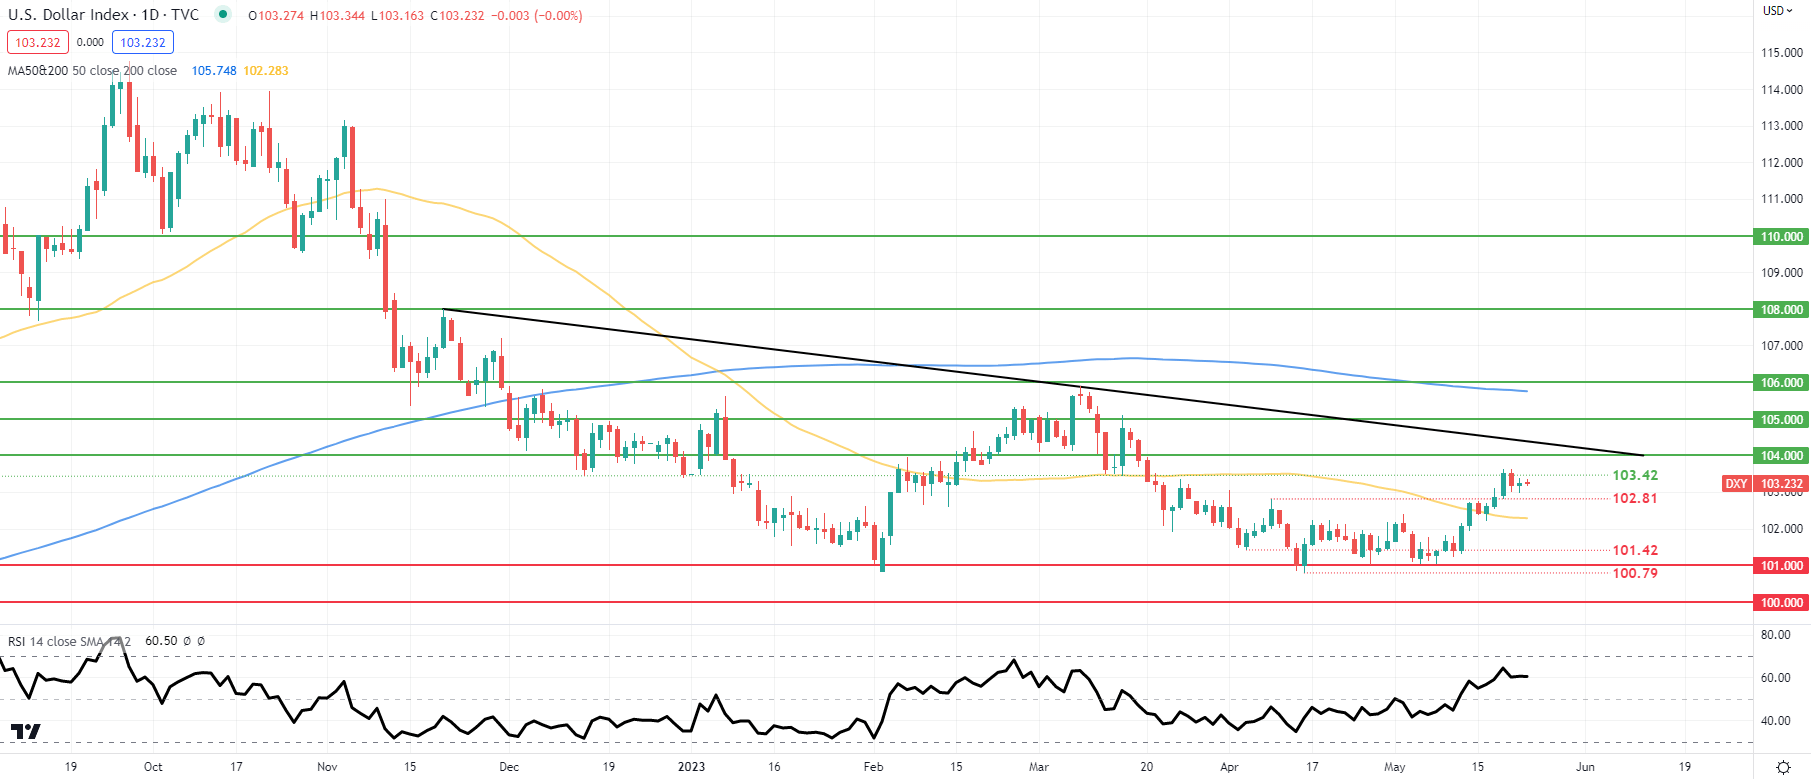
Daily DXY price action has slowed regarding its upside momentum as the index approaches overbought territory as measured by the Relative Strength Index (RSI). While there is still more room for an extended rally, this could be capped around the 104.00 psychological resistance handle. For now, price movement depends on debt ceiling updates (as is the case with most markets) and the sooner there is clarity, the sooner markets can focus on the Fed and US economic data.

Resistance levels:

  • Trendline resistance
  • 104.00
  • 103.42

Support levels:

  • 102.81
  • 50-day MA (yellow)
  • 101.42
  • 101.00
Gold Price Finds Traction as US Dollar Pauses Despite Higher Yields

Gold Price Finds Traction as US Dollar Pauses Despite Higher Yields

The gold price dipped to a 2-month low last week but has since consolidated with the US Dollar appreciation pausing from its recent run higher.

Treasury yields have been supportive of the ‘big dollar’ with the benchmark 2-year bond clipping 4.35% on Friday and again this week after having traded at 3.66% earlier this month.

Similarly, the 10-year note is trading above 3.7% after touching 3.30% a few weeks ago. Perhaps the focus for gold traders though is the rise of US real yields.

The real yield is the nominal yield less the market-priced inflation rate derived from Treasury inflation-protected securities (TIPS) for the same tenor.

The US 10-year real yield is currently eyeing a move over 1.50%. Of some concern for gold bulls, when it was at this level prior to the collapse of Silicon Valley Bank Financial et al, gold was below US$ 1,850.

Going into Tuesday’s session, the debt ceiling issue in the US appears to be finally heading in the right direction. After talks on Monday, President Joe Bidden and House Speaker Kevin McCarthy have both said that a default is not on the cards.

While the news is mostly welcomed, markets appear to be waiting for further clarity with little price response across markets thus far.

The US Dollar has been gathering some bullish momentum of late and direction in the DXY (USD) Index might lead the precious metal on its next move.

GC1 (GOLD FUTURES), US 10-YEAR REAL YIELD, DXY (USD) INDEX

image1.png

GC1 (GOLD FRONT FUTURES CONTRACT) TECHNICAL ANALYSIS

Gold remains in an ascending trend channel that began in November last year.

At the start of this month, GC1 made a high of 2085.4 after clearing the March 2022 peak of 2078.8 but fell short of overcoming the all-time high of 2089.2. The wholesale spot price of gold has also seen a similar setup.

This may indicate that the 2080 – 2090 area might offer a resistance zone. This is also a Triple Top which is an extension of a Double Top formation. It could indicate that there is strong resistance at those levels. A move above 2090 would be needed to dismantle this formation.

A break above there may open the way for a test of the ascending trend line, currently dissecting at 2150.

On the downside, support might be provided at the prior lows of 1945.0 and 1936.5 ahead of the ascending trend that currently lies at 1935. The 100-day SMA is also in that vicinity and could add support near there.

image2.png


Australian Dollar Ahead of Retail Sales: AUD/USD, EUR/AUD, GBP/AUD Price Setups

Australian Dollar Ahead of Retail Sales: AUD/USD, EUR/AUD, GBP/AUD Price Setups

The Australian dollar has been mixed against its peers as Australian rate hike expectations scaled back after employment unexpectedly fell in April. The key focus is now on retail sales data for April due Friday – forecast to have slowed to 0.1% on-month from 0.4% previously.

Broadly Australian macro data have come in above expectations since early April, according to the Economic Surprise Index. Hence, upbeat retail sales data could help reverse some of the recent dialing back in rate hike expectations, supporting AUD. The Reserve Bank of Australia unexpectedly raised the benchmark rate by 25 basis points at its meeting earlier this month and kept the door open for further tightening as inflation, which is running at 7%, is only expected to return to the top of the central bank’s 2%-3% target by mid-2025.

AUD/USD Daily Chart

image1.png

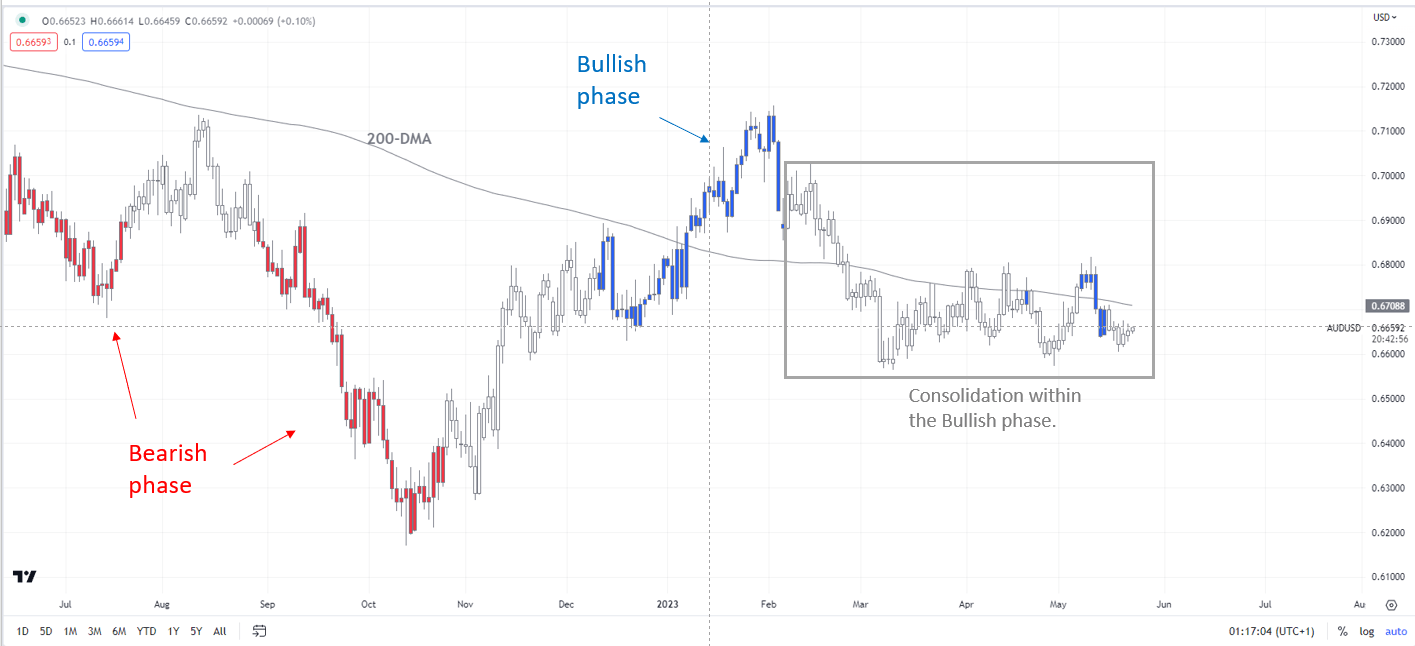
AUD/USD: Still in a consolidation phase

AUD/USD has pulled back from the mid-April high of 0.6805, pushing the pair back within the well-established range of 0.6550-0.6800, pushing back (but not negated yet) the bullish possibility highlighted in the previous update (see “Australian Dollar Ahead of Budget: AUD/USD, AUD/JPY, EUR/AUD Price Setups”, published May 9.

AUD/USD Daily Chart

image2.png

As the colour-coded candlestick charts based on trending/momentum indicators show, the pair remains in a consolidation phase since early 2023 within the broader bullish phase. The colour-coded chart is an attempt to de-bias, especially in instances where the line is fine between a downtrend and a downward correction within an uptrend.

AUD/USD Weekly Chart

image3.png

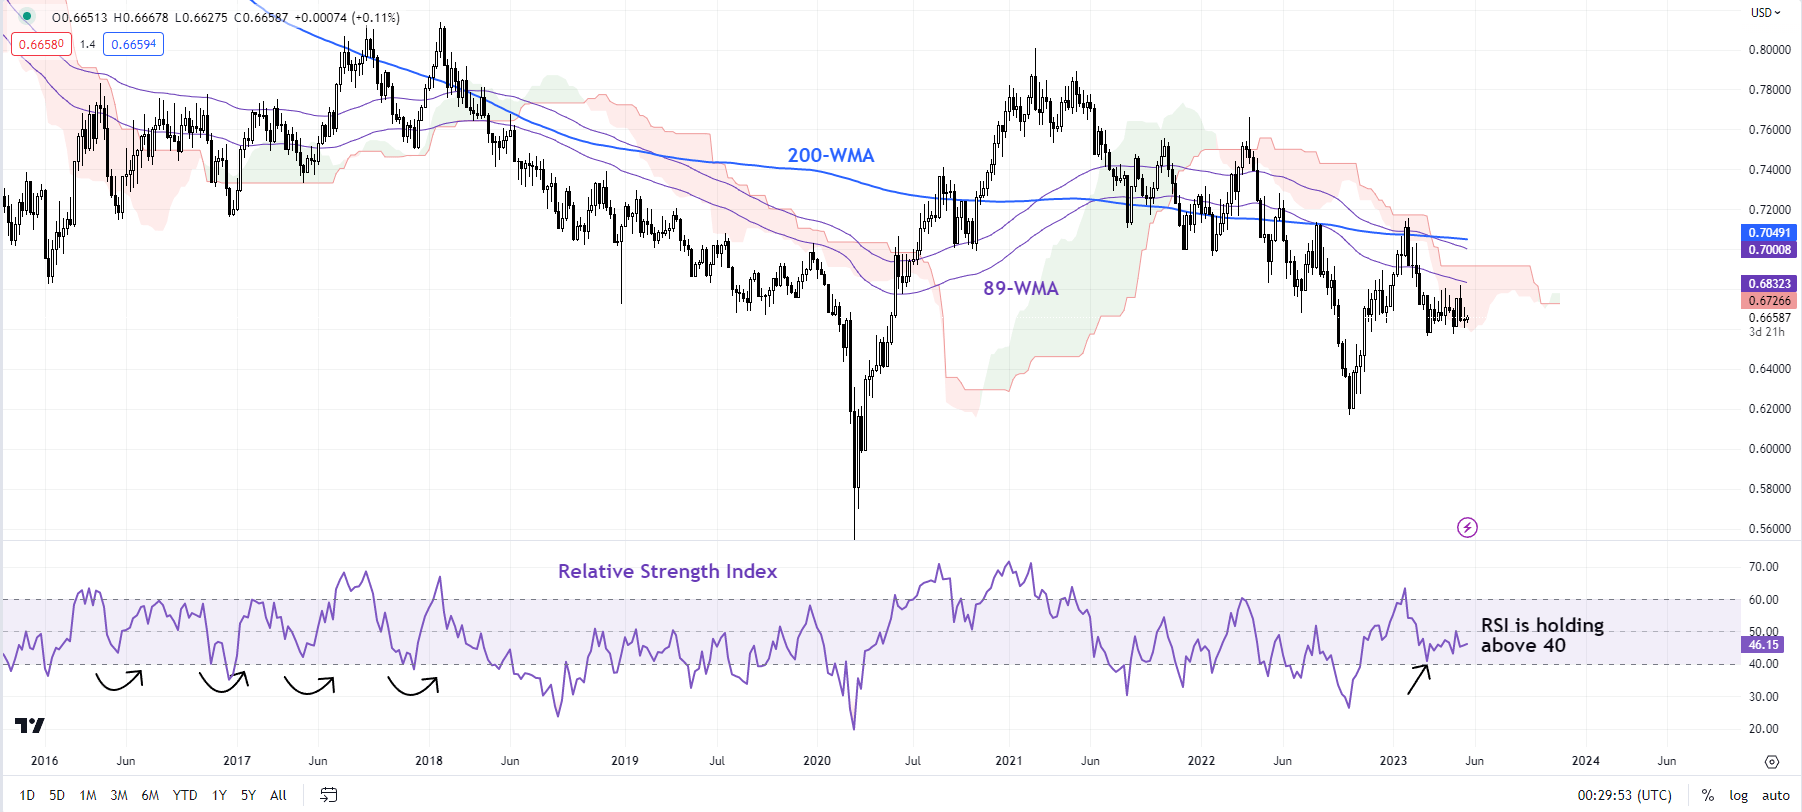
Importantly, the 14-week Relative Strength Index is holding above the 35-40 level – in the past downward corrections within an uptrend tend to be restricted around these levels (see the weekly chart). However, any break below the cushion on a horizontal trendline from November at about 0.6585 would pose a threat to the broader bullish phase. On the upside, AUD/USD needs to cross above 0.6805 for the uptrend to resume.

EUR/AUD Daily Chart

image4.png

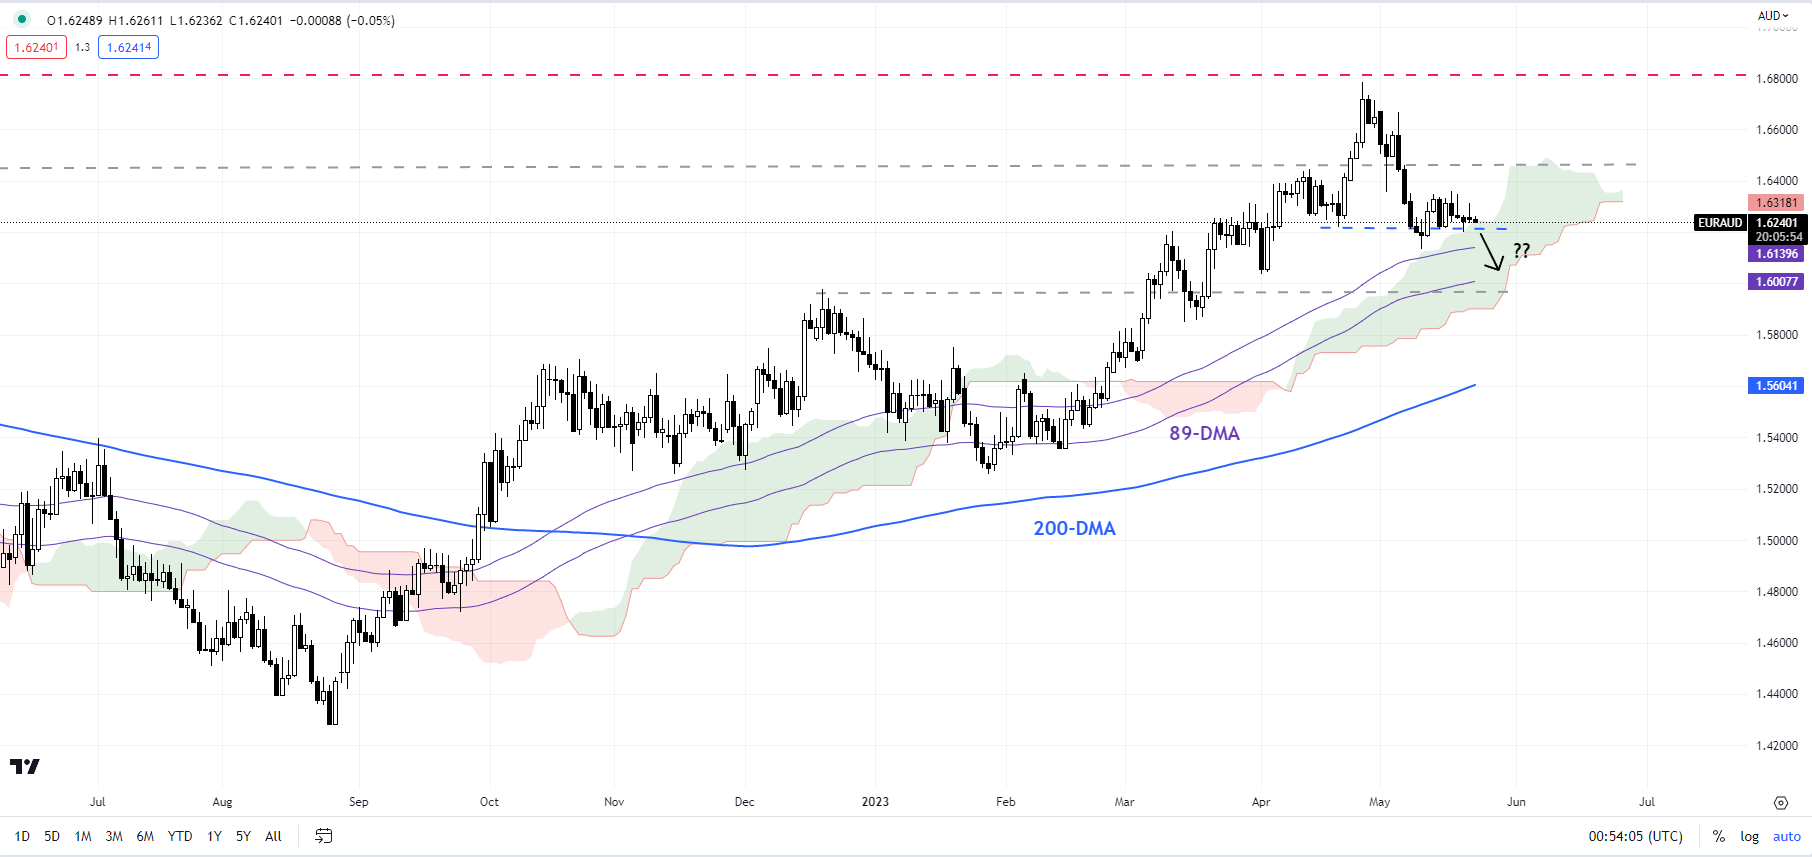
EUR/AUD: Some more downside?

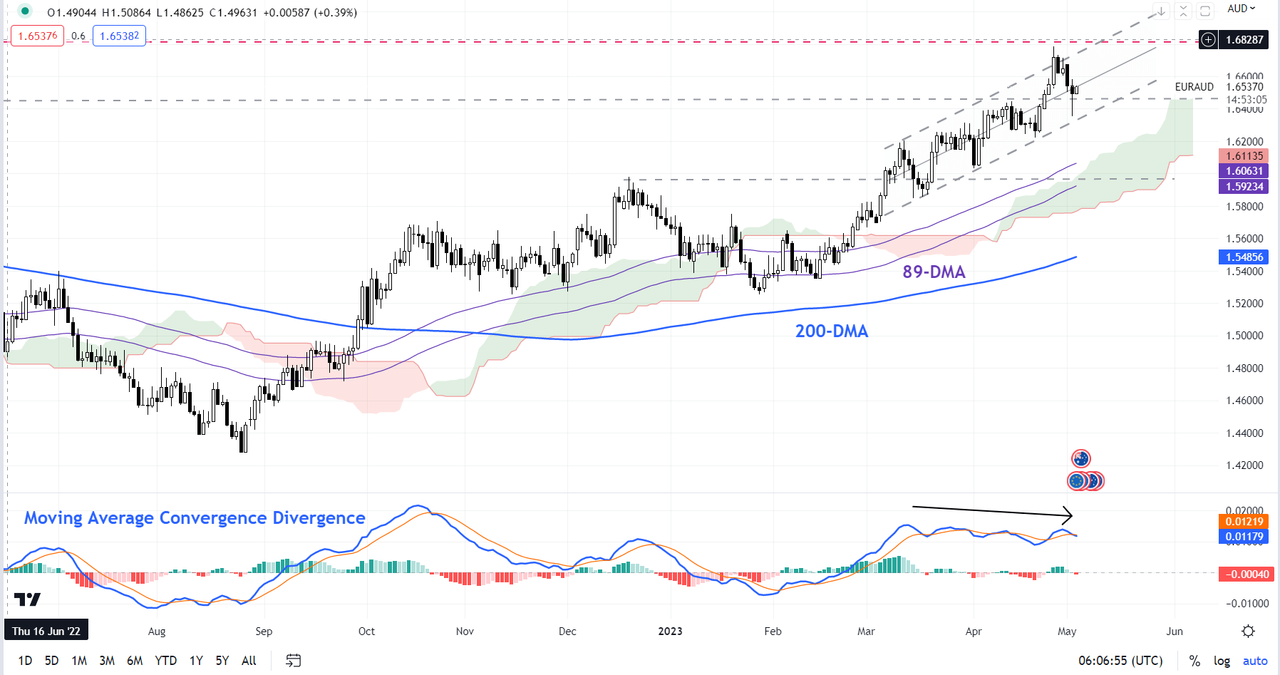
EUR/AUD has been struggling to hold above the late-April low of 1.6360, raising the risk of a drop toward 1.5950-1.6000 (including the December high and the 89-day moving average). This follows a retreat last month from a tough barrier at the October 2020 high of 1.6825. For more discussion see “Australian Dollar Ahead of Budget: AUD/USD, AUD/JPY, EUR/AUD Price Setups”, published May 9.

EUR/AUD Daily Chart

image5.png

Chart Created by Manish Jaradi Using TradingView

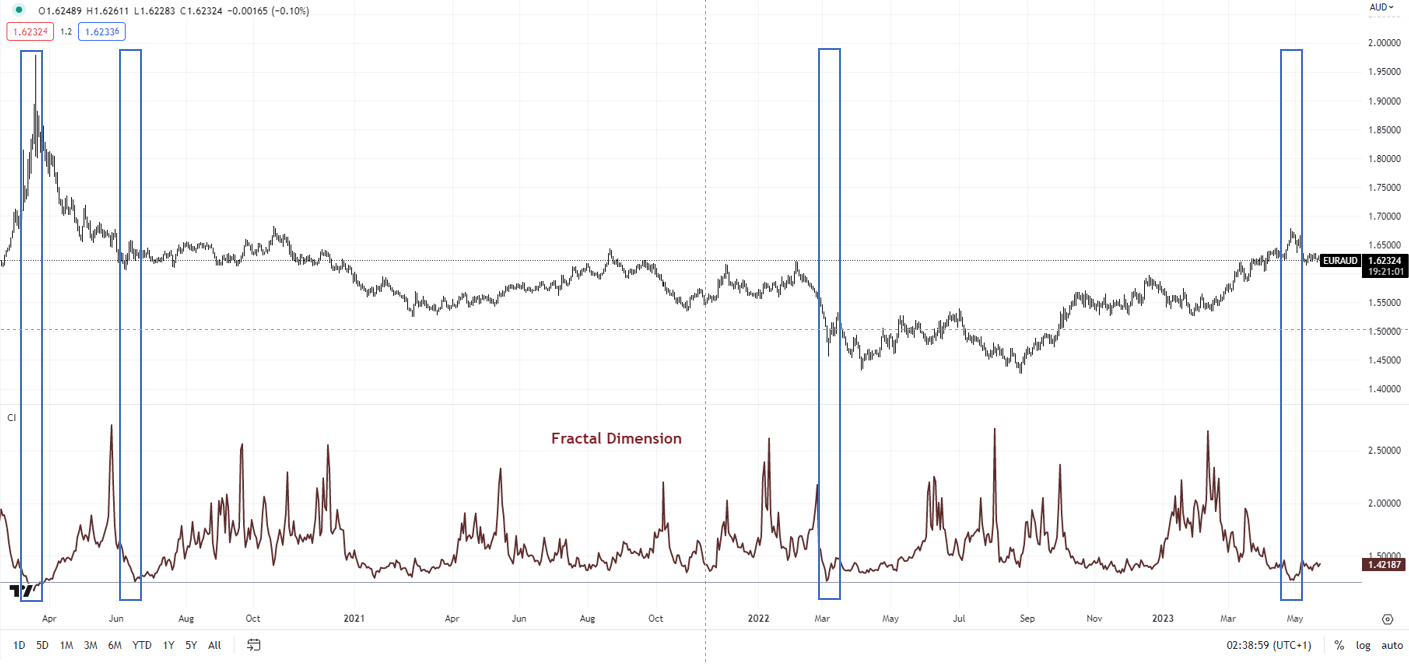
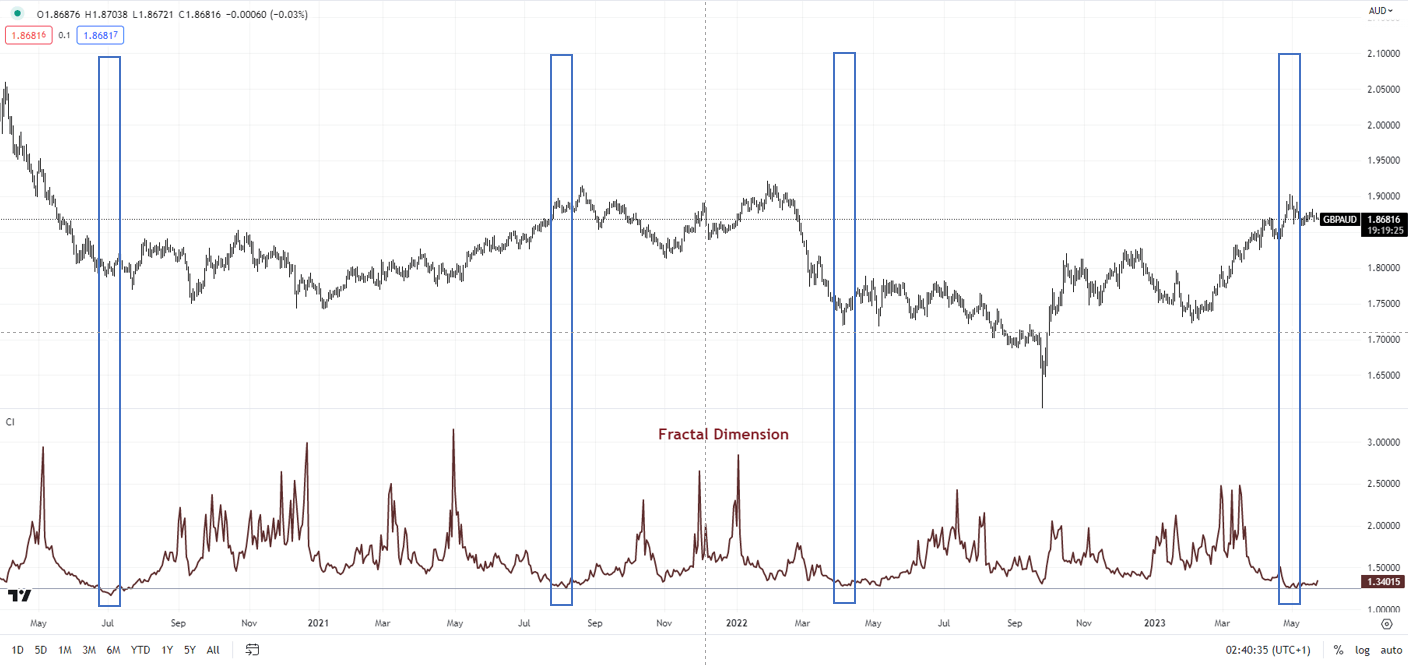
Also, market diversity, as measured by fractal dimensions, appears to be low as EUR/AUD hit a multi-month high last month. Fractal dimensions measure the distribution of diversity. When the measure hits the lower bound, typically 1.25-1.30 depending on the market, it indicates extremely low diversity as market participants bet in the same direction, raising the odds of a price reversal. For EUR/AUD, the 65-day fractal dimension fell to around 1.26, very close to the red flag threshold of 1.25. (See chart.)

GBP/AUD Daily Chart

image6.png

GBP/AUD: Rally fatigue

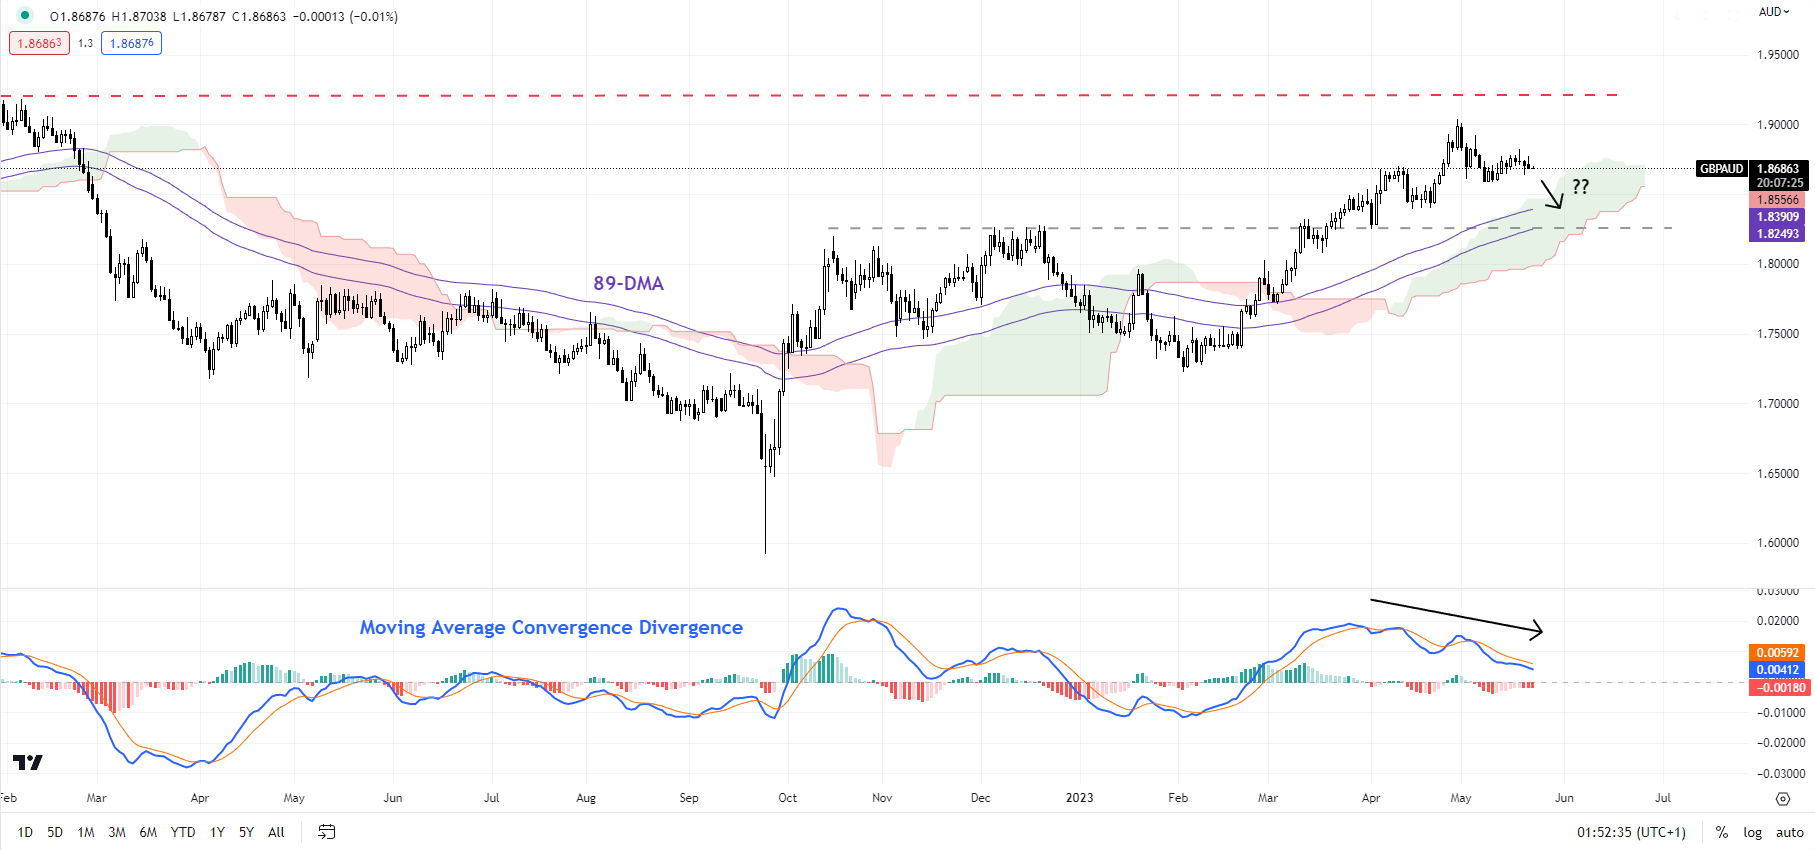
GBP/AUD’s sharp retreat from a near-stiff ceiling on a horizontal trendline from 2021, at about 1.9150, suggests some fatigue in the rally. While this doesn’t mean the multi-month uptrend is reversing, it probably implies a consolidation/minor retreat before another leg higher.

GBP/AUD Daily Chart

image7.png

Like EUR/AUD, market diversity in GBP/AUD appears to be low – hit the lower threshold of 1.25 recently, flashing a red flag. See “Australian Dollar Price Setup: EUR/AUD, GBP/AUD, AUD/JPY”, published May 3. Any break below immediate support at the May 11 low of 1.8575 could pave the way toward the early-April low of 1.8250.

Note: In the above colour-coded chart, Blue candles represent a Bullish phase. Red candles represent a Bearish phase. Grey candles serve as Consolidation phases (within a Bullish or a Bearish phase), but sometimes they tend to form at the end of a trend. Note: Candle colors are not predictive – they merely state what the current trend is. Indeed, the candle color can change in the next bar. False patterns can occur around the 200-period moving average, or around a support/resistance and/or in sideways/choppy market. The author does not guarantee the accuracy of the information. Past performance is not indicative of future performance. Users of the information do so at their own risk.

Crude Oil Bumped Up on Hopes of a Debt Ceiling Deal. Will WTI Break the Range?

Crude Oil Bumped Up on Hopes of a Debt Ceiling Deal. Will WTI Break the Range?

Crude oil eked out small gains to start Tuesday after seemingly positive developments in the aftermath of talks between President Joe Bidden and House Speaker Kevin McCarthy.

Post the North American close, both parties said that a default is not on the cards. McCarthy went on to say that the discussion was “productive in areas where they have a difference of opinion.”

Wall Street futures are indicating a positive start to its cash session after a mixed Monday that saw the Nasdaq add 0.50% while the Dow Jones index slipped 0.42%. It seems that the big tech names within the Nasdaq continue to garner favour.

APAC equities are mostly in the red although Australia’s ASX 200 displayed a degree of buoyancy. Japan’s TOPIX index made a fresh 33-year high before retreating.

Currency markets have had a quiet Tuesday so far and appear to be in a holding pattern until the US debt situation is resolved.

Once it has been settled, attention may turn back toward the Federal Reserve and the rate path. Overnight saw several Fed speakers voice slightly different slants on where they see policy heading.

The mostly hawkish rhetoric came from Minneapolis Federal Reserve President Neel Kashkari, San Francisco Federal Reserve President Mary Daly and St. Louis Federal Reserve President James Bullard.

The less hawkish comments suggesting a pause in hikes came from Atlanta Federal Reserve President Raphael Bostic while Richmond Fed President Tom Barkin deferred from pre-judging what the next decision will be at the Federal Open Market Committee (FOMC) meeting.

JP Morgan CEO Jamie Dimon also warned that interest rates could go as high as 6 or 7%. He made similar comments back in February. The Fed funds target rate is currently 5.0 – 5.25% and the next meeting will be in mid-June.

Gold is treading water near US$ 1,960 an ounce and silver has also softened to be near US$ 23.56 an ounce.

The WTI futures contract is over US$ 72 bbl while the Brent contract is a touch above US$ 76 bbl. Canadian wildfires continue to impact production output there.

The weekly US Energy Information Agency (EIA) data will be released on Wednesday, and it will be closely watched after last week’s surprise leap in oil inventory.

European and North American PMIs will be released today and Bank of England Governor Andrew Bailey will be testifying on monetary policy.

WTI CRUDE OIL TECHNICAL ANALYSIS

WTI failed to overcome resistance at 73.93 last Friday when it made a high at 73.58 and these levels may continue to offer resistance.

The 34- and 100-day Simple Moving Average (SMA) is just above these levels and may lend resistance.

On the downside, support might reside at the breakpoints and prior lows of 69.41, 66.82, 66.12, 64.36, 63.64 and 62.43.

image1.png


US Dollar Smile Theory: How Does Economic Resilience or Recession Drive USD?

US Dollar Smile Theory: How Does Economic Resilience or Recession Drive USD?

A “floating” currency – or one that is influenced by the natural forces of the market – tends to have a positive relationship with its economy. In other words, if growth is expected to outperform and bolster inflation, causing the central bank to raise interest rates, that tends to boost the currency and vice versa. There are always exceptions, however, such as the US Dollar.

Have you ever heard of the “Dollar Smile Theory”? This is a concept that helps explain why the US Dollar tends to rise when the economy is not only strongly outperforming, but also when it is experiencing trouble, such as a recession. Everything in between these two extremes is where the currency often finds itself under pressure.

To understand why this relationship exists, you need to have a basic understanding of the US Dollar’s unique role in global financial markets. It is the global reserve currency. According to the Bank for International Settlements, in 2019 the USD was used in about 90% of global FX transactions. This means it is the world’s most liquid trading instrument.

The saying goes when the US sneezes, the world catches a cold. During times of economic stress, flight to safety means traders often need to liquidate market positions. Their go-to choice is often US Dollars, making it a haven-linked trading instrument. This influx of demand helps explain why the currency tends to rise during recessionary periods. Compared to a handful of assets, the US Dollar tends to do the best during the onset of recessions in the United States.

Trading Strategies and Risk Management

Global Macro

Recommended by Daniel Dubrovsky

Start Course

The chart below visualizes the “Dollar Smile Theory”. But, how can you use this information to your advantage? Well, the purpose of this article is to quantify the concept and show you how this relationship works in the real world. I will be looking at the dollar’s interaction with the following economic data: gross domestic product (GDP), the unemployment rate, ISM manufacturing PMI, and vehicle sales. By the end of the article, hopefully, you can walk away with a better understanding of USD.

US Dollar Smile Theory

US Dollar Smile Theory

Setting Some Ground Rules

Before diving into economic data, let us set some ground rules. The first is that all the data is quarterly since 1976 expressed in year-over-year terms. The second is that for each economic indicator, I have removed extreme outliers (beyond +- 3 standard deviations from the average). What is left behind is underlying data matching an underlying US Dollar.

This helps increase the statistical significance and reduce variability. Also, for the most part, each economic indicator will have outliers removed from different quarters. Finally, I will be using the Bloomberg Correlation-Weighted US Dollar Index (BCWI). This is because I want to capture the general movement in the currency as opposed to a given exchange rate.

Testing Gross Domestic Product (GDP)

Can you spot the “U-shaped” relationship between GDP (or economic growth) and the US Dollar below? That is the smile theory put into action with real economic data. The curve can be broken down into two green zones on the left and right (where USD is expected to be positive for given values of GDP), and a red zone (where the currency is anticipated to weaken). Somewhere between 1.5% – 4.0% GDP (Y/Y) is the “damage” zone for USD, or when the currency is seen falling compared to a year ago. Values of growth outside of this range show USD rising on average.

It should be noted that there is a plethora of factors that can impact how the USD performs in a quarter compared to a year ago. That is why sometimes you will see the dollar doing well around the “red zone” of GDP and poorly in the “green zone”. The purpose of this study is to focus on just the economic indicator alone, highlighting a non-linear relationship with the US Dollar.

Forex for Beginners

Forex for Beginners
Recommended by Daniel Dubrovsky
Forex for Beginners
Get My Guide

GDP YoY Quarterly Since 1976 (Outliers Removed)

GDP YoY Quarterly Since 1976 (Outliers Removed)

Testing the Unemployment Rate

What about the unemployment rate? Like GDP, there is also a “U-shape” relationship with the US Dollar. The tricky thing here is that you need to think about unemployment in reverse terms compared to GDP. When the unemployment rate is rising, that is not good for an economy and vice versa.

In this data, it seems the “danger” zone for the US Dollar is when the unemployment rate is seen performing somewhere between -5% and +25% (Y/Y). When this economic indicator clocks in outside of this range, the US Dollar has historically tended to rise against its major counterparts.

Unemployment Rate YoY Quarterly Since 1976 (Outliers Removed)

Unemployment Rate YoY Quarterly Since 1976 (Outliers Removed)

Testing ISM Manufacturing PMI

Now let us look at ISM Manufacturing PMI to gauge the impact of activity in the industrial sector on the currency. Here too you can find a “U-shaped” relationship. It seems that the “danger” zone for the US Dollar is when this indicator performs -5% to +30% (Y/Y). Outcomes outside of this range seem to open the door for the US Dollar to outperform.

ISM Manufacturing PMI YoY Quarterly Since 1976 (Outliers Removed)

ISM Manufacturing PMI YoY Quarterly Since 1976 (Outliers Removed)

Testing Vehicle Sales

Finally, I will wrap this up with the total number of new vehicle sales, expressed in year-over-year terms. Just like GDP, the unemployment rate and ISM manufacturing PMI, you can also see a “U-shaped” relationship with the US Dollar. The “danger” zone for the currency seems to occur when vehicle sales report between -7.5% and +7.5%. Meanwhile, the US Dollar on average tends to appreciate when outcomes are outside of this zone.

Vehicle Sales YoY Quarterly Since 1976 (Outliers Removed)

Vehicle Sales YoY Quarterly Since 1976 (Outliers Removed)

Conclusion

With that in mind, hopefully, you have a better idea of what the US Dollar Smile Theory is and how it works in real life. The key takeaway is that the currency tends to appreciate handsomely when economic data greatly outperforms and significantly underperforms, such as during recessions. Somewhere in-between these extreme outcomes are where the currency tends to weaken, and I tried to quantify that for you. If you have enjoyed this special report, feel free to follow me on Twitter for ongoing updates!

Treasury yields tumble as investors weigh debt ceiling talks, Fed rate policy

Treasury yields tumble as investors weigh debt ceiling talks, Fed rate policy

U.S. Treasury yields declined on Monday as investors fretted over debt ceiling deal negotiations and assessed what could be next for Federal Reserve interest rate policy after mixed messages from officials.

At 6 a.m. ET, the 10-year Treasury

was trading more than 3 basis points lower at 3.659%. The yield on the 2-year Treasury

was last up by over 4.6 basis points to 4.243%.

Yields and prices move in opposite directions and one basis point equals 0.01%.

Talks about a debt ceiling deal are set to continue Monday, with President Joe Biden and House Speaker Kevin McCarthy expected to meet for negotiations. If a resolution is not found, the U.S. risks defaulting on its debt as soon as June 1.

Talks stalled late on Saturday as the two sides struggled to come to an agreement. On Sunday, Biden called for the Republicans to “move from their extreme position”, while McCarthy told reporters that Biden needed to “get away from the socialist wing of the Democratic party and represent America.”

They would both need to compromise to reach a deal, McCarthy added.

Investors also weighed the outlook for central bank interest rate policy after Fed officials gave mixed messages about whether rate hikes should be halted last week.

On Friday, Fed Chairman Jerome Powell said inflation was still too high, but interest rates may not have to go as high as previously expected to curb it, owing to recent banking sector turmoil.

More central bank speakers are due to speak Monday ahead of the release of minutes from the Fed’s last meeting on Wednesday.

Shadow Board is divided over whether the Reserve Bank should increase the OCR in May

Shadow Board is divided over whether the Reserve Bank should increase the OCR in May

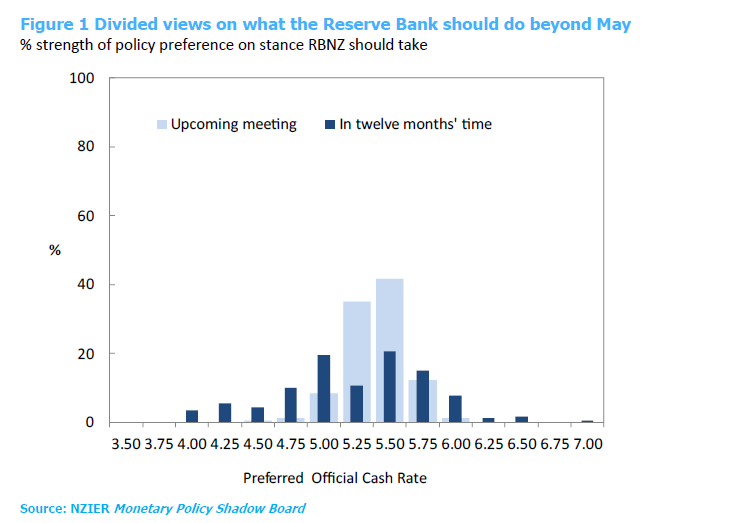
The Shadow Board is divided over whether the Reserve Bank should increase the Official Cash Rate (OCR) in the May Monetary Policy Statement. A larger number of Shadow Board members viewed an OCR increase of 25 basis points to 5.50 percent is warranted, given domestic inflation pressures remain high and the upside risk to inflation due to the weather events earlier this year. The rest of the Shadow Board members recommend the Reserve Bank should keep the OCR at 5.25 percent. One member highlighted that household inflation expectations are already heading in the right direction, and monetary policy takes time to have an impact. One was also concerned about the continued decline in profitability for businesses as consumers are increasingly more cautious about spending.

There was a divergence in views amongst the Shadow Board on where the OCR should be in twelve months. They reflect the different concerns held by the Shadow Board members about the economic outlook for the coming year. Recent developments, such as weaker Government tax revenue and consumer spending, and continued declines in business profitability, point to a slowing in the New Zealand economy. Two members also pointed out the potential upside risk to inflation from rising net migration inflows and any new fiscal stimulus in the new Budget, which the Reserve Bank should keep their eyes on.

SB0523fig1

Table 1 Particpants’ comments

Participant comments are optional

Stephen Toplis As we approach a turning point, the margin for error grows. The relative supply/demand impact of migration is a huge uncertainty and could well be the key determining factor for the next year or so. Keep an eye on the state of fiscal stimulus too.
Viv Hall No comment.
Kirk Hope No comment.
Jarrod Kerr The Kiwi economy has turned sharply over the last 6 months.  Government revenues, through corporate tax and GST, are coming in below forecast.  The downshift in the Govt’s coffers confirms the downshift in spending on Kiwibank credit and debit cards. Household consumption has cooled, and looks to be contracting. The recession the RBNZ says we have to have is upon us.
Jo Tozer Rising costs and cautious consumer spending are hitting businesses hard. MYOB’s 2023 Business Monitor reveals 45% of SMEs saw their profitability decline in the last three months and revenue for the past 12 months is down for 1/3 of local operators. Over a third of the SMEs concerned about the impact of rising interest rates on their business finances, said they’d need to dip into their personal finances for their business if interest rate increases continue.
Arthur Grimes No comment.
Kelly Eckhold No comment.
Kerry Gupwell While overall inflation seems to have peaked, domestic (non-tradable) inflation remains a concern and cyclone Gabrielle hasn’t helped. It will be interesting to see what the May budget reveals as well – especially in an election year. On balance, I think another 25 basis points increase in the OCR is warranted, although there are signs that companies and households are starting to tighten their belts.
Dennis Wesselbaum PPI and CPI are falling, mortgage repayment liabilities are increasing, jobseeker support is up, and so is hardship assistance. CPI is still outside the target range, but median household inflation expectations are moving in the right direction. Given the lags of monetary policy, I would stop increasing the OCR.


UN Secretary-General’s press encounter at G7 Summit

UN Secretary-General’s press encounter at G7 Summit

My message to G7 leaders is clear: while the economic picture is uncertain everywhere, rich countries cannot ignore the fact that more than half the world – the vast majority of countries – are suffering through a deep financial crisis.

The crushing economic impact of the COVID-19 pandemic, the climate crisis, Russia’s invasion of Ukraine, unsustainable levels of debt, rising interest rates and inflation are devastating developing and emerging economies.

Poverty and hunger are rising; development is sinking.

As I see it, the problems facing developing countries have three dimensions: moral, power-related, and practical.

First, moral.

There is a systemic and unjust bias in global economic and financial frameworks in favour of rich countries, which is naturally generating great frustration in the developing world.

Access to COVID-19 vaccines was deeply unfair.

The recovery has been extremely unbalanced. Rich countries recovered from the economic impact of the pandemic with expansionary monetary and fiscal policies. Trillions and trillions were spent. Basically, they printed money and spent their way out of trouble.

But developing countries, many with substantial debts, were unable to do so. If they did, they would have seen their currencies sinking.

On the other hand, the IMF allocated 650 billion US dollars in Special Drawing Rights – or SDRs – during the pandemic. The G7 countries, with a population of 772 million people, received 280 billion US dollars. The African continent, with 1.3 billion people, received only 34 billion US dollars.

And this was done according to the rules. It was done by the book, but from a moral point of view, there is something fundamentally wrong with the rules themselves.

Around the world, fifty-two countries are in technical default, at high risk of default, or face extremely expensive market financing. Middle Income Countries, including many small island developing states – with few exceptions – do not qualify for concessional funding and have no access to debt relief.

Second, the power dimension.

The Bretton Woods system and the Security Council reflect the power relations of 1945.

And many things have changed since then. The global financial architecture became outdated, dysfunctional and unfair.

In the face of the economic shocks from the COVID-19 pandemic and the Russian invasion of Ukraine, it has failed to fulfil its core function as a global safety net.

It’s time to reform both the Security Council and the Bretton Woods institutions.

This is essentially a question of redistributing power in line with the realities of today’s world.

Third, the practical problem.

Even within the present unfair global rules, more can and must be done to support developing economies.

We have proposed an SDG Stimulus that would provide an effective mechanism for debt relief and scale up long-term and contingency funding.

If Multilateral Development Banks would work together and changed their business models and approach to risk, they could leverage enormous amounts of private finance for developing countries at reasonable cost. And without a massive amount of private finance there would be no effective climate action and there would be no way to implement the Sustainable Development Goals.

Massively reallocating SDRs – as Japan has done and others should follow –and channelling them through Multilateral Development Banks would have a multiplying effect on finance for sustainable development.

Innovative financial tools could enable swaps that convert debt into investments in climate adaptation to build resilience in vulnerable communities around the world.

The list goes on.

But ladies and gentlemen of the media,

G7 countries are also central to climate action.

With the present policies, we are heading for a temperature rise of 2.8 degrees by the end of this century. The next five years are likely to be the hottest on record.

Climate action is working but not enough and we are clearly off track to limit temperature rise to 1.5 degrees Celsius by the end of the century.

The Acceleration Agenda I proposed aims to make up for lost time.

It calls for all G7 countries to reach net-zero as close as possible to 2040, and for emerging economies to do so as close as possible to 2050.

The Climate Solidarity Pact we suggested calls on all G7 countries, national and multilateral development banks, and the private sector, to mobilize financial and technical resources to support emerging economies that today are large emitters to accelerate decarbonization – so that we stay within the 1.5-degree limit of global heating.

And this requires faster timelines to phase out fossil fuels and ramp up renewables.

It means putting a price on carbon and ending fossil fuel subsidies.

It’s high time for developed countries to provide the promised $100 billion US dollars per year.

And the Loss and Damage Fund agreed in Sharm el-Sheikh must be operationalized.

Ladies and gentlemen of the media,

The city of Hiroshima is a testament to the human spirit. It’s my third visit to this city and I feel always very emotional when coming back.

Whenever I visit, I am inspired by the courage and resilience of the hibakusha.

The United Nations stands with them. We will never stop pushing for a world free of nuclear weapons.

I thank Japan for its generous support to the Youth Leader Fund for a World Without Nuclear Weapons. We must invest in and empower today’s young people to be changemakers for a safer and more secure world.

At the same time, Hiroshima is a global symbol of the tragic consequences when nations fail to work together and settle their differences peacefully.

In our multipolar world, as geopolitical divisions grow, no country or group of countries can stand by as billions of people struggle with the basics of food, water, education, healthcare, and jobs.

Here in Hiroshima, it’s time to demonstrate global leadership and global solidarity.

Thank you.

Question: Thank you very much for your time today and for making time for this news conference. You have very strong words for the current global institutions right now, calling them outdated and unfair. Do you think the same could be said for the G7 as well? And I think there was a lot of focus on engaging with the Global South at this summit? Perhaps with the understanding that traditional global institutions are becoming maybe obsolete and need to change. How successful do you think of this G7 Hiroshima Summit has been in engaging the Global South? Thank you.

Answer: So, the G7 is a voluntary association. It is not an institution that is the defined by international law. The G7 as a voluntary association is free to do whatever its members decide. The Bretton Woods system and the Security Council are supposed to do what they were created for.

What I believe is clear. It’s that there is a growing conscience in developed countries – and I felt it in the G7 – that not enough is being done,  both to reform outdated institutions and at the same time, to I would say remove the frustration of the Global South by an effective policy of solidarity with the Global South.

We’ll see now what is the impact of the discussions that were held here in Hiroshima, in which G7 members were able to discuss with some of the most important emerging economies in the world.

Question: Thank you, Secretary-General. My question is about G7 leaders’ Hiroshima Vision document. This document states that nuclear weapons should serve defensive purposes, different aggression and prevent war and portion. What is your question about this part of a document, which can be understood as just justifying the position of nuclear weapons? And I would also like to know your opinion about the title of the document containing this sort of justification being entitle Hiroshima vision. Thank you.

Answer: Well, I’m not a commentator of documents. I think it’s important to say, what I believe should be done. I don’t think we can give up on our main objective, which is to have a world free of nuclear weapons. And one thing that disturbs me is that disarmament that was moving forward quite positively during the last decades of the 20th century has completely stopped. And we are even seeing a new race to armaments. I think it is absolutely essential to reintroduce disarmament discussions about nuclear weapons and I think it is absolutely necessary that countries that own nuclear weapons commit not to do the first use of those weapons,, and I would say commit not to use them in any circumstance. And so, I think we need to be ambitious in relation to the capacity of one day, I hope still in my lifetime, to see this world without nuclear weapons.

Question: James Bays from Al Jazeera. Secretary-General, firstly, on what you were talking about your bold plans for major change to the global financial architecture. Do you find the G7 listening seriously to you? And secondly on Ukraine, President Zelenskyy. Here, it’s an issue that’s very important to this G7 and the key development seems to be that Ukraine is going to get F16 fighter jets. Is this an escalation or legitimate self defense?

Answer: Well, first of all, in relation to the needs for reform of the international financial system, I had the occasion to express to the members of the G7 exactly what I have said today. And I would say that that there is a growing conscience that our international financial system is not able to respond to the challenges of today. The system was created, as I mentioned, in 1945. It was created reflecting the world at the time and the power relations at the time. This has changed. The economy has grown. The World Bank, to give you an example, has today, a paid-in capital that is in percentage of GDP less than one fifth of what it was in 1960. And everybody agrees that this is not a situation in which the present system is able to work as the global safety net that is supposed to be. And so I felt that there was in the discussion a growing conscience that these questions of structural reform of the international financial system need to be addressed and there was an immediate positive response in relation to the reforms of the multilateral development banks.

So I hope that this difficult task will be able to start and I strongly encourage all countries developed and developing to work together to make it happen.

In relation to the decisions about the situation in Ukraine. I have to say that I am not the Secretary-General of the G7, I’m the Secretary-General of the United Nations.

Question: So is it a good thing or a bad thing Secretary-General?

Answer: I think it’s important that we reach a just peace based on international law, the charter of the United Nations and the respect for territory integrity.

Officials, scholars upbeat on high-quality growth trend of Chinese economy

Officials, scholars upbeat on high-quality growth trend of Chinese economy

China’s economy has posted better-than-expected recovery so far this year, with market demand continuously picking up and economic growth rebounding, Chinese officials and scholars said during a weekend key forum. While acknowledging there are some short-term challenges like that the endogenous driving force is still weak and demand insufficient, they predicted the economy’s long-term bright prospect and high-quality growth trend will remain unchanged.

Experts said domestic demand expansion is crucial for sustainable economic rebound, urging the authorities to come up with a slew of reform policies to elevate market confidence, expand effective social investment and cultivate new drivers for growth, especially consolidating the self-reliance and strength in science and technology.

“The Chinese economy follows a generally upward growth trajectory this year, and enters fast-lane of economic recovery,” Wang Yiming, deputy head of the China Center for International Economic Exchanges, said at the Tsinghua PBCSF Global Finance Forum held in Beijing over the weekend.

The country’s export growth has exceeded expectations, growing 10.6 percent year-on-year in yuan-denominated terms in the first four months in 2023. Consumption reported noteworthy rebound, with the retail sales of consumer goods surging 18.4 percent year-on-year in April. The investment sector maintains overall stability, while investment in manufacturing and infrastructure grew comparatively fast.

Currently, the key for the economy to steadily recover and pick up relies on the recovery and expansion of demand, Wang said, urging strengthened confidence and patience for sustainable economic recovery.

“Having been battered by the COVID-19 outbreak over the past three years, the Chinese economy will unlikely be restored overnight and the economic recovery will not repeat an old path,” Wang said. “We should turn the process of economic recovery into a process of transforming the country’s growth model, optimizing economic structure and cultivating new growth drivers in order to boost continuous rebound and start a new round of economic growth cycle.”

Ding Zhijie, director of the Foreign Exchange Research Center of the State Administration of Foreign Exchange (SAFE), said at the same forum that the long-term bright prospect and high-quality growth trend of the Chinese economy will remain unchanged despite short-term challenges.

China’s economic system as a super-large market is resilient, as the country’s per capita GDP hovered above $12,000 in 2022 and the added value of China’s manufacturing sector accounts for nearly 30 percent of global total, indicating continuous improvement in economic structure, he said.

In addition, China’s monetary policies and macro-economic measures are independent, and make adjustments in line with domestic macro-economic situation and consumer prices. The long-term stable inflation level in China enables the country to maintain monetary policy autonomy amid the US and European countries’ inflation tides, according to Ding.

Looking ahead, we project that China’s nominal resident spending will reach 10 to11 percent in 2023, as the recovery of urban service activities, especially those of smaller enterprises, will help increase employment and residents’ income, and the release of excess savings will also boost consumption recovery, UBS economists led by Wang Tao wrote in a research note they sent to the Global Times.

The economists maintained the forecast for China’s GDP growth rate of 5.7 percent. “China’s consumer price index (CPI) is expected to gradually rebound in the second half of the year, given joint effects of price rise in pork, services price rebound following economic reopening and lower base,” they noted.

Showing confidence in China’s development potential, international organizations and agencies like the World Bank and the IMF have also revised up their 2023 growth projections for China lately.

The UN launched the World Economic Situation and Prospects as of mid-2023 on May 16, updating China’s growth forecast from 4.8 percent to 5.3 percent for 2023.

Policy support

In order to maintain long-term economic growth with a certain scale, efforts are needed for continuous improvement of the socialist economic system with Chinese characteristics, Wu Xiaoqiu, dean of the China Capital Market Research Institute, told the Global Times on the sidelines of the forum.

Only by restoring the confidence of consumers from the roots, could the Chinese economy enter a normal development track and showcase vitality and competitiveness, he said.

Meanwhile, Wang also suggested authorities should come up with a series of reform policies to elevate confidence of private enterprises and entrepreneurs and expand effective social investment, nurture new drivers of economic growth and boost foreign investment.

A meeting convened by the Political Bureau of the Communist Party of China (CPC) Central Committee on April 28 pointed to efforts in making proactive fiscal policy more effectual and prudent monetary policy more targeted and effective so as to create synergy for expanding demand. The guiding role of government investment and policy incentives should be well leveraged to effectively stimulate private investment.

The meeting also noted that China needs to consolidate the foundation of technological self-reliance and self-improvement, and cultivate new driving forces for growth.

Zhang Yansheng, chief researcher from the China Center for International Economic Exchanges, told the Global Times on the sidelines of the forum that it’s urgent to raise the share of household disposable income in GDP, the share of consumer spending in GDP as well as the share of middle-income groups in the country’s total population in order to expand domestic demand.

He said this could be done through measures including initial, second and third distribution systems, improvement in public services, employment priority policy and increase in population quality.

As for the prospect of China’s foreign trade, Zhang expressed optimism despite weakening external demand and growing geopolitical tensions. “We should be confident of our government and private enterprises. The country’s foreign trade is more resilient as analysts expected, and will blaze a path toward stable growth enabled by green economy and technologies,” he said.