Chinese Stocks Close to Erasing 2023 Gain as Headwinds Intensify

Chinese Stocks Close to Erasing 2023 Gain as Headwinds Intensify

China’s benchmark stock index erased all its gains for the year as a weaker yuan and developers’ debt woes added to persistent worries over growth and geopolitics.

The CSI 300 Index closed down 1.4% Wednesday, with the energy and financial sectors leading the decline. The benchmark is among the worst performers in Asia this year, compared to a more than 3% advance in the MSCI Asia Pacific Index and double-digit gains for gauges in Japan and South Korea.

Chinese stocks have steadily fallen out of favor since a reopening rally fizzled at the end of January, belying bullish conviction calls from Wall Street analysts at the start of 2023. Weaker-than-expected economic data have prompted banks from JPMorgan Chase & Co. to Barclays Plc to slash their growth forecasts, while worries over worsening ties with Western countries have also hurt sentiment.

Developers’ financial woes were again in focus on Wednesday, with a number of local government financing vehicles struggling to repay debt on time. A Bloomberg gauge of Chinese builders shed more than 2%, falling for the 11th session in its longest such streak since 2018.

Read: China LGFV’s Last-Minute Bond Payment Highlights Local Struggles

“It looks like it’s going to be a grueling year,” said Dai Yuzhong, a fund manager at Shanghai Shinyu Private Fund Management Co. “The pessimism in the market is spreading, and negatives ranging from the yuan losing the 7 level to worries about LGFV payment are putting investors on the defense.”

Outflows from foreign investors continued. They offloaded 4.5 billion yuan ($635 million) after a $1.1 billion selloff via trading links with Hong Kong on Tuesday.

Tensions between China and the US have heated up as Beijing banned purchases of Micron Technology Inc.’s products on national security grounds, which ignited accusations of over-reach from US officials.

Traders are also watching how China’s new Covid wave, which is forecast to peak at about 65 million infections a week toward the end of June, may affect the recovery.

Read: US Must Widen China Chip Curbs in Micron Riposte, Lawmaker Says

Investors this year have turned to more themed trades as the macro environment deteriorated. State-owned enterprises have witnessed eye-popping gains after regulators called for building a valuation system with Chinese characteristics, a term some interpreted as a signal to boost valuations. Artificial intelligence-related companies also saw frenzied trading earlier this year before enthusiasm cooled.

Producer price inflation, UK: April 2023

Producer price inflation, UK: April 2023

1. Main points

  • Producer input prices rose by 3.9% in the year to April 2023, down from 7.3% in the year to March 2023.
  • Producer output (factory gate) prices rose by 5.4% in the year to April 2023, down from 8.5% in the year to March 2023.
  • Inputs of metals and non-metallic minerals, and petroleum products provided the largest downward contributions to the change in the annual rates of input and output inflation, respectively.
  • While annual producer price inflation rates have been slowing in recent months, the index levels for both input and output prices have been broadly stable since June 2022.
  • On a monthly basis, producer input prices fell by 0.3% while output prices showed no movement in aggregate in April 2023.

2. Producer price inflation rates

The annual rate of the input Producer Price Index (PPI) has now been positive for 29 consecutive months, although it has been slowing for the last 10 months. The annual rate is now 20.5 percentage points below its record annual high of 24.4% in June 2022 (Figure 1).

The annual rate of the output PPI has now been positive for 28 consecutive months, but it has been slowing for the last nine months. It is down 14.3 percentage points from its recent peak of 19.7% in July 2022.

The index levels for both input and output prices have been broadly stable since June 2022 after a period of rapid increase starting in 2021 and continuing into early 2022 (Figure 2). This levelling out, when compared with the rapid increases seen last year, has the effect of creating a fall in the annual inflation rate (Figure 1), as explained in our Beware base effects blog.

Source: Producer Price Index (PPI) from the Office for National Statistics

On-and-Off-and-On-Again Progress Toward a U.S. Debt Ceiling Agreement

On-and-Off-and-On-Again Progress Toward a U.S. Debt Ceiling Agreement

It is our view – with high conviction – that the recent on-and-off-and-now-on-again negotiations will result in a debt ceiling deal ahead of the U.S. Treasury’s “X date” on June 1 (i.e., the estimated date when the federal government would no longer have enough funds to pay its bills) – although possibly not until the (literal) eleventh hour. After all, while neither side seemingly has a political incentive to make concessions before they absolutely have to, neither side has any political incentive to default either. To use an apt, albeit graphic analogy: Passing the debt ceiling is like passing a kidney stone – we know it will pass, it is just a question of how painful it will be. We would assert we are in the painful period right now.

Indeed, while each side of the political aisle has been testing the contours of a possible debt ceiling deal with new asks (i.e., immigration reform for Republicans, tax increases for Democrats), the broad outline hasn’t changed much over the past few weeks: reclaiming unused COVID-19 money, caps on “discretionary” spending (which represents roughly 25% of the U.S. government’s $6 trillion annual budget), work requirements for specific entitlements (which poll quite well but tend to be burdensome to administer, and therefore do little from a deficit perspective), and potentially some down payment on energy-permitting reform (both traditional and clean energy). We could also see tweaks to how Medicare reimburses providers for hospital treatments.

The real obstacles, however, seem to be in the specific spending details:

  • Setting the so-called spending baseline for fiscal year 2024: If FY24 spending is reset to FY22 levels – the Republicans’ ask – it would likely drive short-term cuts in discretionary spending and produce longer-term deficit savings. If FY24 spending is set at FY23 spending levels – the Democrats’ preference – this would likely represent a freeze in discretionary spending (i.e., no cuts), but nevertheless represent longer-term deficit reduction over 10 years.
  • The depth and composition of the spending caps: The questions amount to how much slower spending growth would be when compared with the Congressional Budget Office’s (CBO) projections (i.e., how much will growth be “capped”) and how those caps would be levied on non-defense discretionary spending (everything from national parks to meat inspectors) versus defense spending. There is also a question about duration of the spending caps: Democrats want two years; Republicans have argued for 10.

Overall, we believe policymakers will find common ground that likely results in few, if any, near-term cuts to spending, but will produce longer-term deficit savings relative to the CBO’s current projections. Of course, to really tackle the fiscal sustainability of the country, policymakers would have to address the elephant in the room – entitlement spending – but that is a non-starter politically on both sides of the aisle for the foreseeable future.

When, realistically, do lawmakers need to reach a deal? Everyone is working toward the Treasury’s June 1 X date. To meet that deadline, negotiators likely need to reach a high-level deal by the middle of this week in order to craft legislative text and then proceed with House and Senate procedure. Once a deal is reached in principle, there may be further drama around garnering sufficient support for the deal among rank-and-file members, but we believe there will be sufficient support on both sides of the aisle to get a bill passed. Also, if Congress needs additional time to negotiate or to put pen to paper, it’s possible we could see a short-term extension of one or two weeks at most.

We don’t expect invocation of the 14th Amendment. Lately there has been more noise about President Joe Biden’s possible use of the 14th Amendment to effectively ignore the debt limit, citing the clause that public debt “shall not be questioned.” However, Treasury Secretary Janet Yellen continues to insist that the only way the debt ceiling can be addressed is through Congress. From a market perspective, the amendment approach seems unlikely given the uncertainty it could cause, and it also seems unlikely from a political perspective, given the expected blowback.

Market reaction: If past debt ceiling situations are prologue, equity markets may wobble this week depending on the course of negotiations, but assuming the anticipated deal crystallizes and there is no default, markets could likely retrace after a resolution. (There was an exception in 2011, when equity markets continued declining after the resolution and X date, partly due to the European debt crisis and partly due to the anticipation of large spending cuts that were part of the resolution.) With that said, we have already seen significant dislocations in the fixed income market, creating both risks and opportunities – for details, see our recent Viewpoint, “Debt Ceiling Debate: Examining Risks Around the X Date.”

Bottom line: While it will likely be a noisy next few days or week, we remain constructive on a deal coming together before the June 1 X date, with an outside possibility of a short-term extension (measured in weeks, not months). As a result, lawmakers (and markets) probably would not have to contend with the debt ceiling again until 2025, after the highly anticipated 2024 elections. No one seems to have the political incentive to compromise until the last minute, so we may see some pain and drama leading up to next week’s deadline, but the overall outcome appears clear to us: A debt ceiling resolution will pass.

EUR/USD set to fall to next support at 1.0729/14 and eventually 1.0550 – Credit Suisse

EUR/USD set to fall to next support at 1.0729/14 and eventually 1.0550 – Credit Suisse

EUR/USD risk stays seen lower for a test of the lower end of its five-month channel, analysts at Credit Suisse report.

Move above 1.0906 is now needed to warn of strength back

“EUR/USD maintains its decisive rejection from the top of the shallow uptrend channel from the beginning of January and with support from the 55-DMA removed as looked for this should confirm a more important downturn. We thus stay tactically negative looking for a fall to support next at 1.0729/14 and eventually the lower end of the channel, now at 1.0550.”

“Above 1.0906 is now needed to warn of strength back to retest 1.1097/1.1107, but with a fresh cap expected here.”


Breaking News: Hot UK CPI Augments Pound, GBP/USD Above 1.24

Breaking News: Hot UK CPI Augments Pound, GBP/USD Above 1.24

GBPUSD FUNDAMENTAL BACKDROP

The British pound rallied this morning after the UK CPI report surpassed forecast by quite some margin (see economic calendar below). Core inflation was the biggest surprise and now reached a level last seen since 1992! This almost shores up a 25bps interest rate by the Bank of England (BoE) in their next meeting. That being said, some positivity stems from the PPI metric which has slipped broadly lower. Headline inflation did fall sharply despite beating estimates; however, I do not think it is enough to deter another hike.

ECONOMIC CALENDAR

image1.png

Money market pricing has been ‘hawkishly’ revised and after Governor Andrew Bailey’s comments yesterday about the need to tackle persistently high inflationary pressures, today’s data could cement the continuation of aggressive monetary policy from the central bank. Rate expectations are now priced at almost 60bps at year end and it is likely Governor Bailey’s speech later today could be slightly more hawkish than yesterday.

The prolonging of the US debt ceiling negotiations is also a key variable for cable and the longer it drags on, the more anxious markets become.

BANK OF ENGLAND INTEREST RATE PROBABILITIES

image2.png

TECHNICAL ANALYSIS

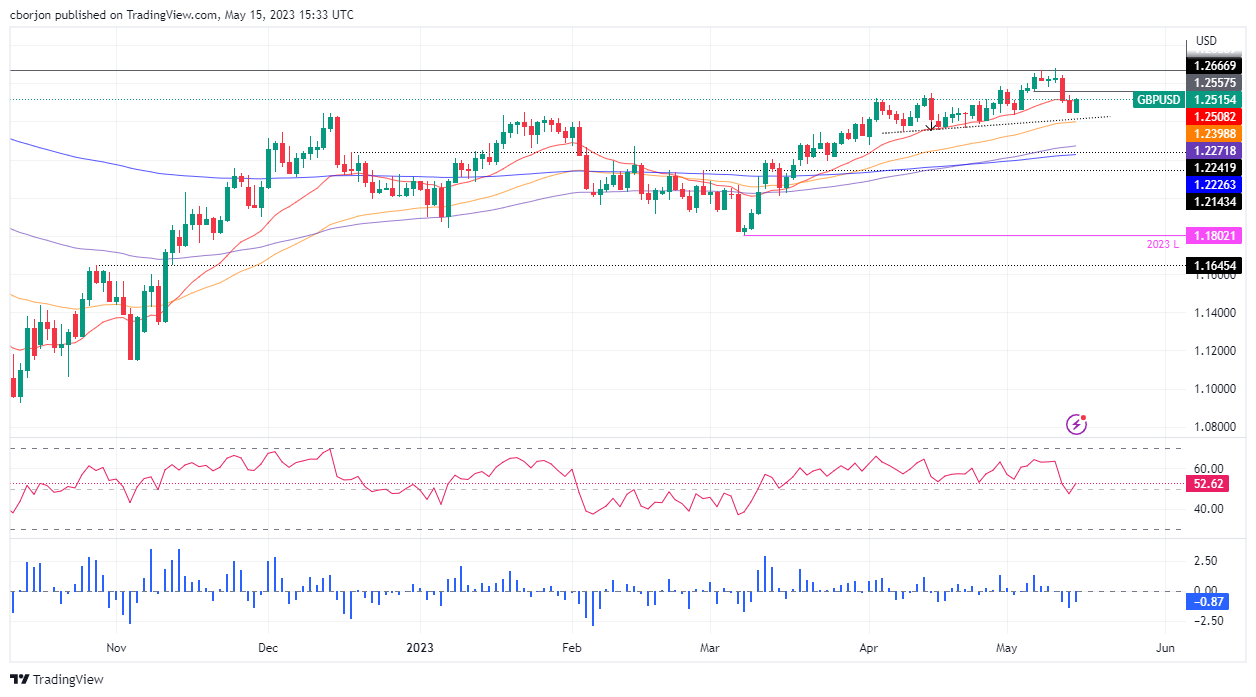
GBP/USD DAILY CHART

image3.png

Chart prepared by Warren Venketas, IG

Key resistance levels:

  • 1.2680
  • 1.2584
  • 1.2500

Key support levels:

  • 50-day MA (yellow)
  • 1.2400
  • 1.2345
  • 1.2275

BULLISH IG CLIENT SENTIMENT

IG Client Sentiment Data (IGCS) shows retail traders are currently net LONG on GBP/USD with 52% of traders holding long positions (as of this writing). At DailyFX we typically take a contrarian view to crowd sentiment but due to recent changes in long and short positioning, we arrive at a short-term upside bias.

Forex Today: Markets remain cautious as focus shifts to FOMC Minutes

Forex Today: Markets remain cautious as focus shifts to FOMC Minutes

Investors cling to a cautious approach mid-week amid a lack of progress in US debt-ceiling negotiations between Republicans and White House. US stock index futures trade modestly lower in the European morning and the US Dollar Index consolidates Tuesday’s gains. IFO sentiment survey from Germany will be featured in the European economic docket. In the late American session, the US Federal Reserve (Fed) will release the minutes of May policy meeting.

During the Asian trading hours on Wednesday, the Reserve Bank of New Zealand (RBNZ) announced that it raised its policy rate by 25 basis points to 5.5% as expected. The policy statement revealed that the RBNZ expects to hold the rate unchanged at 5.5% by September. In the post-policy meeting press conference, “we are getting on top of inflation,” RBNZ Governor Adrian Orr said and noted that the labour market was becoming less pressured. NZD/USD fell sharply and was last seen trading at its lowest level in nearly a month at 0.6150, losing more than 1.5% on a daily basis.

The UK’s Office for National Statistics reported early Wednesday that the Consumer Price Index rose 8.7% on a yearly basis in April. This reading followed the 10.1% increase recorded in March but surpassed the market expectation of 8.2%. The Core CPI, which excludes volatile food and energy prices, increased 6.8%, compared to analysts’ estimate of 6.2%. Finally, the Retail Price Index rose 11.4%, down from 13.5% in March. Following the stronger-than-expected inflation figures, GBP/USD gained traction and climbed above 1.2450.

EUR/USD touched its lowest level in two months at 1.0760 on Tuesday and spent the Asian session in a very tight range on Wednesday. The pair tries to stage a rebound early Wednesday but stays well below 1.0800. European Central Bank President Lagarde will be delivering a speech at 1745 GMT.

Following Monday’s upsurge, USD/JPY fluctuated in a narrow range on Tuesday and closed the day flat. The pair remains indecisive early Wednesday and moves up and down at around 138.50.

Gold price fell toward $1,950 on Tuesday but managed to stage a rebound in the late American session amid retreating US Treasury bond yields. XAU/USD consolidates its losses near $1,970 in the European morning.

Bitcoin registered modest gains for the second straight day on Tuesday but came under renewed bearish pressure early Wednesday. BTC/USD was last seen losing nearly 2% on the day at $26,700. Ethereum rose toward $1,900 on Tuesday but lost its traction before testing that level. ETH/USD stays on the back foot and declined toward $1,800 in the European morning.

GBP/USD climbs above 1.2450 after hot UK inflation data

GBP/USD climbs above 1.2450 after hot UK inflation data

GBP/USD has gathered bullish momentum and climbed above 1.2450 early Wednesday. The data from the UK showed that the annual core CPI rose 6.8% in April, surpassing the market expectation and the March reading of 6.2% by a wide margin, providing a boost to Pound Sterling.

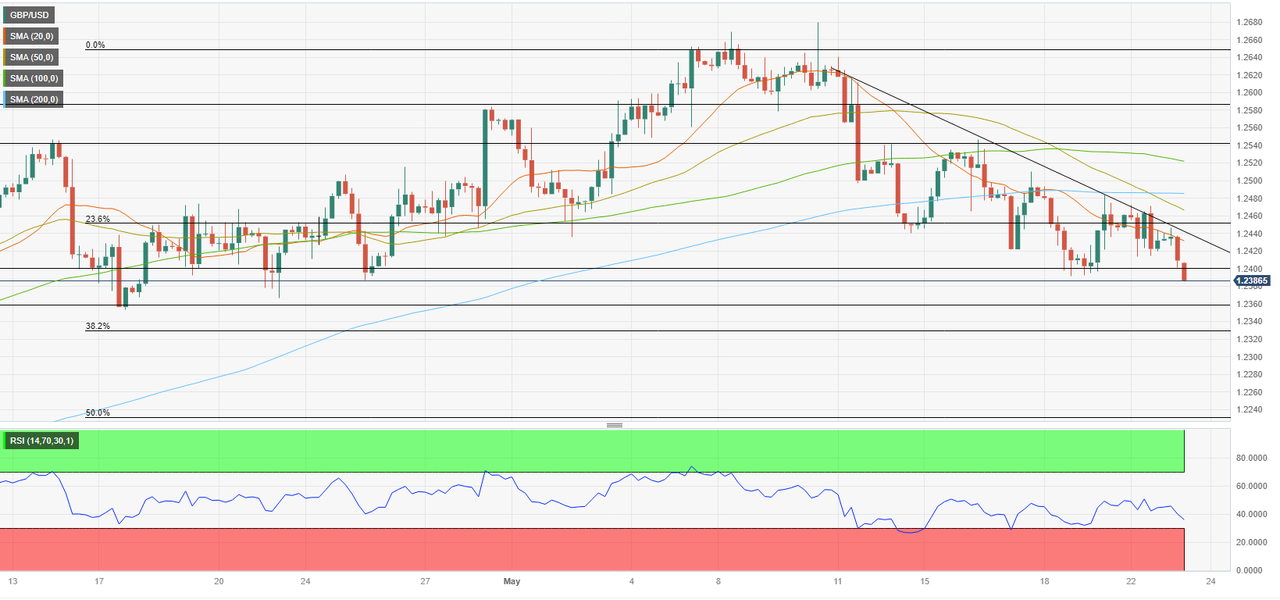
GBP/USD continues to trade below the descending trend line and the Relative Strength Index (RSI) indicator on the four-hour chart stays below 50, highlighting the lack of buyer interest.

On the downside, 1.2400 (static level, psychological level) aligns as initial support. With a four-hour close below that level, sellers could take action and drag GBP/USD lower toward 1.2360 (static level) and 1.2330 (Fibonacci 38.2% retracement of the latest uptrend).

If GBP/USD manages to stabilize above 1.2400, it is likely to face stiff resistance in the 1.2450/60 area (descending trend line, Fibonacci 23.6% retracement). Once the pair flips that area into support, buyers could show interest and open the door for an extended rebound toward 1.24

GBP/USD has lost its traction in the early European morning on Tuesday and touched its lowest level in a month slightly below 1.2400. The pair’s near-term technical outlook suggests that sellers retain control. Bank of England (BoE) Governor Andrew Bailey will testify on monetary policy before the UK Treasury Select Committee and investors will continue to pay close attention to risk sentiment.

Following Monday’s face-to-face meeting, US President Joe Biden and House Speaker Kevin McCarthy failed to reach a deal to lift the government’s $31.4 trillion debt limit, causing markets to remain cautious. Early Tuesday, US stock index futures trade mixed and a negative shift in market mood in the second half of the day could allow the US Dollar (USD) to preserve its strength.

While speaking at the post-policy meeting press conference, BoE Governor Bailey said that they had good reasons to expect inflation to fall sharply over the coming months, beginning in April. In a speech to the British Chambers of Commerce last week, Bailey noted that there were signs that the UK labour market was loosening a little.

In case Bailey sticks to an optimistic tone regarding the inflation outlook, Pound Sterling is likely to have a difficult time finding demand.

In the meantime, the data from the UK showed that the S&P Global/CIPS Composite PMI declined to 53.9 in early May from 54.9 in April. This reading fell short of the market expectation of 54.6 and showed a loss of momentum in the private sector’s business activity growth.

EUR/USD on Cusp of Major Breakdown as US Dollar Embarks on Strong Recovery

EUR/USD on Cusp of Major Breakdown as US Dollar Embarks on Strong Recovery

The U.S. dollar has recently embarked on a strong recovery, driven by rising U.S. Treasury yields thanks to the exceptionalism of the U.S. economy. U.S. business activity and the labor market have held up remarkably well over the past few months despite numerous headwinds, including the banking sector turmoil that erupted in March.

Economic resilience has led some Fed officials (Bullard, for example) to take a more hawkish stance, leading them to support additional tightening and higher-for-longer rates. Against this backdrop, yields have rebounded significantly, with the 2-year note rising from a low of 3.65% this month to 4.4% at one point on Tuesday morning, a significant move in a short period of time by bond market standards.

The resurgent U.S. dollar has hurt most developed-market currencies, such as the euro and the yen. For instance, EUR/USD has fallen nearly 3% from its May peak, although some idiosyncratic factors have also contributed to the common currency’s underperformance, such as the slump in manufacturing activity in Germany.

Related Reading: Nasdaq 100 Entrenched in Indisputable Uptrend but Poor Market Breadth Is Ominous

Looking ahead, there is reason to believe that the U.S. dollar could retain the upper hand for a little bit longer. One potential bullish catalyst is the U.S. debt ceiling impasse. Volatility could increase dramatically in the coming days if Congress fails to reach an agreement to lift the country’s borrowing capacity soon, boosting safe-haven demand.

While lawmakers are likely to reach a deal at some point, that may not happen until the eleventh hour, when markets have already begun to convulse. History suggests that only panic tends to unite political parties in Washington. As the market becomes more nervous about a possible US default, EUR/USD could extend its slide near term.of clients are net long.

Change in Longs Shorts OI
Daily 10% -9% 1%
Weekly 7% -9% 0%
What does it mean for price action?
Get My Guide

EUR/USD TECHNICAL ANALYSIS

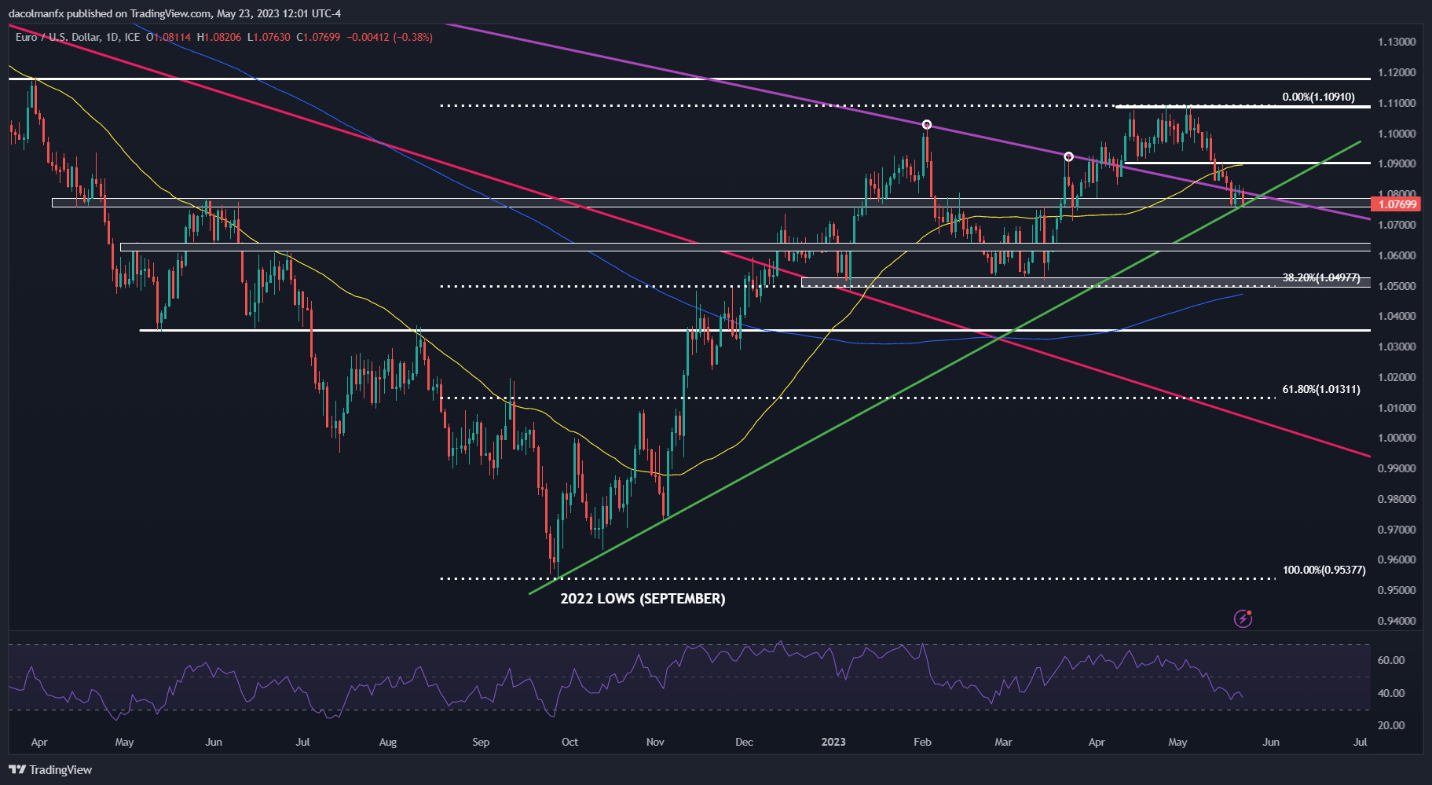
After the recent pullback, EUR/USD is testing trendline support near 1.0775/1.0770, that last line of defense against a deeper retrenchment. If bulls fail to protect this floor and prices slide beneath it, selling pressure could accelerate, setting the stage for a move toward 1.0625.

On the flip side, if the pair manages to establish a base around current levels and reverses higher in the direction of the broader trend, initial resistance appears at the psychological 1.0900 mark, a tad above the 50-day simple moving average. On further strength, the focus shifts to the 2023 highs.

EUR/USD TECHNICAL CHART

A screenshot of a computer screen  Description automatically generated with low confidence


Japanese Yen Setups: USD/JPY Muted After Breakout, AUD/JPY Forges Double Top

Japanese Yen Setups: USD/JPY Muted After Breakout, AUD/JPY Forges Double Top

USD/JPY TECHNICAL ANALYSIS

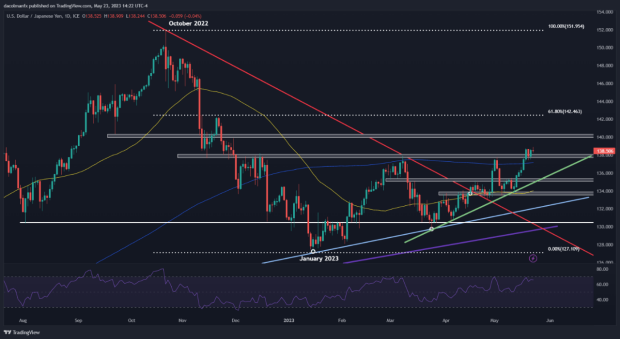
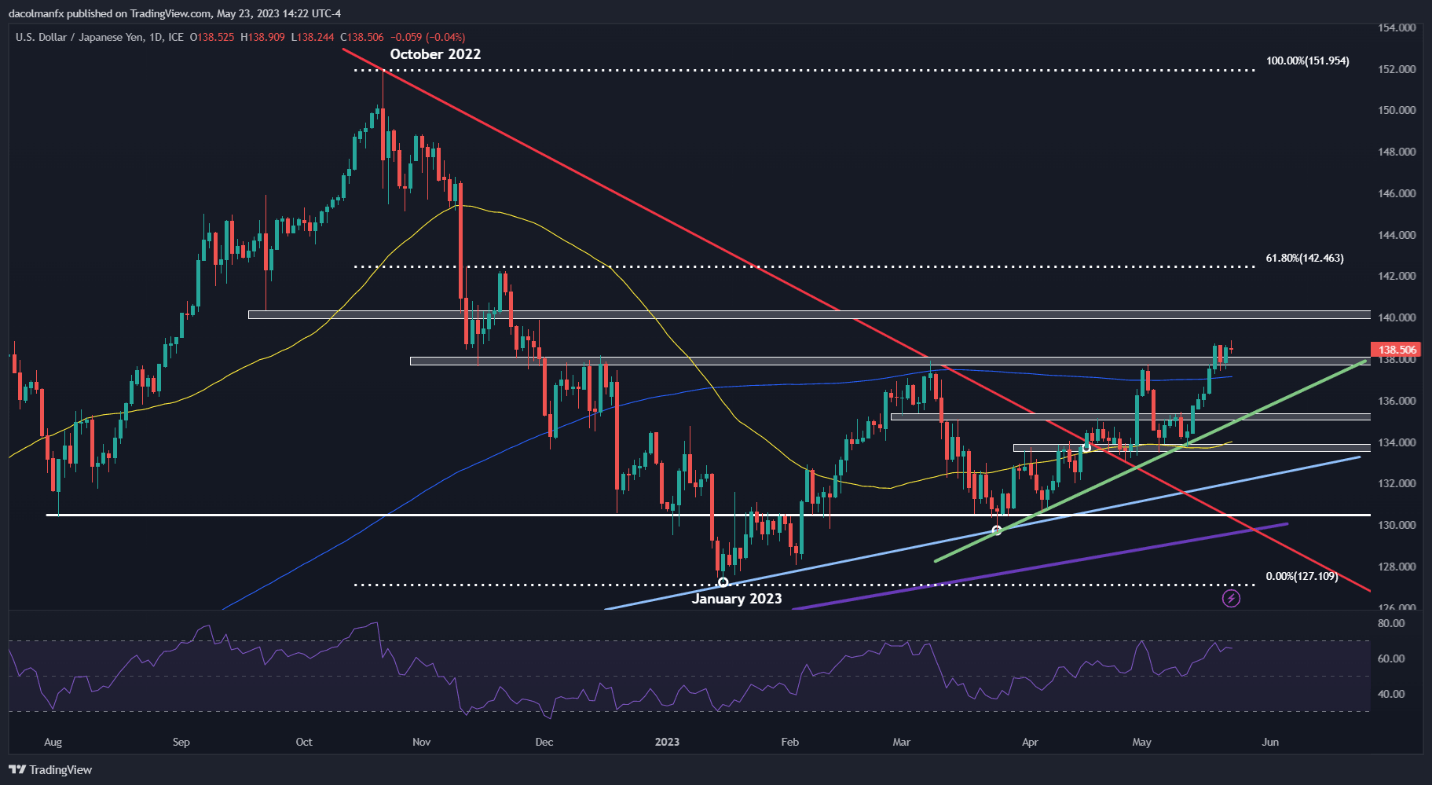
USD/JPY (US dollar – Japanese Yen) was cautious on Tuesday, moving between small gains and losses around the 138.50 level and showing signs of losing momentum following its stunning run over the past few weeks. For context, the pair has staged a solid rally since the beginning of the month, rising more than 3.4% after bouncing off its 50-day simple moving average – an important area of demand.

While USD/JPY’s technical outlook remains constructive, the pair may be in a consolidation phase for a few days, establishing a base around the 138.00 handle prior to the next leg higher. If this scenario plays out, prices may resume their ascent and challenge the psychological 140.00 level before the end of May. On further strength, the focus turns to 142.45, the 61.8% Fib retracement of the 2022/2023 slump.

Conversely, if the bears take advantage of market exhaustion and trigger a reversal, traders should watch support at 138.00, keeping in mind that a move below it could lead to a retest of the 200-day simple moving average. Sellers may struggle to breach this technical floor, but a breakdown could open the door for a pullback toward a short-term rising trendline at 135.00.

USD/JPY TECHNICAL CHART

A picture containing screenshot, diagram, line, plot  Description automatically generated 

AUD/JPY TECHNICAL ANALYSIS

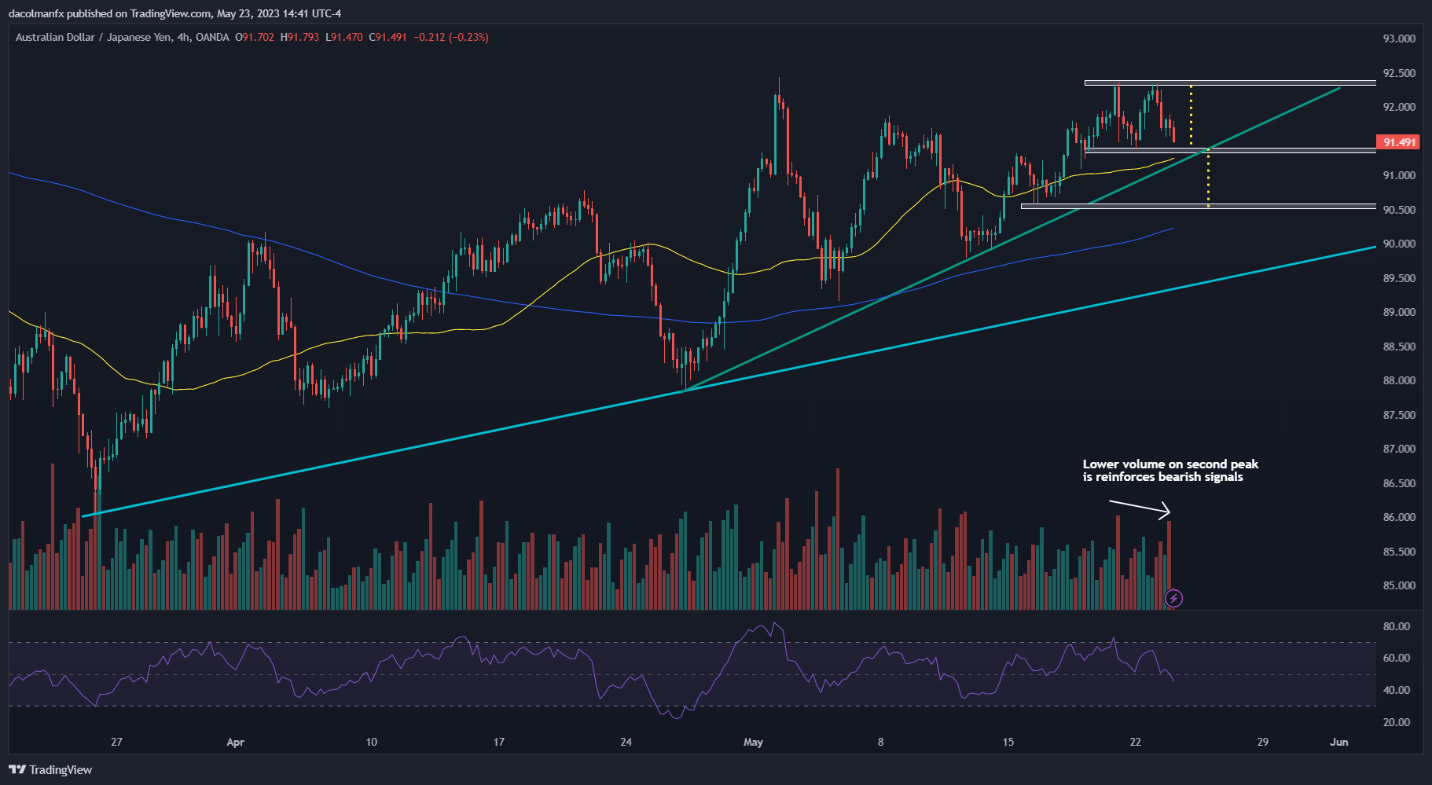
AUD/JPY (Australian dollar – Japanese yen) has been in a strong uptrend since late March, establishing higher highs and higher lows progressively, a clear indication that the bulls have been in control of the market for some time. Despite positive price action, buyers may have a reason to worry as the pair has been carving out a double top in recent weeks after failing to push above 92.35.

A double top is a reversal pattern that often develops in the context of an extended upward move, composed of two similar peaks separated by a depression. This bearish setup is confirmed once the price completes its “M” resembling shape and breaks below the technical support created by the formation’s intermediate through – the neckline.

In the case of AUD/JPY, the neckline sits at 91.40. If this floor caves in, a steep sell-off could follow in short order. The potential size of the downward retracement can be quantified by projecting vertically the height of the double top from the break point. This indicates the possibility of a decline towards 90.55 in the near term.

AUD/JPY TECHNICAL CHART

A screenshot of a computer screen  Description automatically generated with low confidence

Gold and Silver Price Outlook: XAU/USD, XAG/USD May Fall as Retail Crowd Goes Long

Gold and Silver Price Outlook: XAU/USD, XAG/USD May Fall as Retail Crowd Goes Long

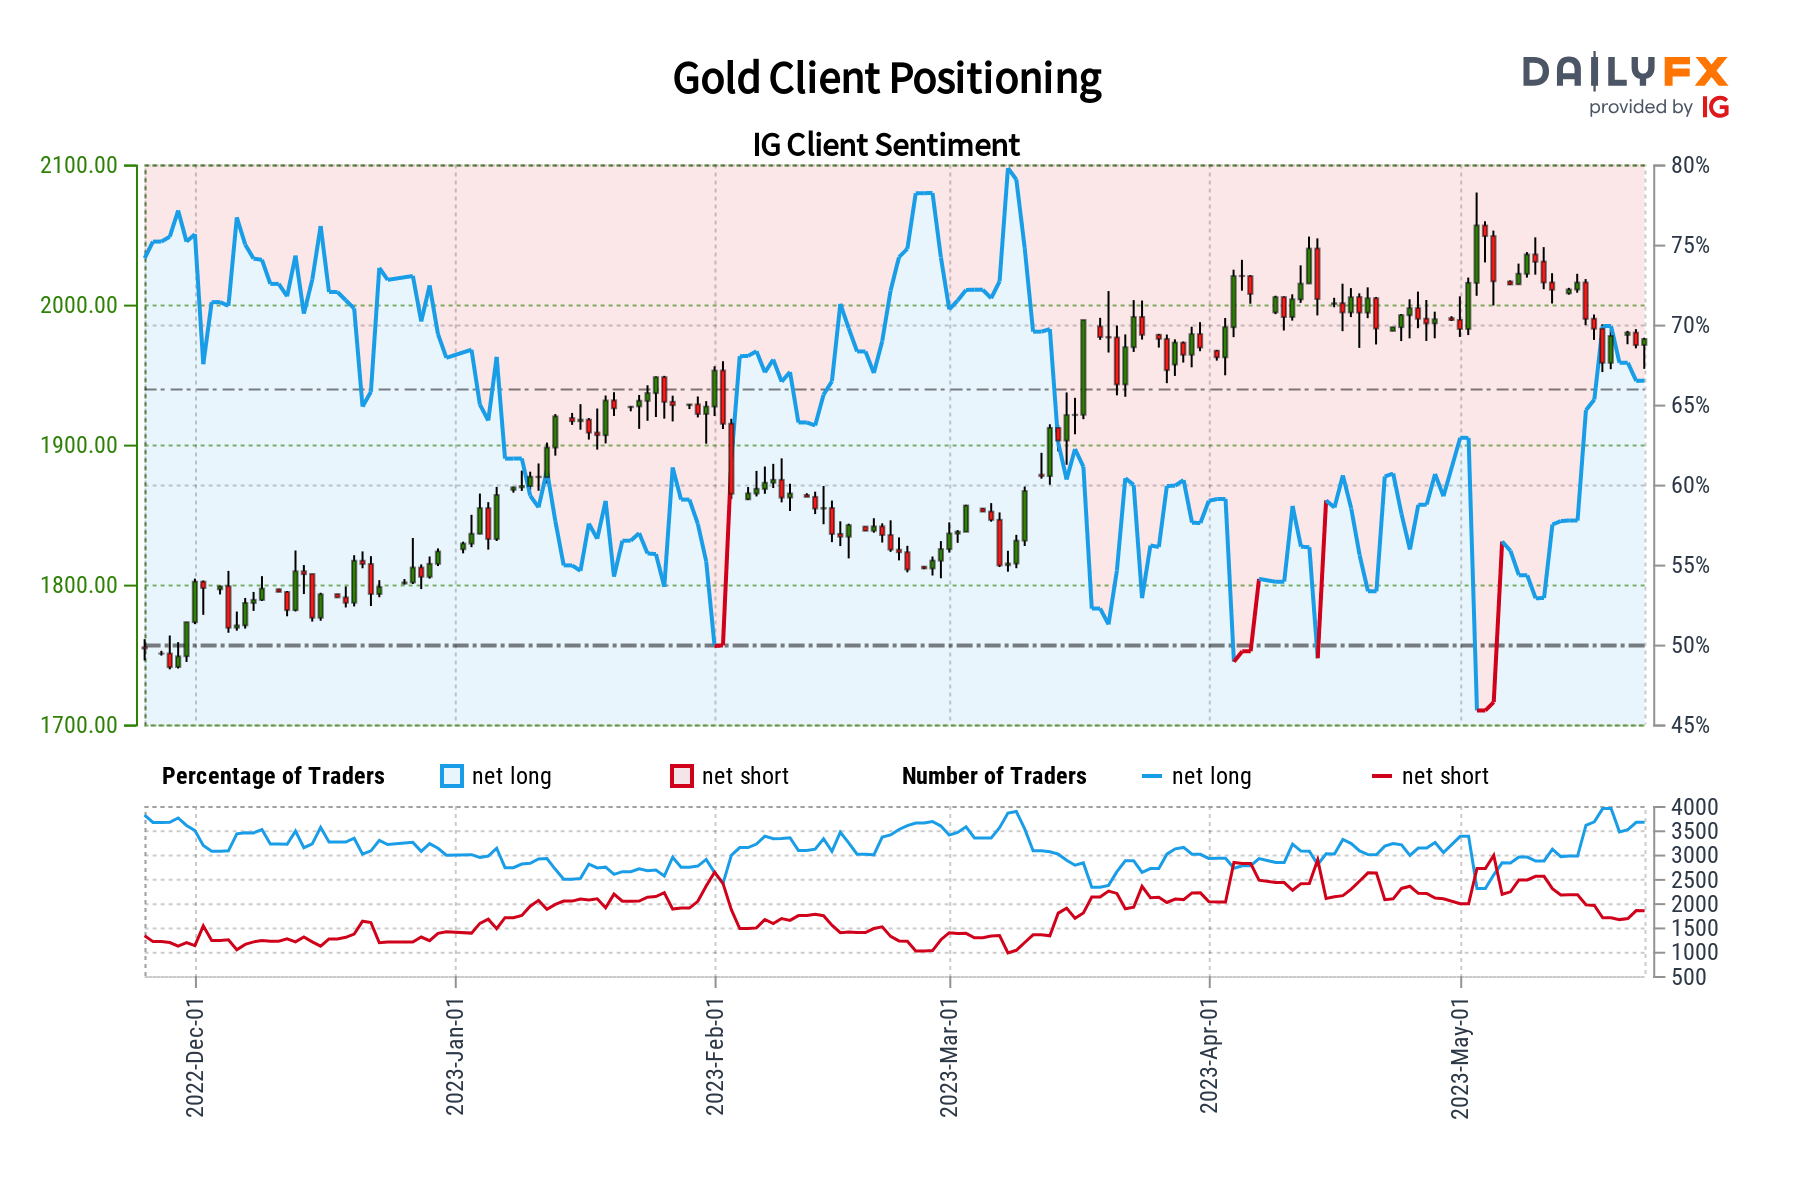
Gold and silver prices continued aiming lower in recent days, accelerating a decline since finding a top in late April. By looking at IG Client Sentiment (IGCS), we can see how retail traders have been evolving their exposure in these precious metals. IGCS tends to function as a contrarian indicator, especially in trending markets. With that in mind, could further pain be in store for XAU/USD and XAG/USD?

Gold Sentiment Outlook – Bearish

The IGCS gauge shows that about 66% of retail traders are net-long gold. Since most of them are biased higher, this hints that prices may continue falling. This is as upside exposure increased by 1.79% and 12.32% compared to yesterday and last week, respectively. With that in mind, the combination of current sentiment and recent changes offers a stronger bearish contrarian trading bias.

Gold Sentiment Outlook - Bearish

XAU/USD Daily Chart

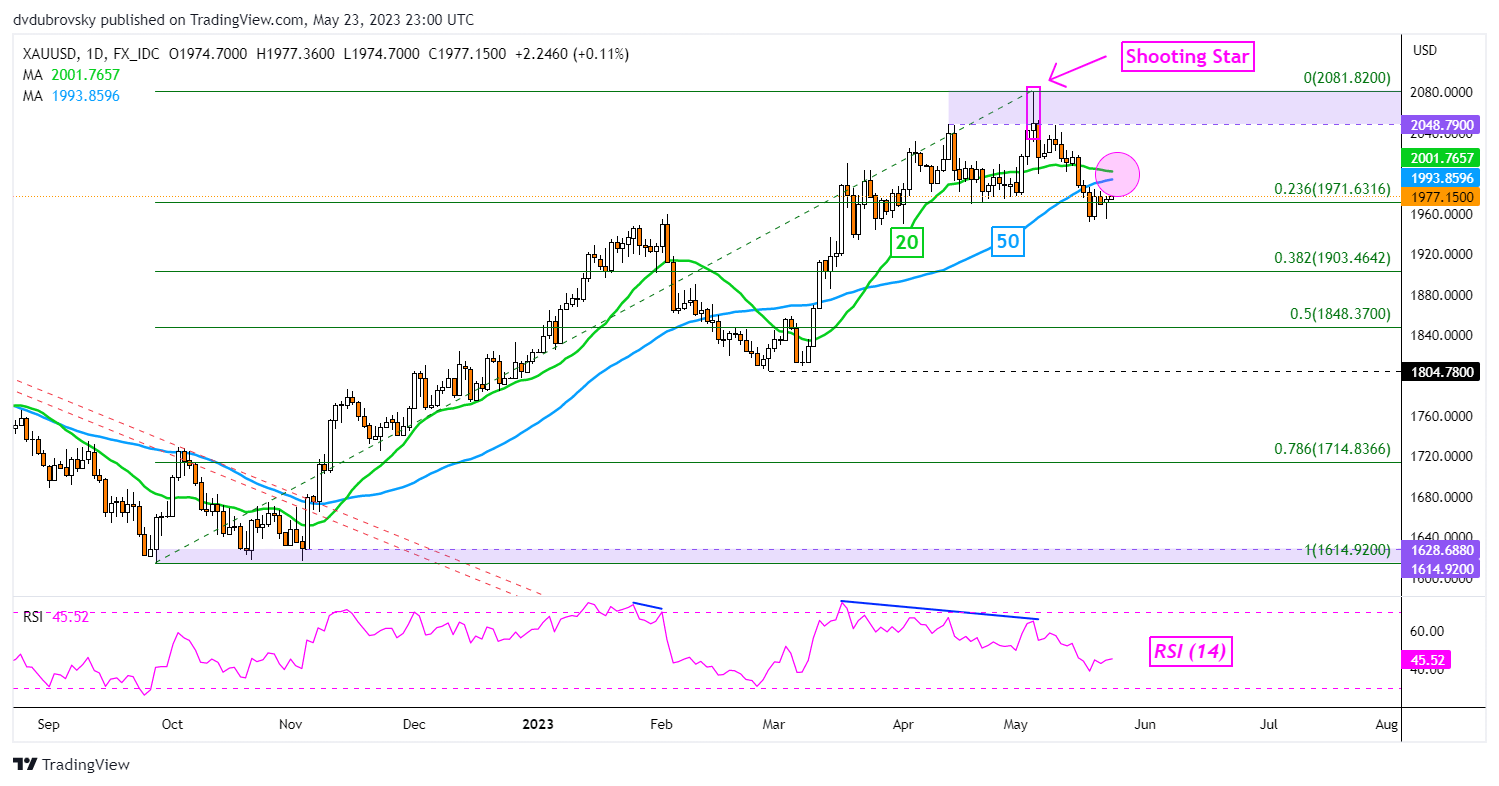
On the daily chart, a bearish Death Cross between the 20- and 50-day moving averages could be in store for gold. This is as prices are testing the 23.6% Fibonacci retracement level at 1971. Confirming a downside breakout exposes the 38.2% level at 1903. Otherwise, a turn higher places the focus on current 2023 highs, making for a wide range of resistance between 2048 – 2081.

XAU/USD Daily Chart

Silver Sentiment Outlook – Bearish

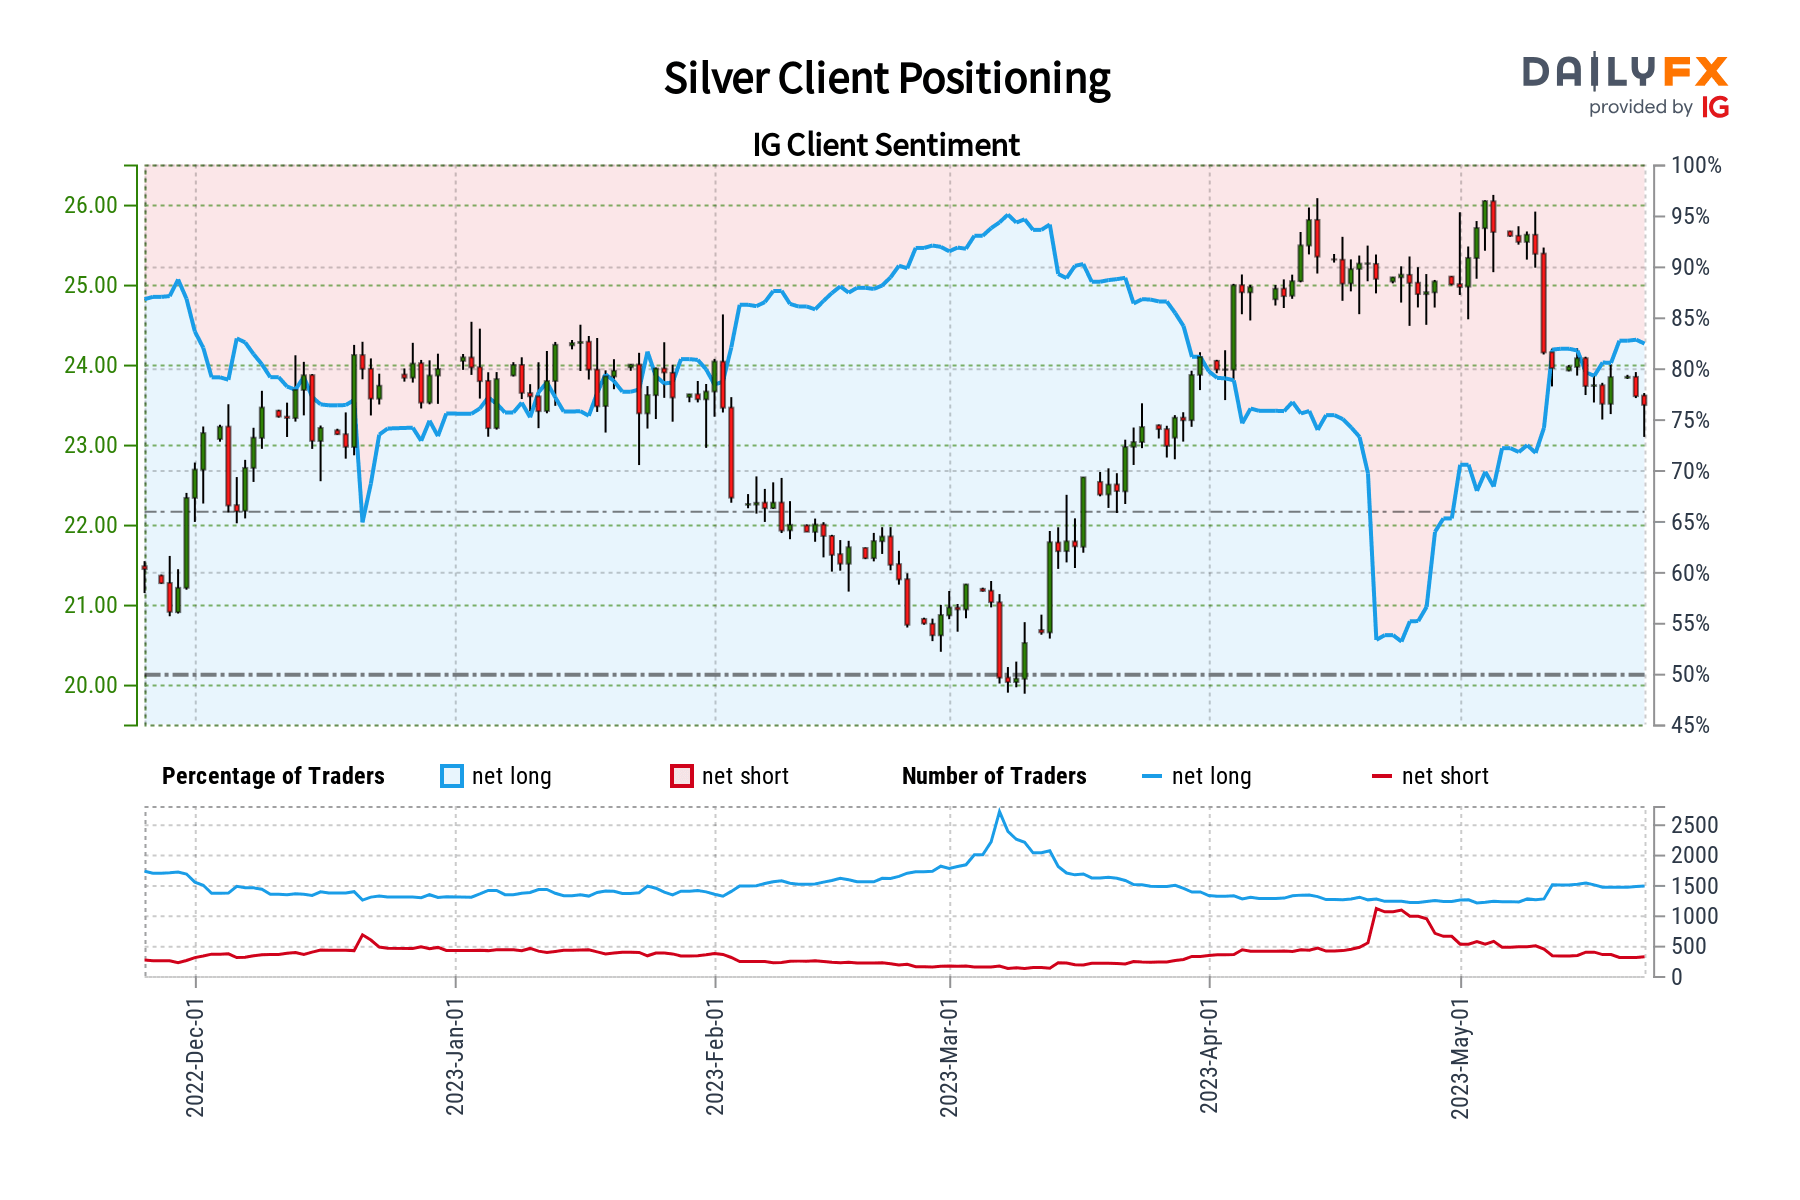
The IGCS gauge reveals that roughly 83% of retail traders are net-long silver. Since most of them are net-long, this hints that prices may continue falling. This is as downside exposure decreased by 2.6% and 24.81% compared to yesterday and last week, respectively. With that in mind, this is producing a stronger bearish contrarian trading bias.

Silver Sentiment Outlook - Bearish

XAG/USD Daily Chart

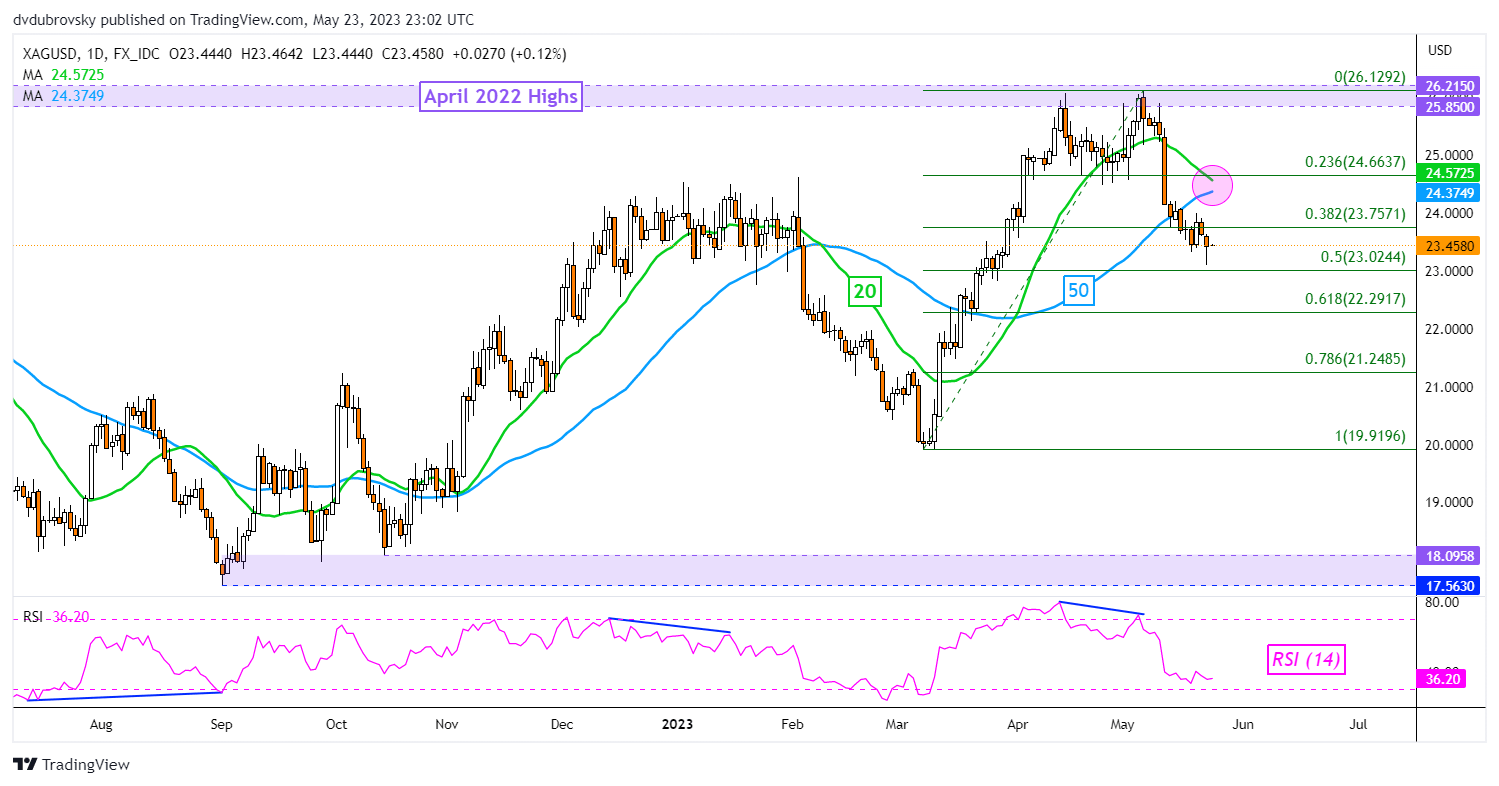
A bearish Death Cross between the same moving averages may also be in store for silver soon. That would open the door to an increasingly downside technical bias. Immediate support is the midpoint of the Fibonacci retracement at 23.02. Extending lower exposes the 61.8% point at 22.2917. Otherwise, a turn higher places the focus on the 38.2% level at 23.757.

XAG/USD Daily Chart