Nvidia Earnings Blowout Ripples into the Nasdaq 100, US AAA Rating Cut Risk Brews

Nvidia Earnings Blowout Ripples into the Nasdaq 100, US AAA Rating Cut Risk Brews

Nvidia Earnings Smashed Expectations, Driving Nasdaq 100 Higher Afterhours

Thursday’s Asia-Pacific trading session could be looking at a rosy start after Nvidia Corp. single-handedly buoyed stock market sentiment after releasing its first-quarter earnings report. The now world’s most valuable chipmaker crushed expectations, clocking in a revenue estimate of about USD 11 billion, far above the 7.18b analyst estimate, driven by AI-fueled demand.

During after-hours trade, Nvidia’s stock soared over 25 percent, producing a rippling effect for the tech-heavy Nasdaq 100 (futures) and to a certain extent, the S&P 500 too – see chart below. As a result, Wall Street reversed a good chunk of losses seen during Wednesday’s trading session, which saw the Nasdaq Composite drop 0.61%.

Initial losses on Wall Street were driven by pessimism regarding ongoing debt ceiling negotiations and monetary policy woes. This fueled concerns regarding how a default could increase the risk of a recession. Speaking of which, Fitch Ratings announced that the US AAA rating could be cut, citing the nation’s governance as a weakness relative to its ‘AAA’ peers.

Meanwhile, FOMC meeting minutes showed that policymakers stressed that cuts are “unlikely”, pouring cold water in rising expectations of near-term easing.

Looking ahead, Thursday’s Asia-Pacific trading session is lacking notable economic event risk. That is going to leave sentiment as the key driver for financial markets. As such, the boost to equities from Nvidia’s report could drive optimism in regional indices, such as the Hang Seng Index, ASX 200 and Nikkei 225.

Nasdaq 100 15-Minute Chart

Nasdaq 100 15-Minute Chart

Nasdaq Technical Analysis

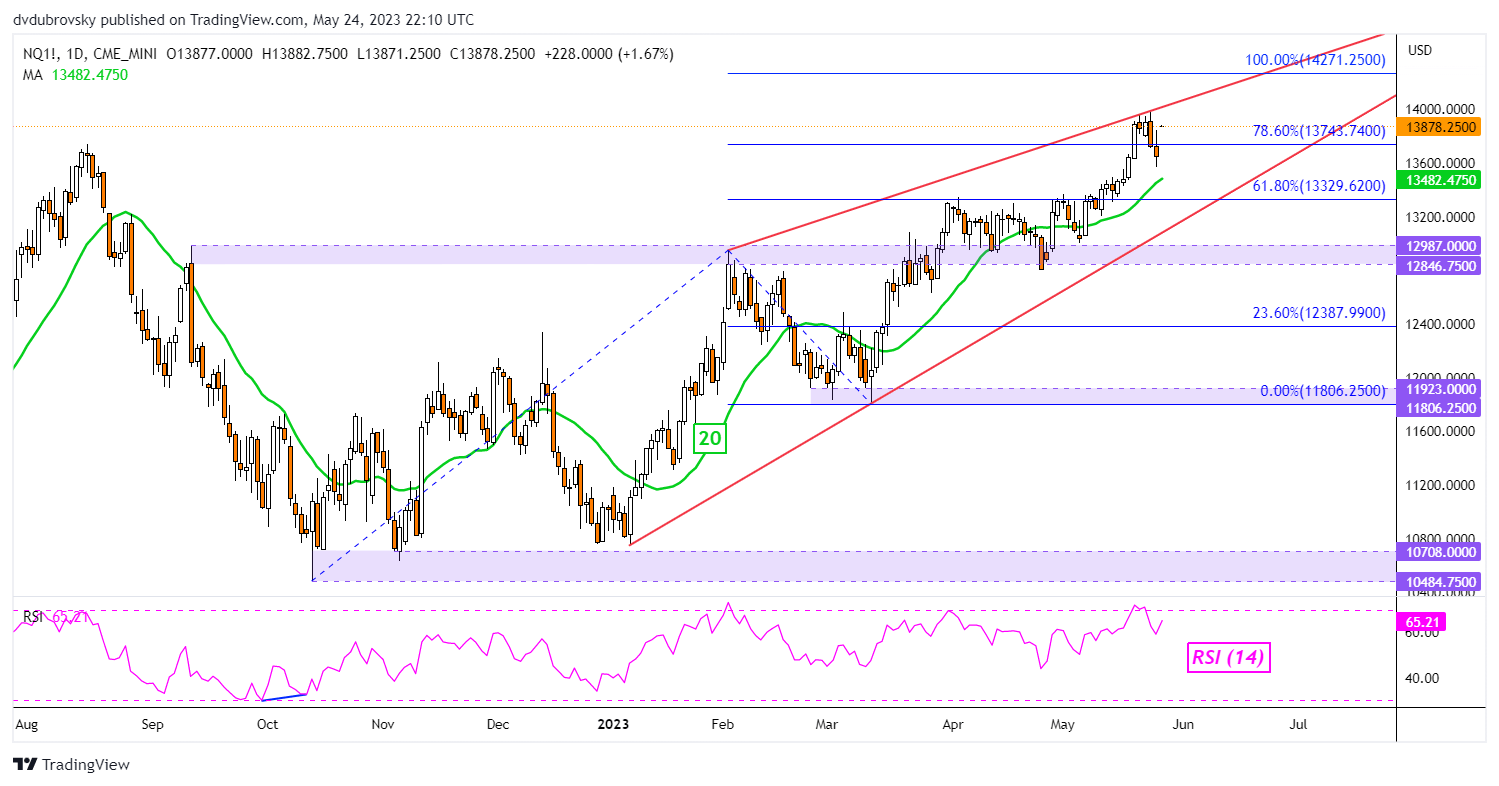
On the daily chart, the Nasdaq 100 appears to be trading within the boundaries of a Rising Wedge chart formation. So long as the index continues to trade within the pattern’s formation, the immediate technical bias could be bullish. On the other hand, a breakout lower could open the door to reversing gains that have been accumulating since the beginning of this year.

Nasdaq 100 Daily Chart
Nasdaq 100 Daily Chart

British Pound Shrugs Off Blistering CPI: What’s Next for GBP/USD, EUR/GBP, GBP/JPY?

British Pound Shrugs Off Blistering CPI: What’s Next for GBP/USD, EUR/GBP, GBP/JPY?

The British pound’s rally against some of its peers has stalled recently, and chances are that the consolidation could extend a bit further in the short term.

UK macro momentum has been solid as reflected in the two-year high readings of the UK Economic Surprise Index. Data released on Wednesday showed inflation moderated by much less than expected in April, leaving the door open for another BOE rate hike next month. However, the subdued reaction in GBP to the recent upbeat data suggests much of the optimism could well be baked in the price.

Moreover, the deadlock in Washington over raising the debt limit and the scaling back in expectations of a Fed rate cut this year after hawkish remarks from several Fed officials have provided an excuse to unwind some GBP longs given the extent and the pace of the rise since late 2022.

GBP/USD Daily Chart

image1.png

On technical charts, GBP/USD’s trend has moved to a bearish phase in the short term, as the colour-coded 240-minute candlestick charts based on trending / momentum indicators show. Any break below the immediate cushion at the mid-April low of 1.2350 could open the downside toward 1.2200.

GBP/USD 240-minute Chart

image2.png

In the past couple of weeks, there have been signs of loss of steam in GBP/USD’s rally (see “A Reversal or a Dead-Cat Bounce in US Dollar? EUR/USD, GBP/USD, USD/JPY”, published May 17. This follows a retreat earlier this month from a slightly upward sloping trendline from 2022 (see the weekly chart).

GBP/USD Weekly Chart

image3.png

From a medium-term perspective, the rise this month to a one-year high earlier this month confirmed the higher-tops-higher-bottom sequence since late 2022, leaving open the door for some medium-term gains. (see “British Pound Buoyant Ahead of BOE: How Much More Upside?”, published May 8). However, recent signals on charts suggest GBP may need to consolidate / retreat a bit before the next leg higher.

GBP/JPY Daily Chart

image4.png

GBP/JPY: Rally could pause

GBP/JPY’s rally appears to be running out of steam in the very near term as it tests a key ceiling around the October high of 172.10. No threat to the five-month-long uptrend, but the evolving price action on the daily and weekly charts suggests the cross may need to consolidate/retreat a bit before it embarks on the next leg higher. However, the mid-May low of 167.85 could provide a solid floor.

EUR/GBP Weekly Chart

image5.png

Chart Created Using TradingView

EUR/GBP: Downtrend fatigue?

EUR/GBP’s losses have stalled following the break below key horizontal trendline support at about 0.8725, raising the prospect of a minor bounce. However, the broader bias remains down, potentially toward the December low of 0.8545.

Note: In the above colour-coded chart, Blue candles represent a Bullish phase. Red candles represent a Bearish phase. Grey candles serve as Consolidation phases (within a Bullish or a Bearish phase), but sometimes they tend to form at the end of a trend. Note: Candle colors are not predictive – they merely state what the current trend is. Indeed, the candle color can change in the next bar. False patterns can occur around the 200-period moving average, or around a support/resistance and/or in sideways/choppy market. The author does not guarantee the accuracy of the information. Past performance is not indicative of future performance. Users of the information do so at their own risk.

Crude Oil Pings Higher as Specs Told to ‘Watch Out’ by OPEC+. Higher WTI?

Crude Oil Pings Higher as Specs Told to ‘Watch Out’ by OPEC+. Higher WTI?

Crude oil staged a rally going into Thursday despite the US Dollar roaring higher alongside Treasury yields.

Comments from Saudi Arabia Minister of Energy Abdulaziz bin Salman, assisted the bounce when he rattled the sabre, saying, “speculators, like in any market, they are there to stay. I keep advising that they will be ouching. They did ouch in April. I don’t have to show my card, I’m not [a] poker player… but I would just tell them, watch out.”

In early April, OPEC+ announced that they would cut production by 1.1 million barrels per day. This news saw crude gap higher to levels not seen since November 2022.

The reality is that OPEC+ is notorious for not being able to meet their production target and regularly overshoot. For a further deep dive into the OPEC+ cartel and its intentions, check out our colleague Ilya Spivak at tastylive on his MacroMoney show here.

Source; Bloomberg. Created by Ilya Spivak at Macro money

The weekly US Energy Information Agency (EIA) data released overnight saw stockpiles drop dramatically, overcompensating for last week’s run-up in inventory.

12.456 million fewer barrels were stored in the week ending May 19th. The week prior saw 5.04 million barrels added.

Elsewhere, the Canadian wildfires appear to have been contained to a certain extent for now and it’s being reported that production and supply are back to normal levels.

For now, it appears that the shorts have been squeezed but it seems there is a lack of follow-through at this point.

WTI CRUDE OIL TECHNICAL ANALYSIS

WTI overcome resistance making a high of 74.73 overnight. The 34- and 100-day Simple Moving Averages (SMA) are just above the market and may lend resistance near 75.15 and 76.92 respectively.

On the downside, support might be at previous resistance levels down toward 73.60. Further down, support may lie at the breakpoints and prior lows of 69.41, 66.82, 66.12, 64.36, 63.64 and 62.43.


US Dollar Rides High as Debt Debate Continues Amid Fitch Re-Rating. Higher DXY?

US Dollar Rides High as Debt Debate Continues Amid Fitch Re-Rating. Higher DXY?

The US Dollar regained the ascendency overnight with Treasury yields racing north and stocks taking a tumble as the US debt ceiling debate fumbles forward toward June 1st. That is the date that Treasury Secretary Janet Yellen has identified as the day that Treasury may run out of cash.

Demand for the ‘big dollar’ soared with high beta currencies such as the Aussie and Kiwi Dollars’ hit the hardest, but the rally has been broad-based across currency markets.

The South Pacific currencies snapped to 6-month lows with the growth-linked Dollars susceptible to sways in global risk sentiment, which is being eroded by the uncertainty of the US debt ceiling debacle.

Fitch, the credit rating agency, put the US on negative watch late Wednesday as the debt ceiling deadline approaches.

While many pundits believe a resolution will be found before a default occurs, the prospect of it unfolding is providing conjecture for many scenarios. Should it happen, uncertainty appears to be the only certainty.

It should be noted that House Speaker Kevin McCarthy said ‘we’re not going to default’ late Wednesday.

Treasury yields have lifted across the curve with the 1-year note only a handful of basis points away from a 23-year high.

Federal Reserve meeting minutes released yesterday revealed that while there was no consensus for further rate hikes, the notes pointed toward a pause for some time rather than the prospect of a cut.

Interest rate markets are pencilling in a cut for the December Federal Open Market Committee (FOMC) meeting.

Wall Street finished the cash session lower, but Nasdaq futures have rallied through the Asian session after Nvidia, the chip maker, reported much better than anticipated results. They believe that 2Q revenue will be around USD 11 billion, beating estimates of USD 7.2 billion.

APAC equities are mostly in the red with the exception of Japan, with the Nikkei 225 posting solid gains. Data From Japan’s Ministry of Finance showed foreign buying of Japanese stocks nudged higher again for the week ended May 19th to ¥ 867.5 billion.

Crude oil defied the US Dollar advances, posting a 3-week overnight and it has been steady so far in Asian trade. The WTI futures contract is over US$ 74 bbl while the Brent contract is above US$ 78 bbl.

Spot gold is languishing near US$ 1,960 an ounce while silver dipped below US$ 23 an ounce today.

DXY TECHNICAL ANALYSIS

The DXY index has continued to rally after breaking above a descending trend line 2-weeks ago.

The surge went on to break above resistance near 102 and that area might provide support on a pullback.

On the topside, resistance could be at the 76.4% Fibonacci Retracement level of at the prior peak of 105.10.

image1.png


Australian Dollar Looking Vulnerable: AUD/USD, AUD/JPY, AUD/CAD Price Action

Australian Dollar Looking Vulnerable: AUD/USD, AUD/JPY, AUD/CAD Price Action

The Australian dollar is looking vulnerable as it tests key support against the US dollar, a break below which could lead to further losses in the near term.

AUD has been hurt by a mix of factors recently: a setback in risk sentiment amid the lack of meaningful progress in Washington over raising the debt limit, a trimming back of rate cut expectations after hawkish speak from US Federal Reserve officials, and underwhelming Australia data (jobs data being the most recent).

This puts increased focus on Australia retail sales data for April due Friday – forecast to have slowed to 0.1% on-month from 0.4% previously.A below-expected print could precipitate a decline in AUD. Also, a higher-than-expected US core PCE price index print (expected to remain flat at 4.6% on-year) could boost USD.

AUD/USD Daily Chart

image1.png

Chart Created by Manish Jaradi Using TradingView

AUD/USD: Threatens to break lower

AUD/USD is attempting to break under crucial support on a horizontal trendline from November at about 0.6585. Such a break could open the way initially toward 0.6350, based on the width of the sideway channel. Importantly, such a move would negate the bullish prospects highlighted in “Australian Dollar Ahead of Budget: AUD/USD, AUD/JPY, EUR/AUD Price Setups”, published May 9. On the upside, AUD/USD would need to clear the hurdle at 0.6805 for the downward pressure to fade.

AUD/CAD Daily Chart

image2.png

Chart Created by Manish Jaradi Using TradingView

AUD/CAD: Cracks below support

AUD/CAD’s fall below a horizontal trendline from April at about 0.8950 has triggered a minor double top (the April and the May highs), potentially exposing downside risks toward 0.8800. The bearish development follows a failure to cross above stiff resistance on the 89-day moving average (see the daily chart).

AUD/JPY Daily Chart

image3.png

Chart Created by Manish Jaradi Using TradingView

AUD/JPY: Upside capped

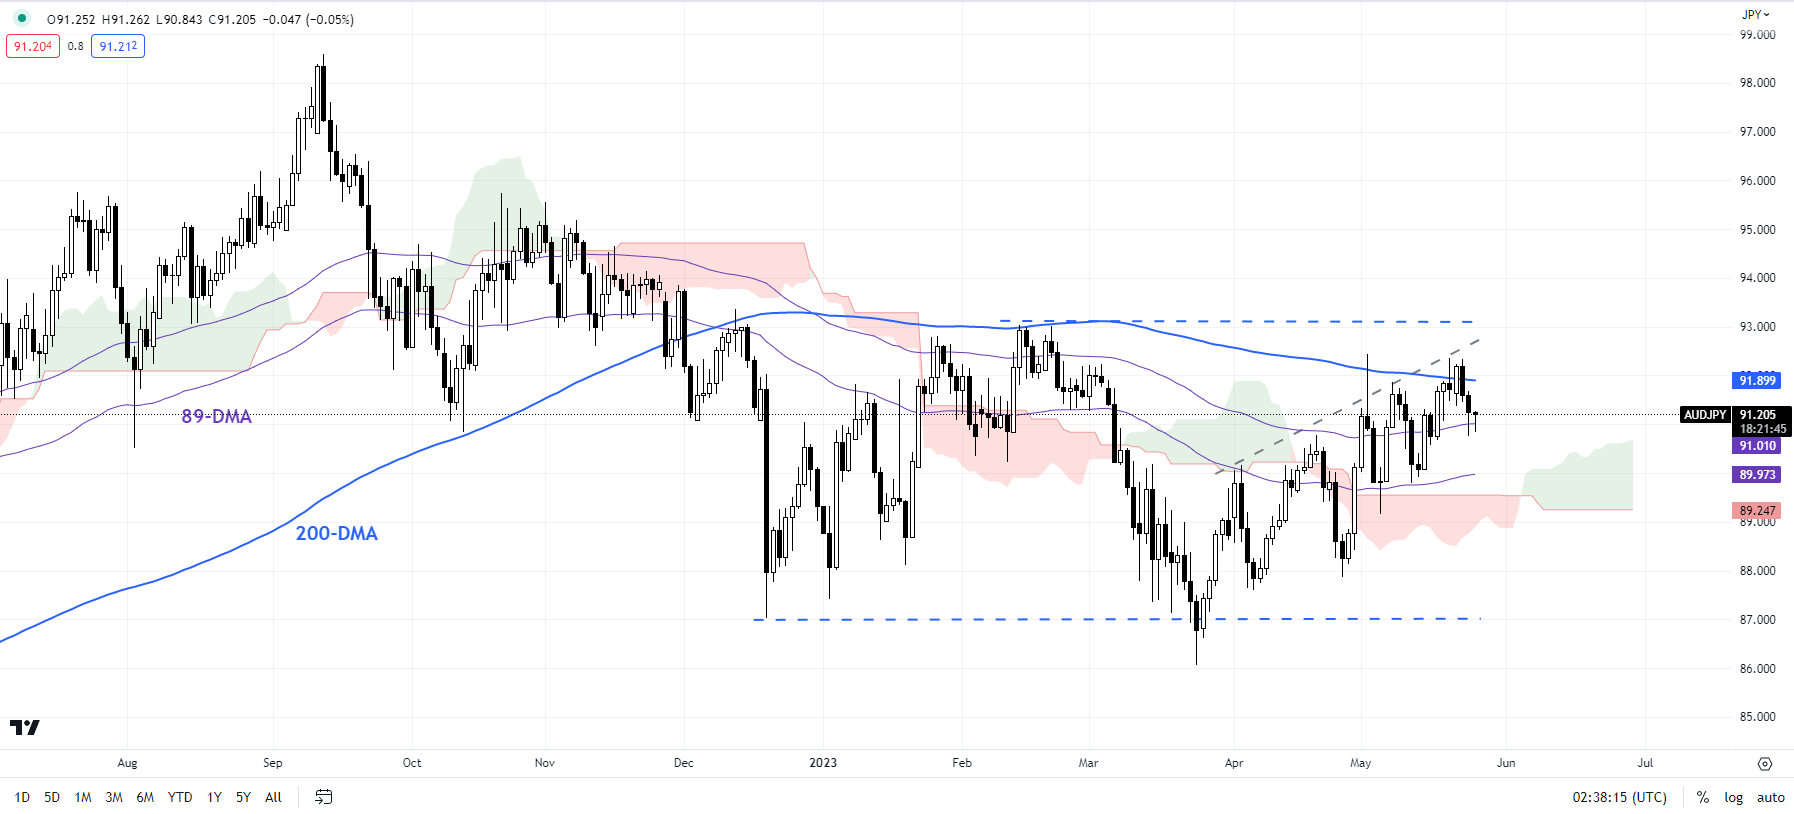
AUD/JPY risks a turn lower as it tests a strong converged barrier on the 200-day moving average, roughly coinciding with the February high of 93.00. Any break below 90.00-90.25 would raise the odds of a continuation of the well-established broad range of 86.00-93.00.

EUR/USD Outlook: Euro Tumbles as Germany Enters Recession

EUR/USD Outlook: Euro Tumbles as Germany Enters Recession

EURO FUNDAMENTAL BACKDROP

The euro continues to lose ground against the US dollar this morning after German GDP (see economic calendar below) surprised markets indicating Europe’s largest economy has entered into a technical winter recession. Two consecutive negative quarters is the official definition of a recession giving the euro bulls little optimism in a risk averse environment.

The US debt ceiling remains at the top of investors minds and with no deal on the table, markets are becoming increasingly more jittery – playing into the safe haven hands of the greenback. The Fitch ratings agency supplemented the already nervy market by placing the US on negative watch for a possible downgrade as a consequence of ongoing debt ceiling talks.

The day ahead features several European Central Bank (ECB) speakers and it will be interesting to see whether they cite the recent German GDP report in what has been an extremely hawkish narrative of recent.

From a US perspective, US GDP is the only high impact event to come alongside the Fed’s Collins. Yesterday’s FOMC minutes didn’t help the situation for the euro with many officials either looking at a pause or another hike in the June meeting. That being said, moving forward the door is open for additional rate hikes should the need arise. This gives more significance to key US economic data including today’s GDP and tomorrow’s core PCE price index, durable goods orders and Michigan consumer sentiment.

EUR/USD ECONOMIC CALENDAR (GMT +02:00)

image1.png

TECHNICAL ANALYSIS

EUR/USD DAILY CHART

image2.png

Chart prepared by Warren Venketas, IG

Daily EUR/USD price action has just breached below the 1.0736 key area of confluence looking to the 1.0700 psychological support handle – last seen in March 2023. There is still scope for further downside particularly if the current risk off sentiment continues. That being said, with so many moving variables to consider this week, the pair is very much at the mercy of external fundamental macro drivers.

EUR/USD could trade down to the 1.0700 area if the Fed fails to play down the risk of future rate hikes – ING

EUR/USD could trade down to the 1.0700 area if the Fed fails to play down the risk of future rate hikes – ING

We are seeing the Euro a little softer across the board this week. Economists at ING believe that the EUR/USD pair could test the 1.0700 level.

Dollar correction may have a little further to run

“Yesterday’s release saw May flash PMIs on the soft side, but inflation in the service sector did stay resilient – which will be troubling for the ECB.”

“We think this Dollar correction may have a little further to run and EUR/USD could trade down to the 1.0700 area if the Fed fails to play down the risk of future rate hikes.”


ifo Business Climate Index falls

ifo Business Climate Index falls

Sentiment in the German economy has suffered a setback. The ifo Business Climate Index fell to 91.7 points in May, after 93.4 points1 in April. This marks the first decline after six increases in a row. Driving this development are the significantly more pessimistic expectations. Managers are somewhat less satisfied with their current situation. German companies are skeptical about the upcoming summer. In manufacturing, the business climate was much worse, with expectations seeing a particularly steep decline. This was the largest decrease since March 2022 after the start of the war in Ukraine.

Russia, China set to ink bilateral pacts despite Western criticism

Russia, China set to ink bilateral pacts despite Western criticism

BEIJING — Russia and China are set to sign a set of bilateral agreements on Wednesday during the Russian prime minister’s trip to Beijing as the two giant neighbors pledge closer cooperation even as the West remains critical of their ties amid the war in Ukraine.

“As a result of the talks, a number of bilateral agreements is planned to be signed,” the Russian news agency Interfax reported, without elaborating.

The visit comes after Russia and China reacted furiously to the Group of Seven weekend’s declarations that singled them out on a range of issues, including Ukraine, nuclear arms and economic coercion.

Xi visited Russia in March and held talks with “dear friend” President Vladimir Putin, after committing to a “no limits” partnership just before the 2022 Russia attack on Ukraine, which Moscow calls a “special military operation.”

Beijing has rejected Western attempts to link its partnership with Moscow to Ukraine, insisting that their relationship does not violate international norms, China has the right to collaborate with who it chooses, and their cooperation is not targeted at any third countries.

As a show of support, the Chinese premier on Tuesday sent a congratulatory letter to the China-Russia business forum in Shanghai, attended by Mishustin and a large group of Russian tycoons, saying China is willing to expand bilateral economic and trade exchanges.

In April, China’s exports to Russia saw continued momentum, climbing 153.1% from a year earlier, after more than doubling in March, according to data from Chinese customs.

Russia’s energy shipments to China are projected to rise by 40% this year, and the two countries are discussing technological equipment supplies to Russia, Interfax news agency reported.

Deepening of ties with China is a strategic course for Moscow, said the secretary of Russia’s Security Council Nikolai Patrushev, who held talks on Monday with Chen Wenqing, member of the Chinese Communist Party’s Politburo who oversees police, legal affairs and intelligence.

Mishustin’s visit comes at a time when Ukraine is readying a counteroffensive in a bid to retake occupied territory by Russian forces.

Beijing has refrained from openly denouncing Russia’s invasion. But since February, Xi has promoted a 12-point peace plan, which has been met with skepticism from the West and cautiously welcomed by Kyiv.

Last week, China’s special representative for Eurasian affairs Li Hui visited Ukraine and met with President Volodymyr Zelenskiy, kicking off a European tour that Beijing billed as its effort to promote peace talks and a political settlement of the crisis.

Li Hui is scheduled to visit Russia on Friday, Russian news agency TASS reported. (Reporting by Ryan Woo; Additional reporting by Lidia Kelly and Ethan Wang; Editing by Michael Perry)

NZD/USD Price Analysis: Eyes fresh monthly low below 0.6220 confluence on less hawkish RBNZ’s Orr

NZD/USD Price Analysis: Eyes fresh monthly low below 0.6220 confluence on less hawkish RBNZ’s Orr

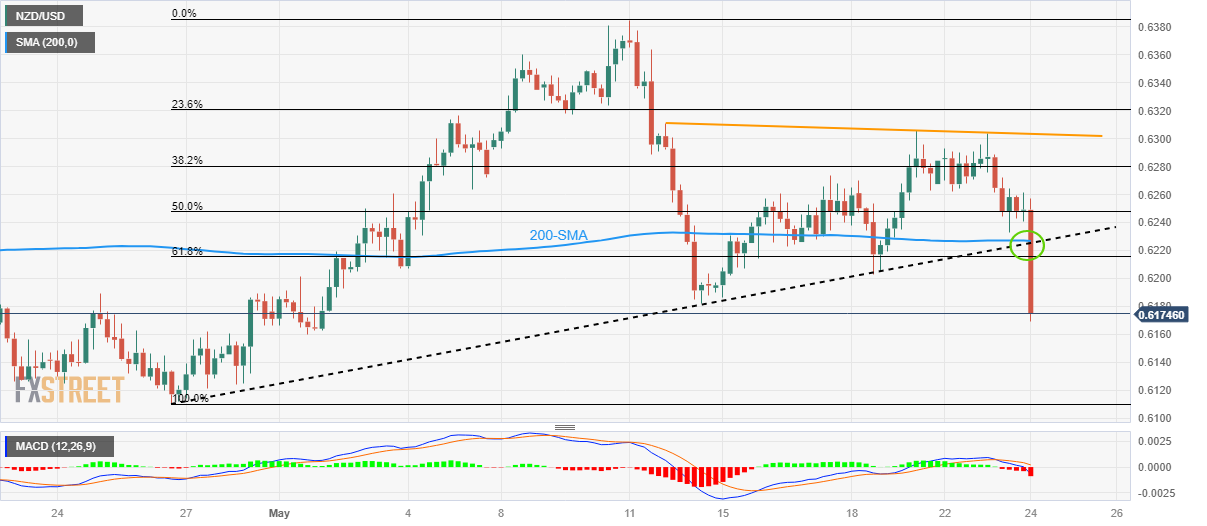
NZD/USD remains on the back foot around a three-week low under 0.6200, close to 0.6180 by the press time, even as Reserve Bank of New Zealand (RBNZ) Governor Adrian Orr tries to placate Kiwi bears early Wednesday.  That said, the quote dropped 150 pips after the RBNZ disappointed markets while keeping the peak rate unchanged, as well as matching the broad forecasts of increasing the Official Cash Rate (OCR) by 0.25%.

With the NZD/USD pair’s downside break of the 0.6220 key level on the dovish RBNZ bias, the sellers are likely to keep the reins amid bearish MACD signals. it’s worth noting that an upward-sloping trend line from late April joins 200-SMA to highlight 0.6220 as the key support-turned-resistance.

As a result, the Kiwi pair is well set for a fresh monthly low, currently around 0.6160. In doing so, the previous monthly bottom of around 0.6110 and the yearly trough near 0.6084 marked in March will be in the spotlight.

Alternatively, NZD/USD pair’s corrective bounce fails to push back the Kiwi buyers unless crossing the 0.6220 level.

Even so, a two-week-old descending resistance line, around 0.6305 by the press time, can challenge the NZD/USD bulls ahead of directing them to the monthly high of 0.6385.

NZD/USD: Four-hour chart