Gold Price Setup: Can Stretched Long Positioning in XAU/USD Trump Technicals?

Gold Price Setup: Can Stretched Long Positioning in XAU/USD Trump Technicals?

Gold is at a critical juncture – stretched retail traders’ long positioning poses downside risks to XAU/USD. However, if the past is any guide, the yellow metal may not be ripe for a bearish break just yet.

image1.png


The IG Client Sentiment (IGCS) shows 72% of retail traders are net-long with the ratio of long to short at 2.6 to 1. The number of traders net-long is 6.4% higher from last week. The IGCS data at times functions as a contrarian indicator – the fact traders are net-long suggests the next move in gold could be down.

XAU/USD Daily Chart
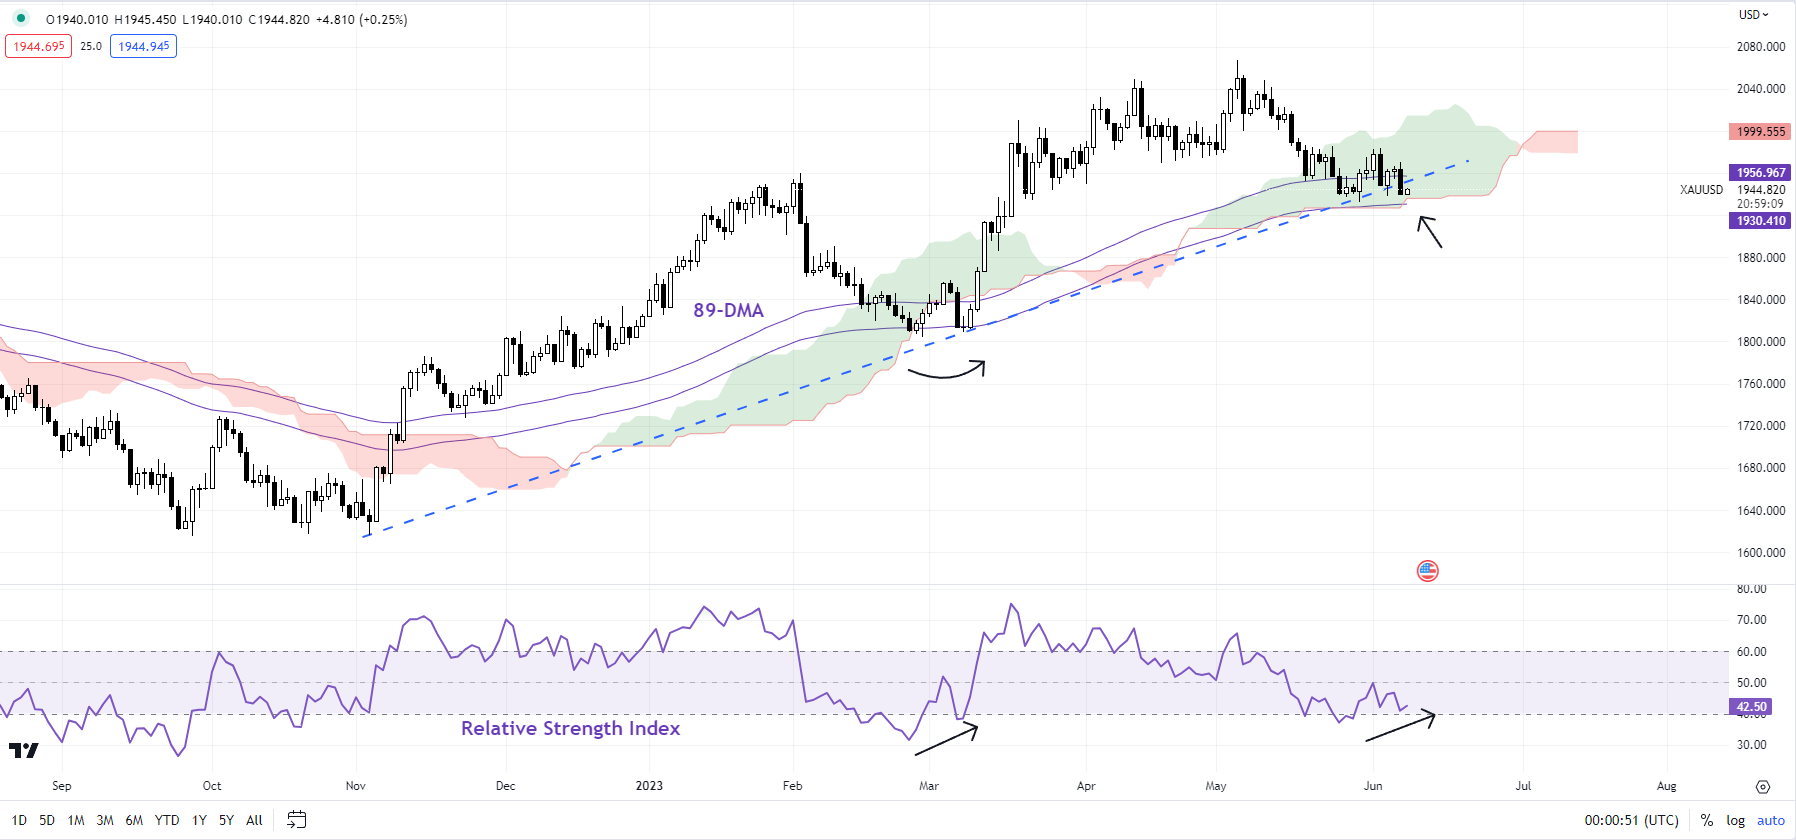
image2.png

The technical setup remains broadly unchanged from the previous update. See “Retreat in US Yields Supports Gold, But for How Long? XAU/USD, XAU/EUR Price Setups”, published May 31. On the daily chart, gold remains above quite a strong cushion around 1930, including an uptrend line from the end of 2022, the 89-day moving average, and the lower edge of the Ichimoku cloud. The colour-coded candlestick daily charts show the current trend is a consolidation within the overall bullish structure.

XAU/USD 240-minute Chart
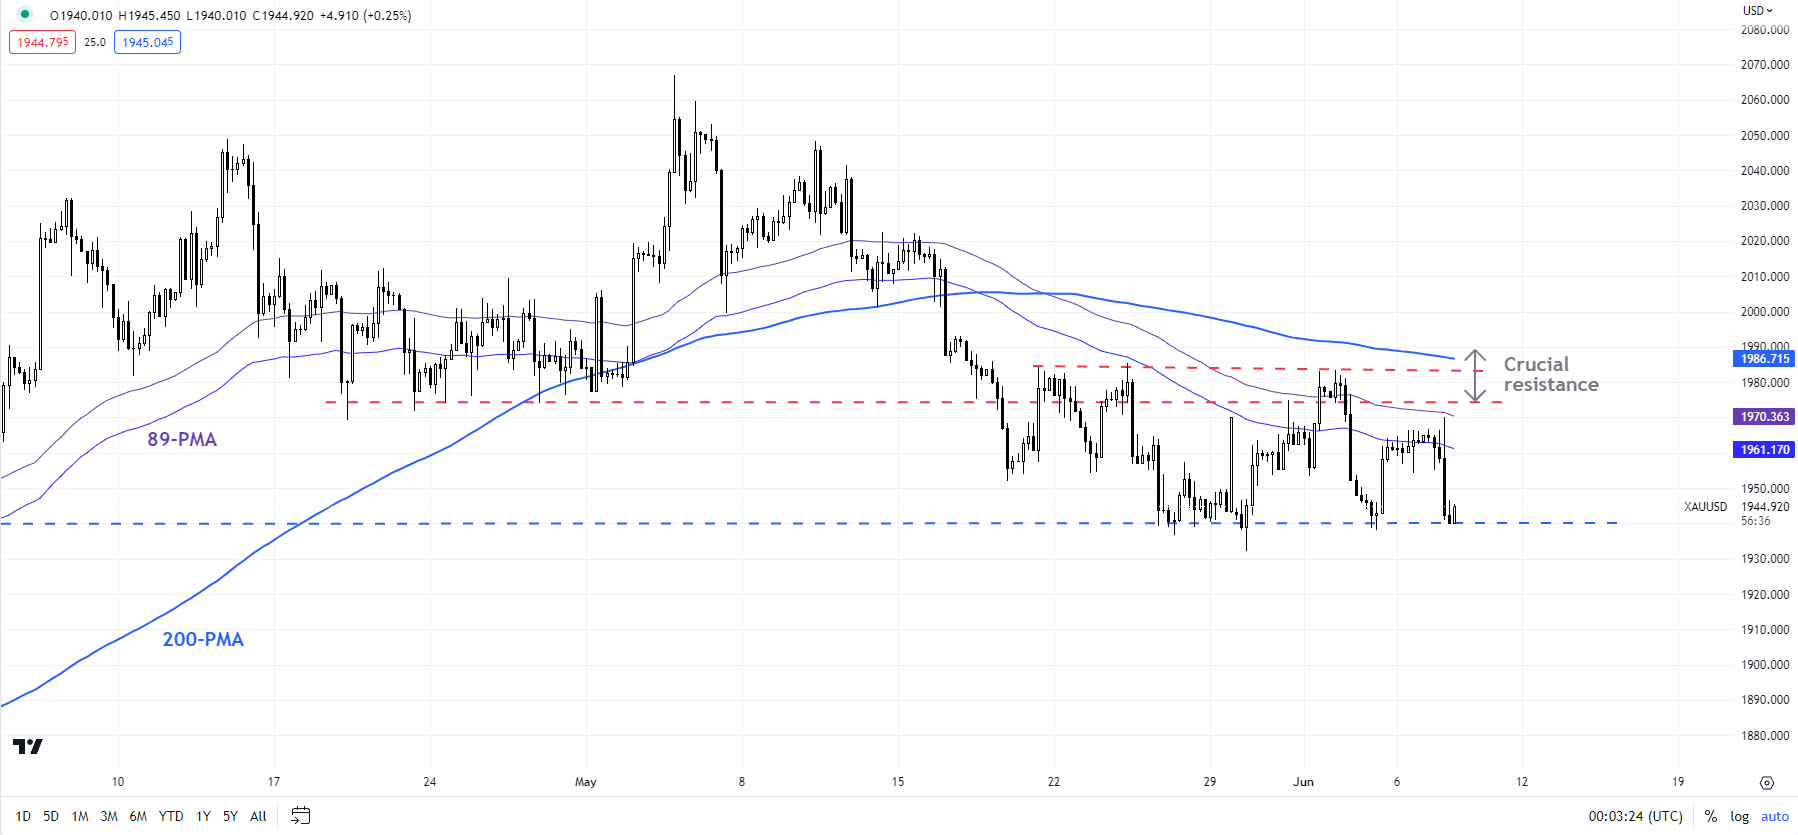
image3.png

Interestingly, the 14-day Relative Strength Index (RSI) is attempting to form a base – the previous retreat earlier this year terminated with a similar setup (see the daily chart). For a material rebound to occur this time around, XAU/USD would need to clear the immediate ceiling around 1980-1987 (including the 200-period moving average on the 240-minute chart and Friday’s high).

XAU/USD 240-minute Chart
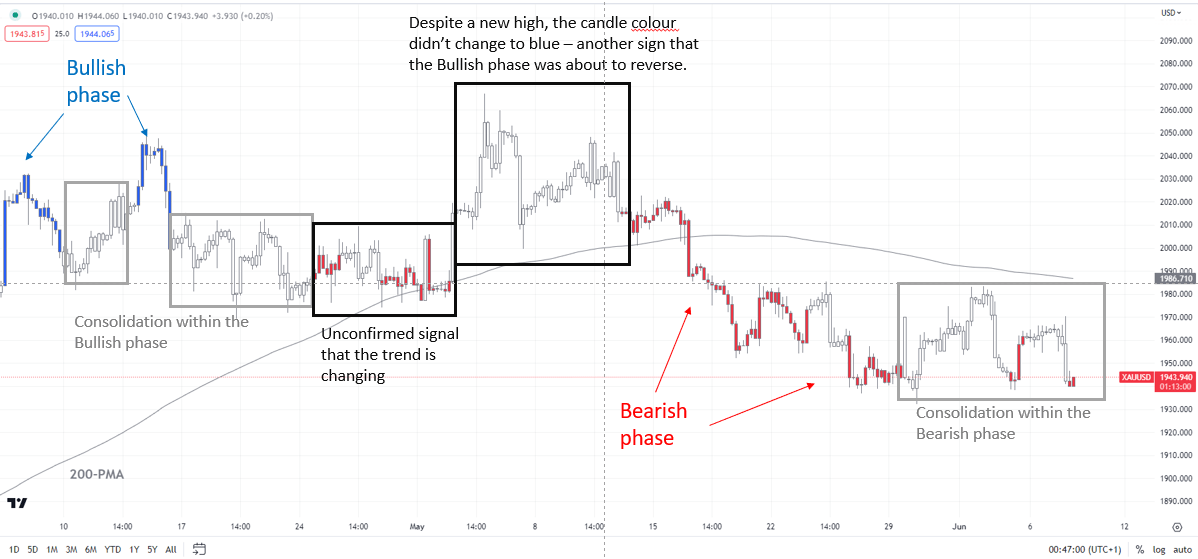
image4.png

Until then, the bearish setup on smaller and higher timeframes could dominate. The 240-minute colour-coded candlestick charts show XAU/USD remains in a broadly bearish phase. In recent months, the momentum on higher timeframe charts has been a concern – see previous updateson March 28,April 16,April 24,May 10, and “Is This the Moment of Reckoning for Gold?”, published May 17.

XAU/USD Daily Chart
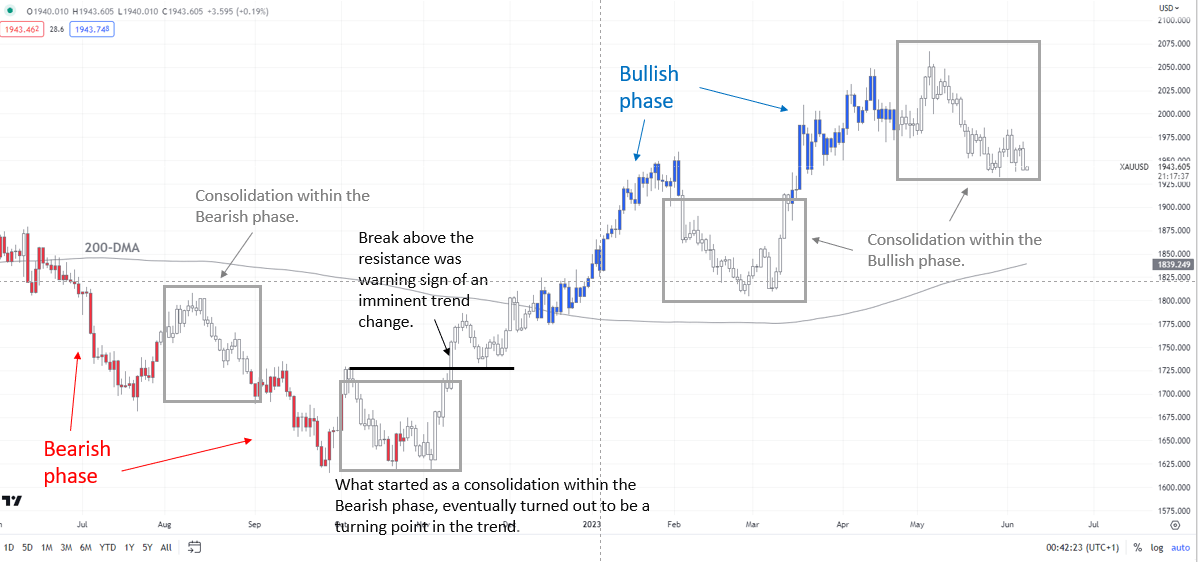
image5.png

Any break above 1980-1987 could expose upside scenarios toward 2020 or even 2048. On the downside, a decisive break under 1930 could open the door toward the 200-day moving average (now at about 1840).

XAU/USD Monthly Chart
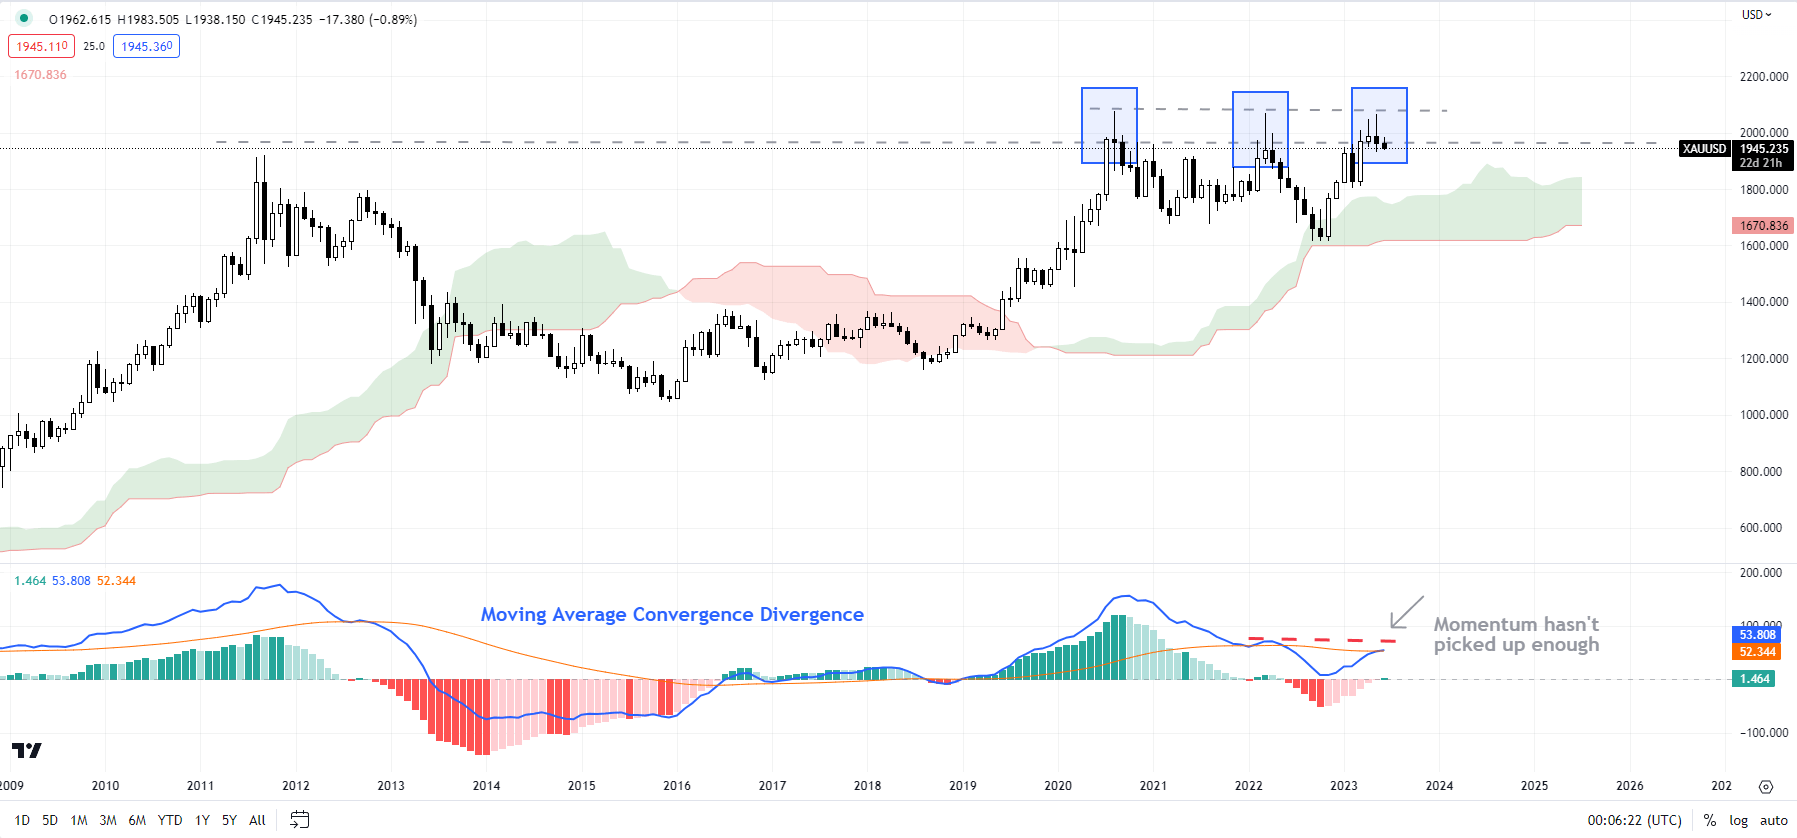
image6.png

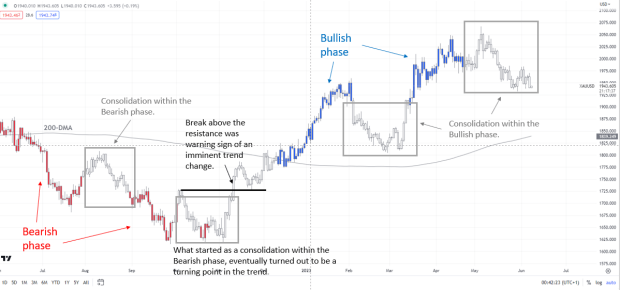
Note: The above colour-coded chart(s) is(are) based on trending/momentum indicators to minimize subjective biases in trend identification. It is an attempt to segregate bullish Vs bearish phases, and consolidation within a trend Vs reversal of a trend. Blue candles represent a Bullish phase. Red candles represent a Bearish phase. Grey candles serve as Consolidation phases (within a Bullish or a Bearish phase), but sometimes they tend to form at the end of a trend. Candle colors are not predictive – they merely state what the current trend is. Indeed, the candle color can change in the next bar. False patterns can occur around the 200-period moving average, or around a support/resistance and/or in sideways/choppy market. The author does not guarantee the accuracy of the information. Past performance is not indicative of future performance. Users of the information do so at their own risk.

Australian Dollar Holds Ground as Market Looks to the Fed after BoC Hike

Australian Dollar Holds Ground as Market Looks to the Fed after BoC Hike

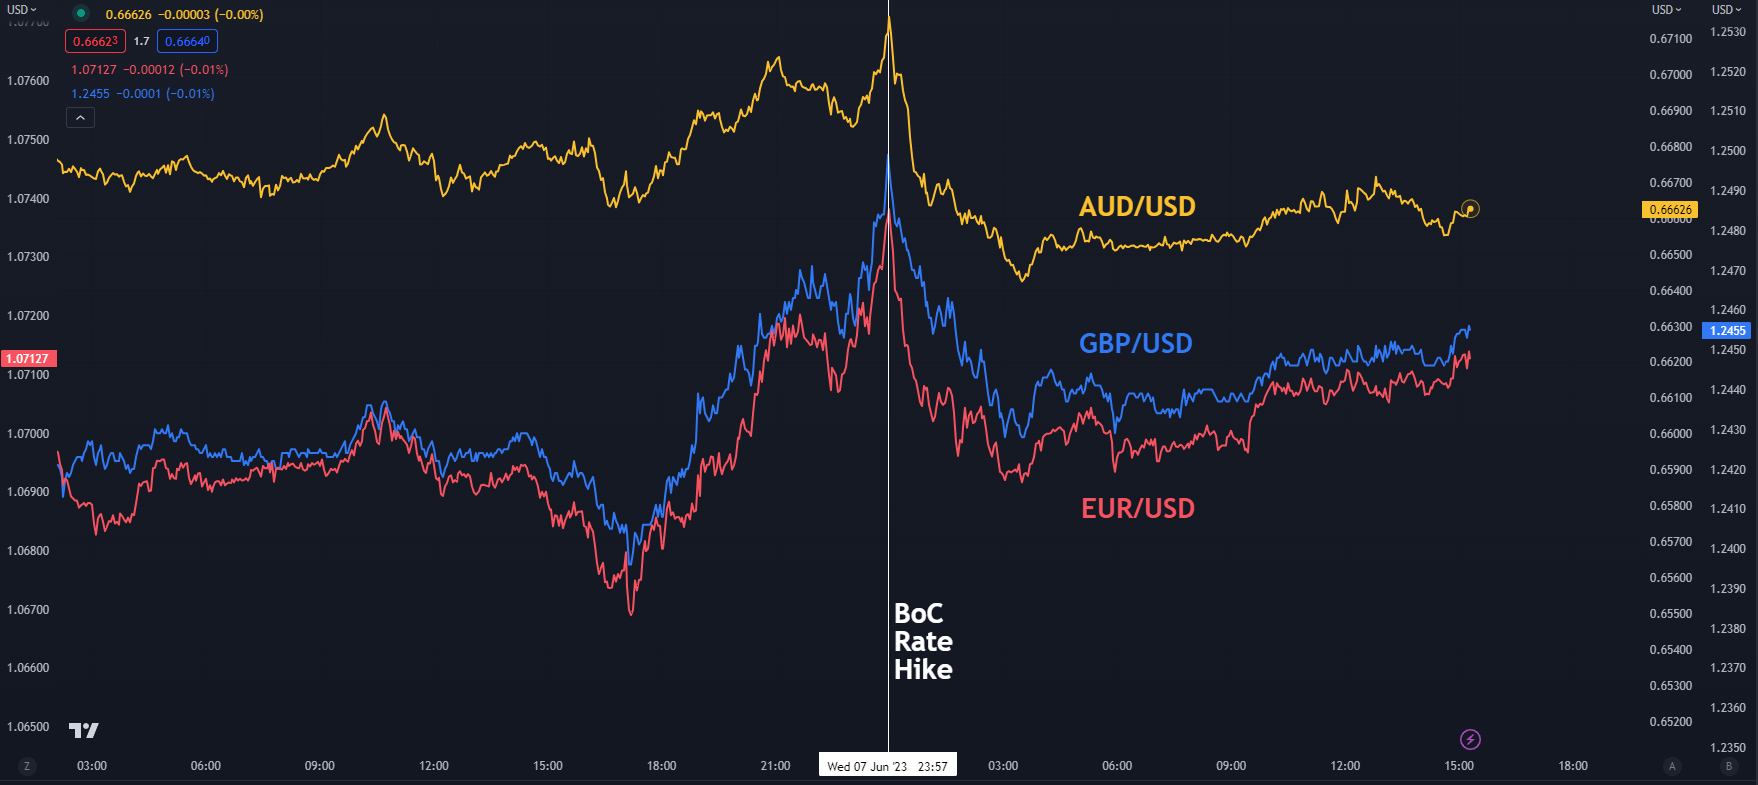
The Australian Dollar shrugged off a miss on trade balance data as markets reassess the interest rate outlook after the Bank of Canada (BoC) followed the RBA and put the hawks among the doves.

Both central banks have raised their respective cash rates by 25 basis points this week and now attention has turned toward the Federal Reserve, the European Central Bank and the Bank of Japan monetary policy meetings next week.

The RBA and BoC rate rises were mostly not anticipated by the market, and this has raised the spectre of next week’s meetings holding some surprises.

Interestingly, the US dollar was bought across the board when the BoC made its decision. This might highlight the risk within financial markets whereby a ‘skip’ on rate hikes from the Fed at their June 14th gathering might not be set in stone.

The hawkish tilt appears to have undermined equities with the Nasdaq leading the way lower on its close. The Nikkei 225 has also seen more profit-taking today as it drifted off over 1%.

Elsewhere, the Reserve Bank of India (RBI) left its cash rate unchanged today at 6.5%. USD/INR is steady near 82.50.

Australia’s trade balance came in at AUD 11.158 billion for the month of April rather than the AUD 13.64 billion anticipated. With AUD/USD below 70 cents, the domestic economy there seems likely to remain hot despite the RBA hike on Tuesday.

Like many asset classes, crude oil is caught in the range, although it is a bit softer to start Thursday. The WTI futures contract is under US$ 72.50 bbl while the Brent contract is a touch above US$ 77 bbl.

Gold is testing a long-range ascending trend line support level near US$ 1,960 and Treasury yields are stable after spiking higher in the back end of the curve in the North American session.

Looking ahead, after Eurozone GDP data, the US will see jobless claims figures.

AUDUSD, EUR/USD AND GBP/USD CHART OVER THE BoC RATE HIKE

image1.png


Looming Break in Canadian Dollar After BOC Hike: USD/CAD, EUR/CAD, GBP/CAD Price Setups

Looming Break in Canadian Dollar After BOC Hike: USD/CAD, EUR/CAD, GBP/CAD Price Setups

The Canadian dollar may have just received the boost to extend gains against some of its peers, thanks to the Bank of Canada’s (BOC) hike on Wednesday.

BOC hiked its overnight rate to a 22-year high of 4.75%, saying “concerns have increased that CPI inflation could get stuck materially above the 2% target.” The central bank, however, dropped the April language saying it “remains prepared to raise the policy rate further”, making it more data dependent. Markets are pricing in another rate hike in July, with the terminal rate seen at 5.15% by the end of the year.

IG Client Sentiment

image1.png

Technical charts are growing supportive of CAD against some of its peers.

USD/CAD: Looming bearish break

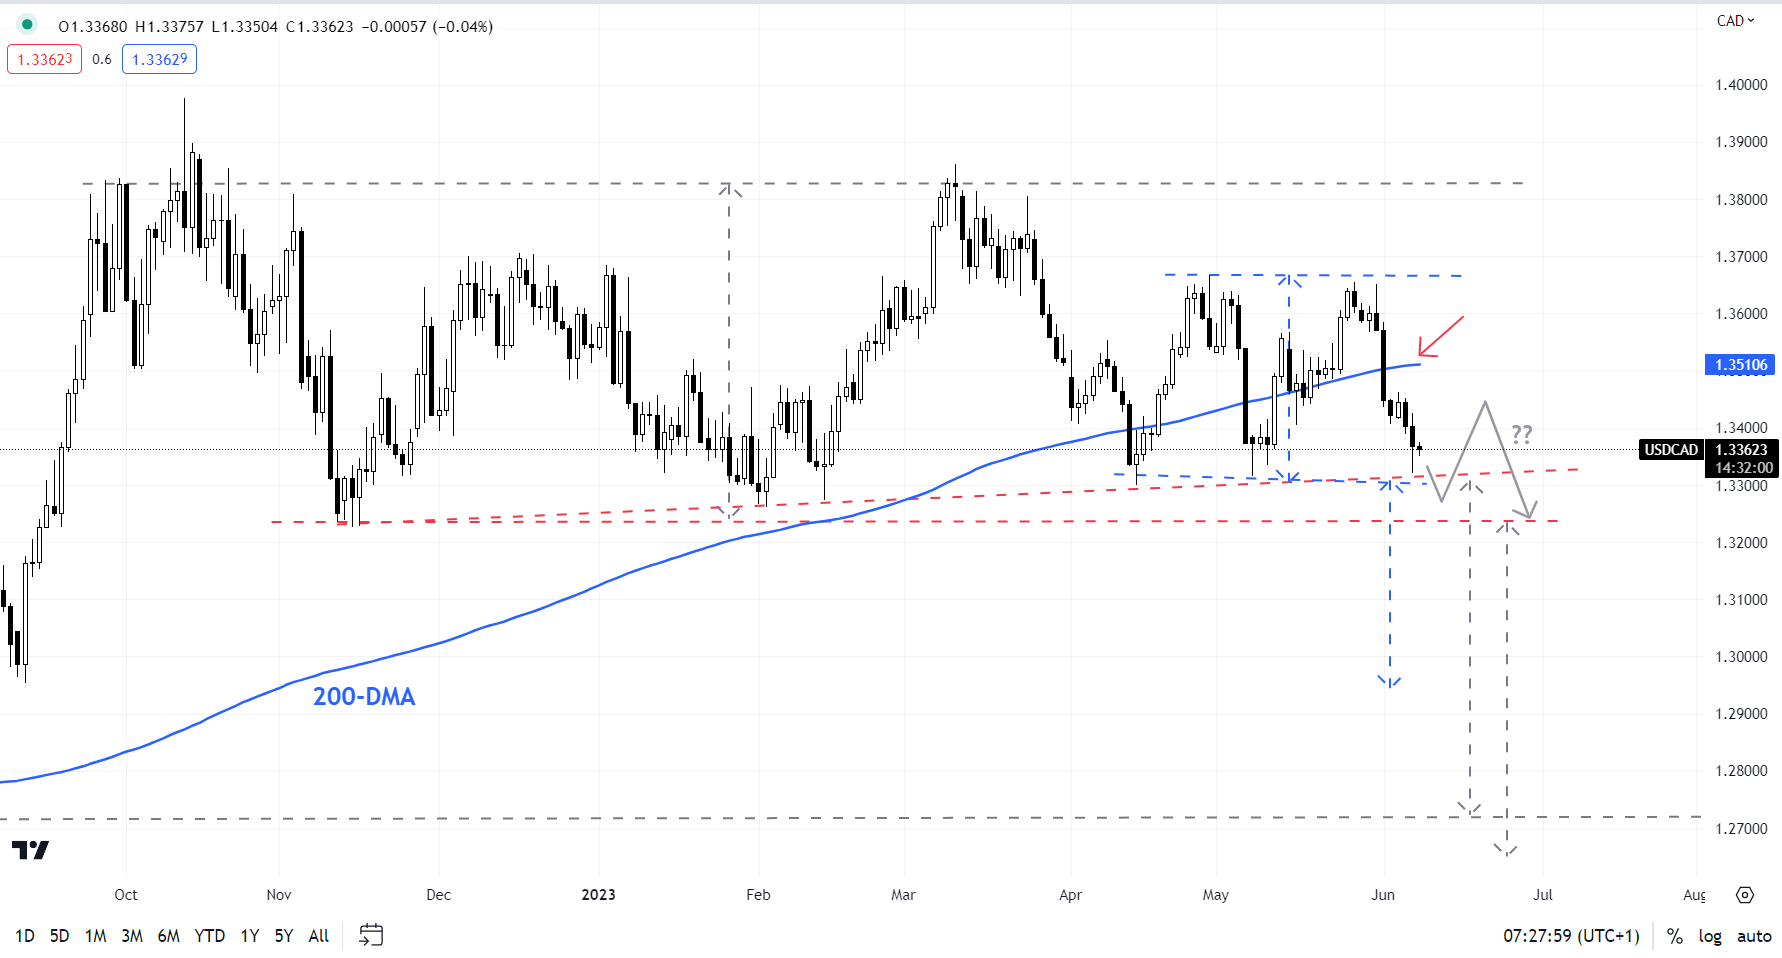
Granted USD/CAD has been sideways for months, but conditions could be getting ripe for a trend. USD/CAD is testing vital converged support around 1.3220-1.3320, a break below which could clear the way for a drop initially toward the psychological 1.3000, potentially toward the August low of 1.2725.

USD/CAD Daily Chart

Moreover, the IG Client Sentiment (IGCS) shows 70% of retail traders are net-long with the ratio of long to short at 2.3 to 1. The number of traders net-long is a whopping 74% higher from last week. The IGCS data at times functions as a contrarian indicator – the fact traders are net-long reduces the hurdle for USD/CAD to fall.

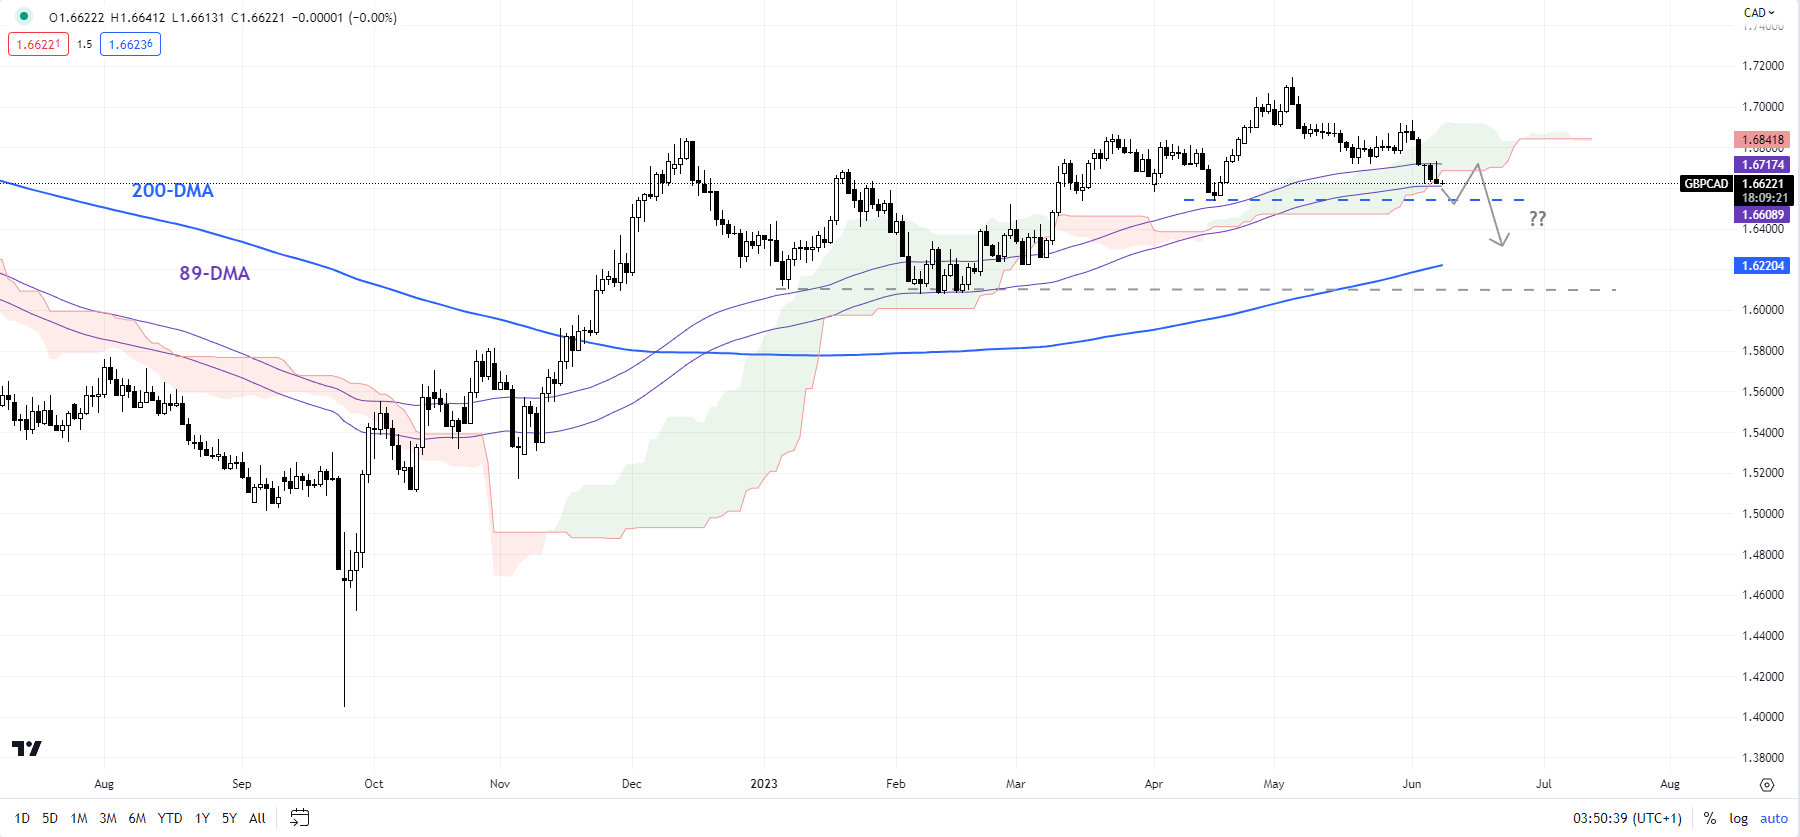
GBP/CAD Daily Chart

image3.png

GBP/CAD: Risks a drop toward the 200-DMA

GBP/CAD’s failure to rise decisively past the end-2022 high of 1.6850, slightly above major resistance on the 200-week moving average, points to fatigue in the nine-month-long rally. The cross is testing a crucial converged floor, including the April low of 1.6535, coinciding with the 89-period moving average. While a minor rebound can’t be ruled out given the significance of the support, the broader bias remains down, potentially toward the 200-day moving average (now at about 1.6225).

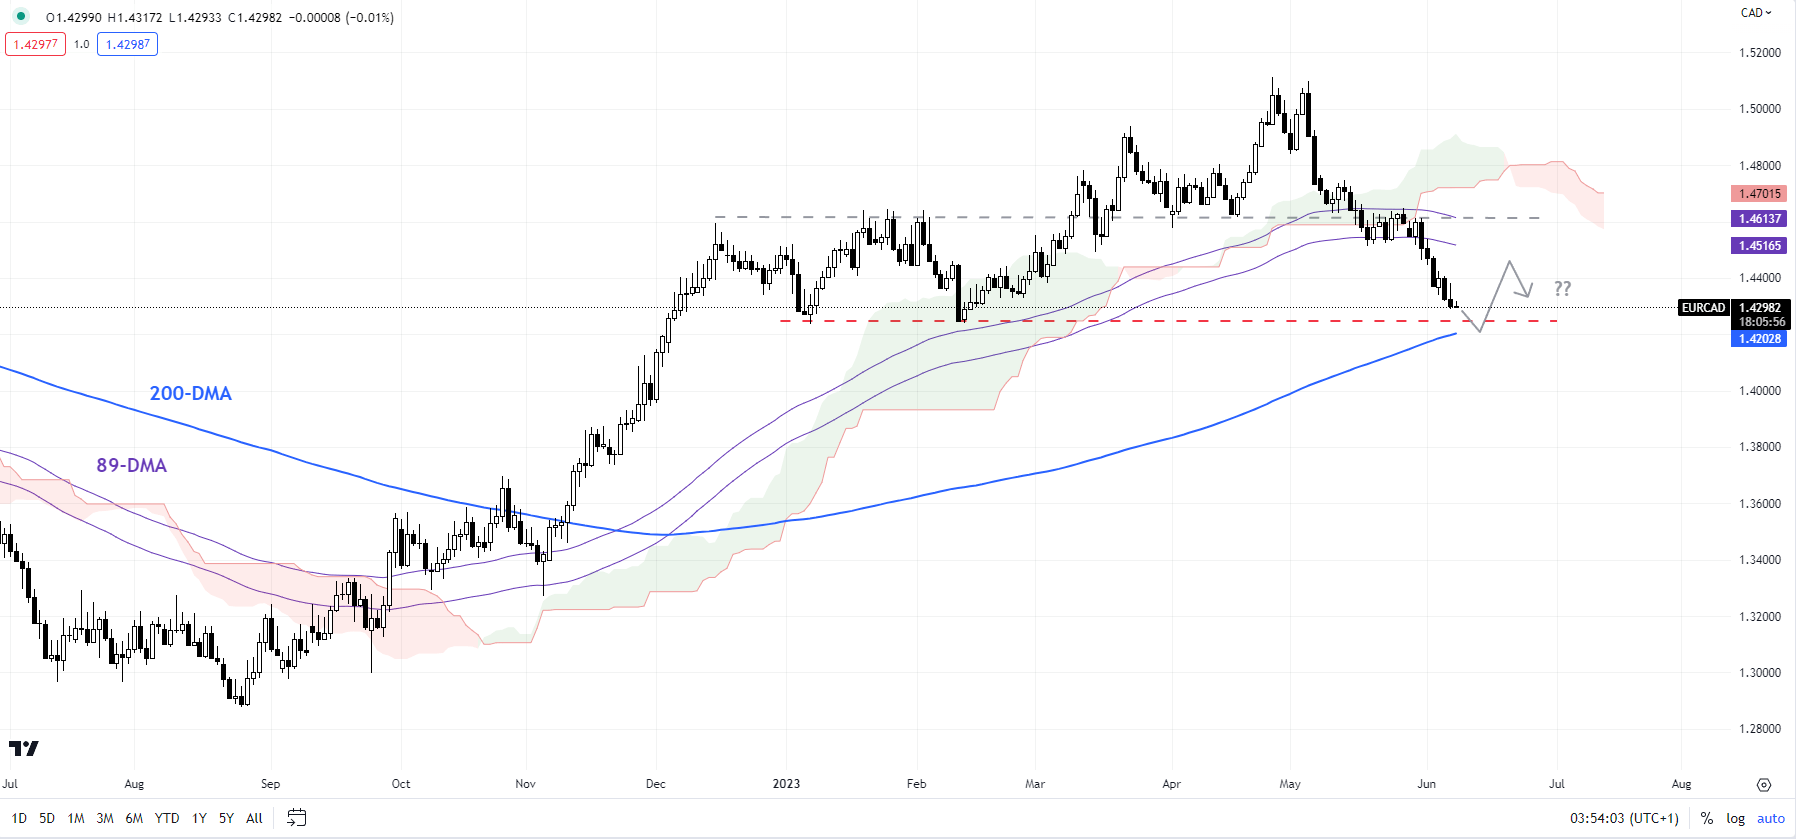
EUR/CAD Weekly Chart

image4.png

EUR/CAD: A minor pause on the cards?

EUR/CAD is approaching a major converged cushion on the 200-day moving average and a horizontal trendline from January at about 1.4235. Oversold conditions point to a minor bounce, but it may not sustain for long given the recent fall below the 89-day moving average and the Ichimoku cloud on the daily chart. Any break below 1.4235 could expose downside risks toward 1.4000. On the top side, the late-May high of 1.4650 would be tough to crack.

GBP/USD Price Forecast: UK Housing Prices a Sign of Future Pound Weakness?

GBP/USD Price Forecast: UK Housing Prices a Sign of Future Pound Weakness?

GBPUSD FUNDAMENTAL BACKDROP

The British pound remains bid in early trade this Thursday against the greenback but the latest RICS house price balance data for May (see economic calendar below) shows surveyors conveying a fall in prices – although less than expected. Following on from yesterday Halifax report, the RICS release highlights the tight monetary policy environment. The rest of the trading should be relatively quiet with some short-term volatility expected around the US jobless claims release.

ECONOMIC CALENDAR

image1.png

Bank of England (BoE) expectations (below) show roughly 100bps of additional interest rate hikes in 2023 which is comparatively high to other major central banks. This leaves room for a dovish repricing should UK economic data show signs of a continued economic slowdown (GDP, labor market, inflation etc.).

BANK OF ENGLAND INTEREST RATE PROBABILITIES

image2.png

TECHNICAL ANALYSIS

GBP/USD DAILY CHART

image3.png

Chart prepared by Warren Venketas, IG

Price action on the daily cable chart shows the pair approaching the apex point of a symmetrical triangle chart pattern. Pound bulls are now finding resistance at the 50-day MA (yellow) but the short-term directional bias remains uncertain as reflective by the Relative Strength Index (RSI) which is trading around the midpoint zone favoring neither bullish nor bearish momentum.

Get acquainted with upcoming changes in LiteFinance’s trading schedule this month.

Get acquainted with upcoming changes in LiteFinance’s trading schedule this month.

Queen’s Birthday, AU – 12.06.2023

Trading instrument Closure Resumption
ASX200 09/06/2023 23:59:59 12/06/2023 10:10:00
Juneteenth, US – 19.06.2023

Trading instrument Closure Resumption
XAUUSD 19/06/2023 20:15:00 20/06/2023 1:00:00
XAGUSD 19/06/2023 20:15:00 20/06/2023 1:00:00
UKBRENT 19/06/2023 20:15:00 20/06/2023 3:00:00
USCRUDE 19/06/2023 20:15:00 20/06/2023 1:00:00
XNGUSD 19/06/2023 20:15:00 20/06/2023 1:00:00
YM 19/06/2023 20:00:00 20/06/2023 1:00:00
SPX 19/06/2023 20:00:00 20/06/2023 1:00:00
NQ 19/06/2023 20:00:00 20/06/2023 1:00:00
NI225 19/06/2023 20:00:00 20/06/2023 1:00:00
NYSE CFD’s 16/06/2023 23:00:00 20/06/2023 16:30:00
NASDAQ CFD’s 16/06/2023 23:00:00 20/06/2023 16:30:00
Dragon Boat Festival, HK & CN – 22.06.2023

Trading instrument Closure Resumption
HK50 21/06/2023 22:00:00 23/06/2023 4:15:00
* The schedule is formed according to the time of LiteFinance’s trading server (GMT+3 as displayed in the trading platform).

The instruments other than specified here are traded as usual. The actual trading schedule for each trading instrument is always displayed in the “Info on the instrument” section in the Client area at LiteFinance.

This information is for guidance purposes only and is subject to change. Please, stay up to date.

If necessary, adjust your trading strategy to these changes. Please contact our support service if you need assistance.

EUR/JPY bounces off few pips from multi-day low, retakes 149.00 mark

EUR/JPY bounces off few pips from multi-day low, retakes 149.00 mark

The EUR/JPY cross drifts lower for the third successive day and drops to a multi-day low during the first half of trading action on Wednesday. Spot prices, however, recover a few pips during the early European session and bounce back to the 149.00 mark in the last hour.

Worries about a global economic downturn continue to weigh on investors’ sentiment, which benefits the safe-haven Japanese Yen (JPY) and exerts some downward pressure on the EUR/JPY cross. The concerns were fueled by weaker Chinese macro data, showing that the trade surplus sank to a 13-month low in May in the wake of a surprise slump in exports. This, in turn, suggested that overseas demand for Chinese goods remained weak and posed additional headwinds for the world’s second-largest economy.

Apart from this, the prospect of Japanese authorities intervening in the markets might further underpin the JPY and contribute to offered tone surrounding the EUR/JPY cross. The shared currency, on the other hand, is pressured by discouraging German Industrial Production figures, French Trade Balance and French Trade Balance. That said, a big divergence in the monetary policy stance adopted by the Bank of Japan (BoJ) and the European Central Bank (ECB) holds back bears from placing fresh bets around the EUR/JPY cross.

Against the backdrop of the recent hawkish comments by several ECB officials, President Christine Lagarde said earlier this week that there is no clear evidence that underlying inflation has peaked. This, in turn, reaffirms expectations that the ECB is not done raising rates despite the recent fall in consumer inflation. It is worth recalling that the headline Eurozone CPI decelerated more than anticipated, to the 6.1% YoY rate in May from the 7.0% previous and the Core CPI slowed from the 5.6% YoY rate in April to 5.3% last month.

The aforementioned fundamental backdrop seems tilted in favour of the Euro bulls and supports prospects for the emergence of fresh buying around the EUR/GBP cross. Hence, any meaningful downside is more likely to remain limited, at least for the time being.

EUR/CAD drops sharply to near 1.4300 despite investors anticipating an unchanged BoC policy

EUR/CAD drops sharply to near 1.4300 despite investors anticipating an unchanged BoC policy

The EUR/CAD has delivered a breakdown of the consolidation formed in a narrow range of 1.4320-1.4340 in the London session. The asset has dropped to near the round-level support of 1.4300. More action is anticipated from the pair ahead of the interest rate decision by the Bank of Canada (BoC).

BoC Governor Tiff Macklem has been keeping interest rates steady at 4.5% in their last two monetary policy meetings, reiterating that the current policy is restrictive enough to give a tough fight to Canada’s inflation. Also, Canada’s inflation has sharply slowed to 4.4% in April from post Covid high of 8.1% recorded in June 2022.

Analysts at ING expect the BoC to leave the policy rate at 4.5%, but after stronger-than-expected consumer price inflation and GDP and with the labor data remaining robust, we cannot rule out a surprise interest rate increase. A hawkish hold should be enough to keep the Canadian Dollar supported.

Later this week, Canada’s Employment data (May) will be of utmost importance. As per the preliminary report, the economy added fresh 23.2K jobs in May lower than April’s addition of 41.4K. The Unemployment Rate is seen rising to 5.1% from the former release of 5.0%.

Meanwhile, the Euro has come under pressure after German Factory Orders contracted sharply and Eurozone Retail Sales remained stagnant. However, European Central Bank (ECB) policymakers are still supporting more interest rate hikes amid persistence in core inflation. ECB President Christine Lagarde conveyed in the last monetary policy meeting that more than one interest rate hike is appropriate.

GBP/USD rebounds from 1.2400 as anxiety among investors for Fed policy stance deepens

GBP/USD rebounds from 1.2400 as anxiety among investors for Fed policy stance deepens

The GBP/USD pair has found a decent buying interest near the round-level support of 1.2400 in the London session. The Cable has shown recovery due to a decline in the US Dollar Index (DXY). The USD Index has faced selling pressure while attempting to reclaim Tuesday’s high around 104.40.

S&P500 futures have extended losses in Europe amid anxiety among investors about the interest rate decision by the Federal Reserve (Fed) in its June policy meeting. Market mood has turned cautious amid an absence of potential triggers this week.

On a broader note, the USD index is showing signs of volatility contraction as the economic calendar has nothing much to offer this week. Therefore, second-tier events could produce some decisive moves ahead.

On Wednesday, United States Goods and Services Trade balance data (April) will remain in focus. The economic data is expected to show a wider deficit of $75.2B vs. the prior deficit of $64.2B. This could impact the US Dollar ahead.

On the Pound Sterling front, stubborn United Kingdom inflation is consistently forcing the need for more interest rate hikes. The Bank of England (BoE) has already hiked interest rates consecutively 12 times to 4.50%. Inflation in the UK region is significantly higher than in the United States and Eurozone due to the tight labor market and higher food inflation.

The UK economy is facing the issue of labor shortages after the Brexit event and early retirement taken by several individuals due to Covid-19.

In June’s monetary policy, BoE Governor Andrew Bailey is expected to raise interest rates further to augment UK PM Rishi Sunak’s promise of halving inflation by year-end.

Steam to come out of housing market recovery as RBA rate-hiking cycle rolls on

Steam to come out of housing market recovery as RBA rate-hiking cycle rolls on

The RBA has lifted the cash rate a further 25 basis points in June, taking the cash rate 400 basis points higher to 4.1%, announcing 12 hikes since April last year.

A mix of outcomes across economic data through the month created another ‘line-ball’ call for the outlook in the cash rate. May saw measures of consumer sentiment trend lower alongside a rise in the unemployment rate, and retail trade was flat in April.

In the way of upside risks for inflation and the cash rate, the April monthly CPI indicator showed an annual lift of 6.8% (though the exclusion of volatile items saw a slowdown in annual growth). The Fair Work Commission decision to increase award wages by 5.75%, and minimum wages by 8.6% next financial year, also coincided with increased market expectations of a lift in the cash rate.

Adding to uncertainty around interest rate decisions is the housing market dichotomy. CoreLogic’s Home Value Index accelerated in May, rising 1.2% nationally and while established home and residential land values do not directly feed into the CPI housing indicator, there may be upside risk to inflation from rising home prices due to potential wealth effects. The minutes of the May board meeting noted rising asset prices had prompted the RBA to revise forecasts for consumption growth a little higher, and the June statement acknowledges house prices are rising again.

Although the monthly rate of growth in the CoreLogic rental index eased in May, rents continued to rise well above historic averages at 0.8%. The CoreLogic rent value index presents a leading indicator for the trajectory of CPI rents, where CoreLogic imputes an estimate of market rent based on listings evidence, while the CPI measures rents actually paid. It suggests that those rolling off fixed-leases may expect a rental increase, adding further upwards pressure to rental inflation.

However, there is weakness in other facets of housing market activity. New dwelling approvals plunged -8.1% in April, to the lowest level since April 2012. A higher interest rate environment is deterring the supply of new housing, which will continue to ease price pressures in the delivery of new dwellings as the construction pipeline slows. Inflation from residential construction costs, which has the largest weighting in the CPI ‘basket’, has reduced substantially over the past year.

In the short term, the June rate rise may take some steam out of the housing market. For the past two decades, there has been a strong negative correlation between movements in the RBA cash rate and the CoreLogic Home Value Index.

However, like many economic trends since the pandemic, the housing market has defied expectations. With continued strong demand from a surge in overseas migration, a slow return to pre-pandemic household size in the capital cities, and persistently low levels of advertised supply, the June rate hike may only serve to take some steam out of the recovery trend in housing values, rather than reverse recent gains.

NZ Economists: Is the Reserve Bank wrong about the OCR peak?

NZ Economists: Is the Reserve Bank wrong about the OCR peak?

Economists say the Reserve Bank may be incorrect that 5.5% is as high as the official cash rate will need to go.

The Reserve Bank said in its latest monetary policy statement that it did not expect to need to increase the OCR again beyond its current 5.5%.

It forecast the rate to stay at 5.5% into the middle of 2024, before easing slowly. Governor Adrian Orr said, with rates remaining at restrictive levels for some time, inflation would return to its target range of 1% to 3% a year.

But Westpac chief economist Kelly Eckhold said more increases were likely to be required to get inflation to that level.

He earlier said that a 6% peak would be needed, due to the increase in demand caused by a surge of migration.

“We do think the Reserve Bank is wrong to be quite so unequivocal in ruling out further interest rate increases beyond 5.5% given the scale of uncertainties currently at play. Having said that we do expect that they will be watching the data carefully in the period ahead and will adjust their view if it becomes apparent that more interest rate increases are required.”

Miles Workman, a senior economist at ANZ, said he also thought the Reserve Bank would need to increase rates again.

‘Unless something nasty comes out of left field, we think the Reserve Bank will be back in hiking mode by November.

Governor Adrian Orr said restrictive interest rate settings would eventually bring inflation down.

“We’re already seeing some evidence of economic resilience, with green shoots emerging in the housing market, monthly employment growth remaining solid in April, our Business Outlook survey recovering across a range of activity indicators in May, and Budget 2023 adding another $5 billion or so – around 1.4% of GDP – of Government demand to the mix in the year to June 2024. All this before annual non-tradables inflation has started to turn.”

He said headline inflation was likely to slow but was still likely to prove stickier than the Reserve Bank expected.

“That said, there are some significant soft spots out there, and for some households economic conditions are very tough indeed. The Reserve Bank’s current ‘watch, worry, wait’ stance is really about gauging whether or not this softness is enough to get core inflation down and the labour market back into ‘sustainable’ territory in a timely manner. Time will tell.”

He said it was not necessarily dangerous for the Reserve Bank to pause its hikes now, though.

“After such a rapid pace of tightening, it can be a good idea to wait for the economic impacts to catch up. Monetary policy can impact demand and inflation with long and variable lags.

“Conversely, pausing too early could mean that they end up needing to hike more overall, as this would give high inflation more oxygen than otherwise to become entrenched in wage and price setting behaviour. The current pause can be thought of as a middle ground between these two risks. Importantly, a pause certainly doesn’t guarantee that the next move in the OCR will be down – the pre-GFC experience is proof of that.”