US Dollar stabilizes following drop on jobless claims

US Dollar stabilizes following drop on jobless claims

The US Dollar (USD) stays resilient against its major rivals early Friday but the currency’s gains limited for now. The US Dollar Index, which gauges the USD’s valuation against a basket of six major currencies, clings to modest daily gains near 103.50 but remains on track to end the second week in negative territory.

In the week ending June 3, there were 261,000 initial claims for unemployment benefits in the United States (US), an increase of 28,000 from the previous week’s 233,000, the US Department of Labor reported on Thursday. This reading surpassed the market expectation of 235,000 by a wide margin and caused the USD to suffer large losses against its main competitors.

GBP/USD will struggle to hold its recent gains – Rabobank

GBP/USD will struggle to hold its recent gains – Rabobank

The Pound has regained its position as the best-performing G10 currency in the year. Economists at Rabobank discuss GBP outlook.

Cable to edge lower toward 1.22 on a three-month view

On the assumption that UK economic data will show increased signs of stress in Q3, and given also our view that the USD will remain well supported in the coming months, we expect that Cable will struggle to hold its recent gains.

The risk for GBP is that further progressive rate hikes from the Bank significantly undermine the recently improved growth outlook.

We see scope for Cable to edge lower to GBP/USD 1.22 on a three-month view.

Outlook on FTSE 100, DAX 40 and S&P 500 Ahead of Next Week’s Central Bank Meetings.

Outlook on FTSE 100, DAX 40 and S&P 500 Ahead of Next Week’s Central Bank Meetings.

FTSE 100 continues to struggle

​ ​Given the swathe of ex-dividend names on Thursday, the FTSE 100 continues to struggle, lagging other global indices which have shown signs of strength on hopes that the Fed will opt to leave its hiking campaign on pause for longer after jobless claims came in weaker than expected.

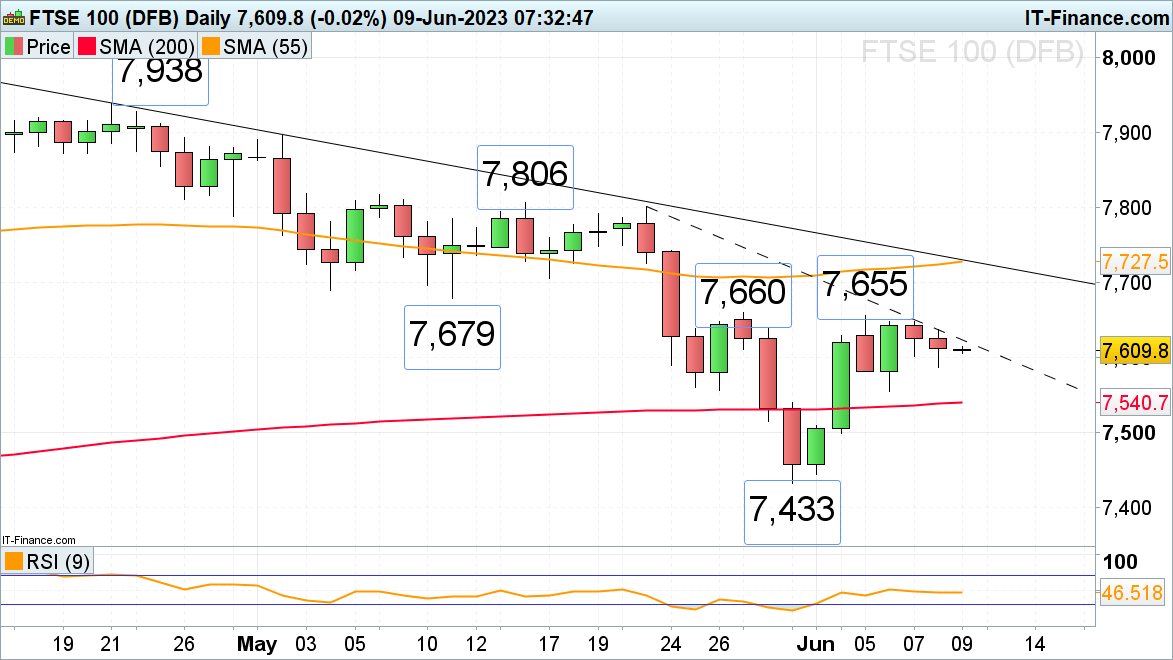
​The FTSE 100 still has the late May and current June highs at 7,655 to 7,660 in its sights. It will continue to do so as long as this week’s 7,555 low underpins.

​Minor support above this level can be spotted at Thursday’s 7,588 low.

​Immediate resistance is seen along its May to June tentative resistance line at 7,624, a rise above which will target the 7,655 to 7,660 zone. A rise above this zonewould put the mid-May low at 7,679 on the map.

​Further up meanders the 55-day simple moving average (SMA) at 7,727.

FTSE 100 Daily Price Chart – June 9, 2023

​DAX 40 still tries to head higher

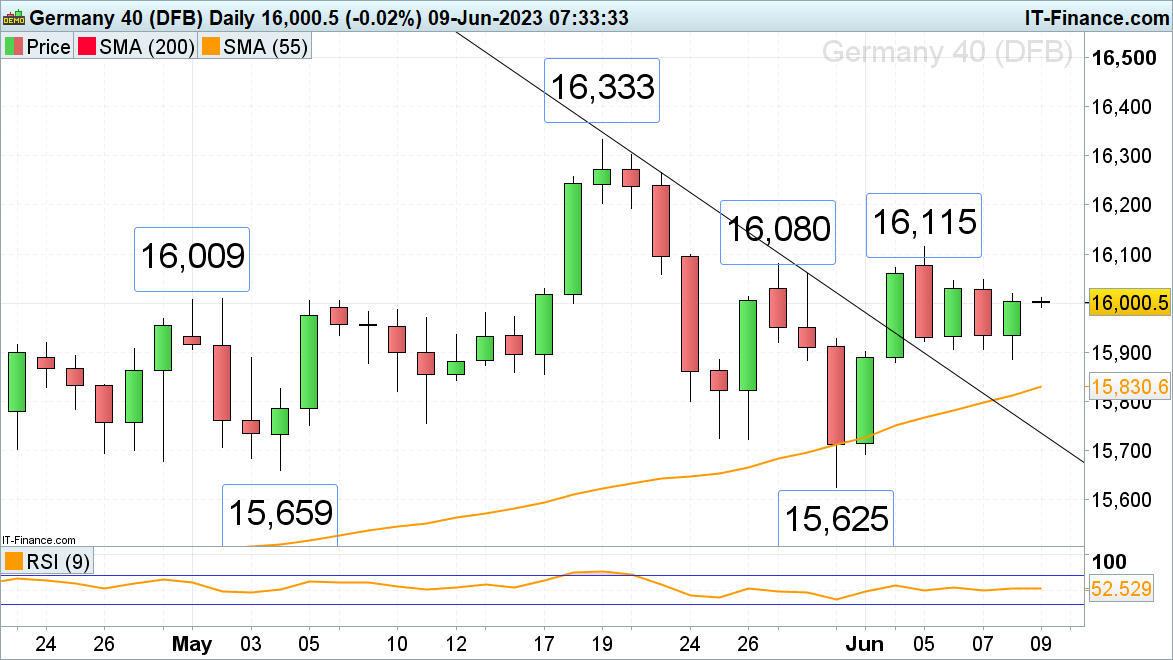
​The DAX 40 is once again trying to reach a late May high at 16,080 on the back of a stronger close on Wall Street.

​This is the case despite the Eurozone technically sinking into a recession. Gross domestic product (GDP) fell by a revised 0.1% in the first quarter of 2023 and the final three months of 2022, showing two consecutive quarters of negative growth.

​A rise and daily chart close above the 16,080 high would target last week’s 16,115 high, above which lies the May all-time record high at 16,333.

​As long as Thursday’s low at 15,886 underpins, further upside is expected to be seen.

DAX 40 Daily Price Chart – June 9, 2023

​S&P 500 remains on track to reach Monday’s nine-month high

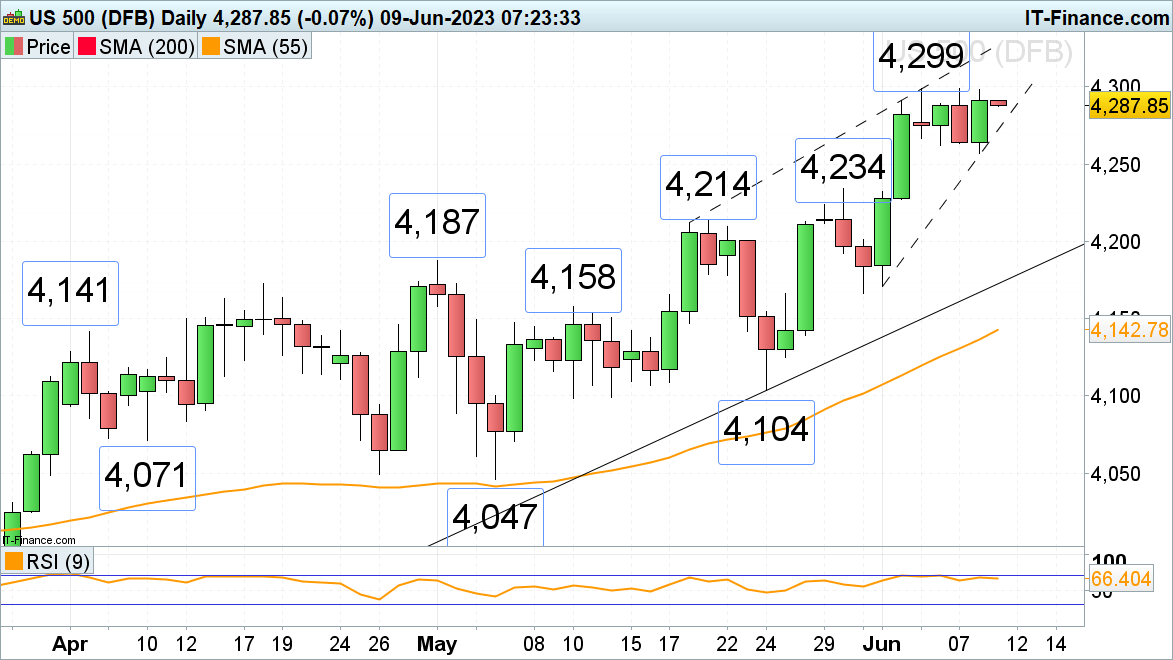
​​On Monday, the S&P 500 rallied to a nine-month high at 4,299, close to its August 2022 peak at 4,325, as traders await next week’s Federal Reserve Open Market Committee meeting (FOMC).

​With the general expectation being that the Fed is to hold its rates steady at its June meeting, stock markets continue to look for a short-term bid. The 4,299 to 4,325 zone will remain in focus as long as no slip through Thursday’s low at 4,257 is seen.

​Potential retracements should find minor support at this week’s 4,267 to 4,257 lows, below which sits far more significant support between the mid-to-late May highs at 4,234 to 4,214.

S&P 500 Daily Price Chart – June 9, 2023

Gold Price Forecast: Further volatility is looming for XAU/USD in the next few days – Commerzbank

Gold Price Forecast: Further volatility is looming for XAU/USD in the next few days – Commerzbank

Gold price was able to regain some ground yesterday. Economists at Commerzbank analyze how US inflation due out next Tuesday could impact XAU/USD.
Gold unlikely to have much in the way of further upside potential until the Fed meeting

Further volatility is looming for the Gold price in the next few days given that the US inflation data will be published on Tuesday – a data heavyweight that could shift the interest rate expectations of the market significantly again.

The figures would probably have to surprise considerably to the downside for the market to entirely price out any further potential US rate hikes, and this does not appear very likely. Thus, the Gold price is unlikely to have much in the way of further upside potential until the Fed meeting.

EUR/USD remains on the back foot below 1.0800

EUR/USD remains on the back foot below 1.0800

EUR/USD remains on the defensive below 1.0800, as it consolidates weekly gains heading into Friday’s European session. The pair takes cues from the market’s sluggish momentum amid a light calendar and repositioning ahead of next week’s top-tier EU/ US events.

EUR/USD broke above the 100-period Simple Moving Average (SMA) on the four-hour chart, currently located at 1.0740, for the first time since early May and closed the last four four-hour candles above that level. Additionally, the Relative Strength Index (RSI) indicator climbed above 60, reflecting a buildup of bullish momentum.

In case the 1.0740/50 (100-period SMA, Fibonacci 23.6% retracement of the latest downtrend) area is confirmed as support, buyers should remain interested. In that scenario, 1.0800 (Fibonacci 38.2% retracement, psychological level) and 1.0850/60 (200-period SMA, Fibonacci 50% retracement) could be seen as next bullish targets.

On the downside, EUR/USD could stretch lower toward 1.0720 (50-period SMA) and 1.0700 (psychological level) with a four-hour close below 1.0740/50.

EUR/USD broke out of its weekly trading range and reached its highest level in two weeks near 1.0790 on Thursday. The pair stages a technical correction early Friday but stays afloat above the key 1.0740/50 support area.

The number of initial claims for unemployment benefits in the US jumped to 261,000 in the week ending June 3 from 233,000 in the previous, the US Department of Labor announced on Thursday. This reading surpassed the market expectation of 235,000 by a wide margin and caused markets to lean toward a no change in the Federal Reserve’s policy rate next week. In turn, the benchmark 10-year US Treasury bond yield fell sharply and the US Dollar (USD) suffered heavy losses against its major rivals.

According to the CME Group FedWatch Tool, markets are pricing in only a 24% probability of the Fed raising the policy rate by 25 basis points on June 14.

Early Friday, the Euro Stoxx 50 Index trades flat and US stock index futures lose between 0.1% and 0.2%. In case markets remain cautious ahead of next week’s key macroeconomic events, the USD could hold its ground in the American session.

It’s also worth noting that investors could readjust positions and book some profits heading into the weekend, ramping up the market volatility later in the day.

Crude Oil Price Bounces Around but is Unable to Break the Range. Where to for WTI?

Crude Oil Price Bounces Around but is Unable to Break the Range. Where to for WTI?

Crude oil continued its bumpy ride this week going into the Friday session after news reports of a potential US – Iran deal to free up supply for the global market overnight.

The Israeli news outlet Haaretz cited Israeli defence officials as saying that progress had been made toward a deal that will allow Iranian oil back onto the open market in exchange for Tehran to cease the process of high-level enrichment of uranium.

It is being reported that the deal may lead to a million barrels per day being added to supply. The news comes hot on the heels of the announcement last weekend that Saudi Arabia will cut its output by the same amount starting on July 1st.

The OPEC+ meeting last Sunday created a tick-up in price and volatility to start the week, but crude then fell back within the range.

While the overnight news saw a notable dip lower, the price quickly recovered with the US Dollar tumbling in the aftermath of an unexpected bump up in US initial jobless claims. They printed at 261k for the week ended June 3rd against forecasts of 235k.

Treasury yields slipped lower across the curve with the larger losses seen in the back end of the curve. The benchmark 10-year note dropped around 10 basis points to settle near 3.72% going into the Friday session.

The 2s 10s yield spread remains near record inversion at around -0.80%. This remains an ominous sign for the global economic outlook. Such inversions have historically been a precursor to a slowdown in economic activity.

It remains to be seen if this is to eventuate but the concern for the demand for oil is front of mind for traders with China also unable to kick-start its economy after re-opening from pandemic restrictions.

Unlike many Western countries that are trying frantically to rein in uncomfortably high inflation, China’s CPI printed at 0.2% year-on-year to the end of May today. Additionally, PPI was -4.3% for the same period.

The lack of price pressures in the world’s second-largest economy might continue to undermine crude.

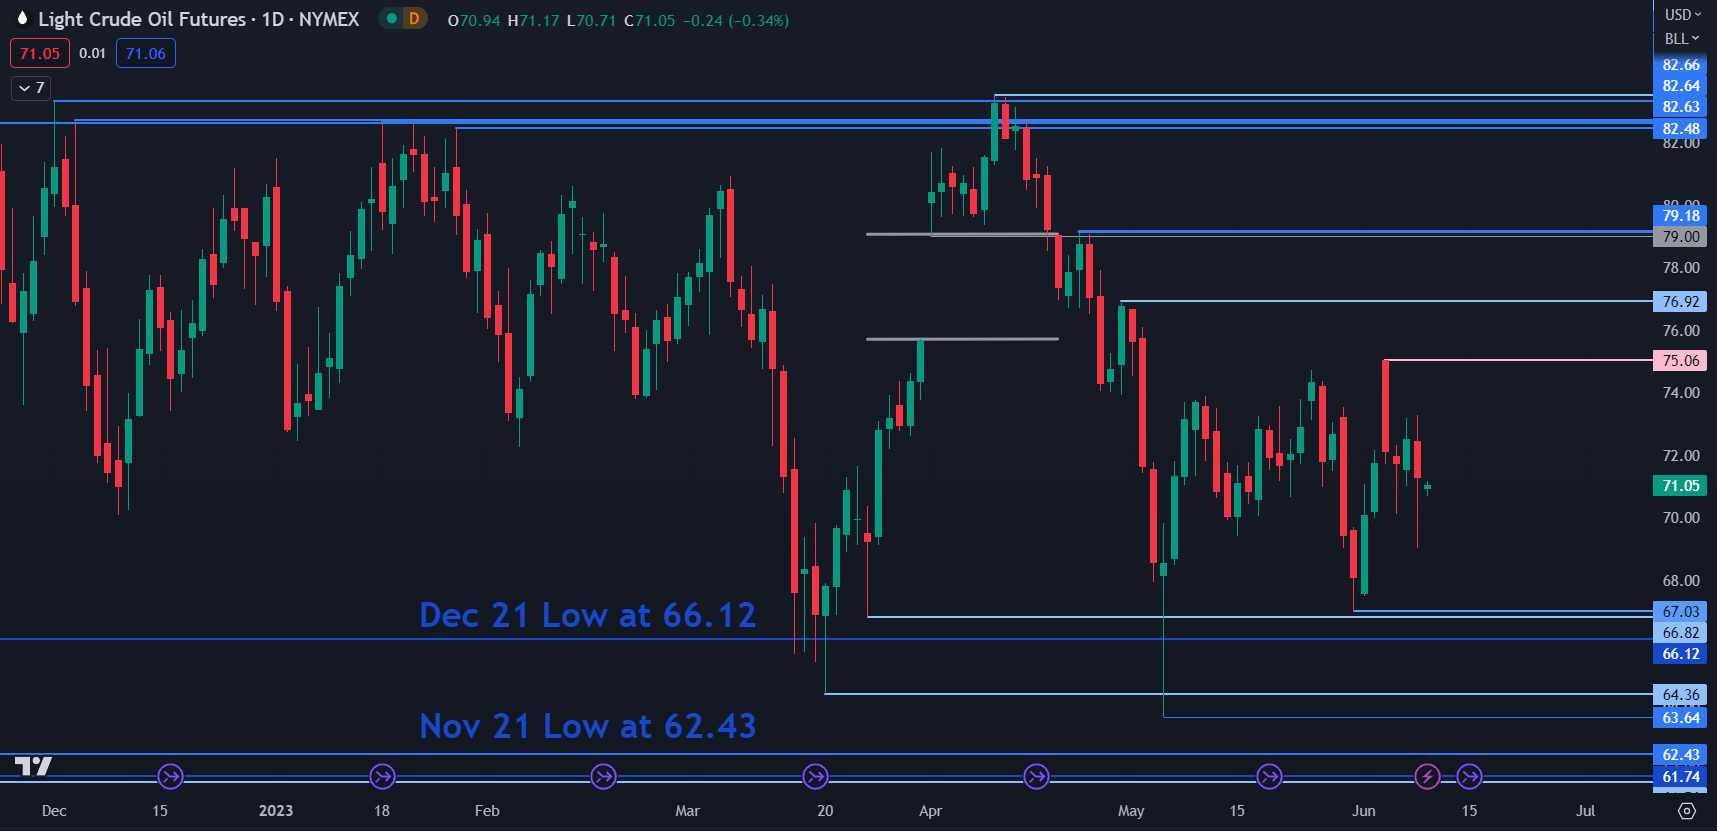
WTI CRUDE OIL TRAPPED IN THE RANGE FOR NOW

image1.png


EUR/USD IG Client Sentiment: Our data shows traders are now net-short EUR/USD for the first time since May 11, 2023 when EUR/USD traded near 1.09.

EUR/USD IG Client Sentiment: Our data shows traders are now net-short EUR/USD for the first time since May 11, 2023 when EUR/USD traded near 1.09.

Number of traders net-short has increased by 17.81% from last week.

SYMBOL TRADING BIAS NET-LONG% NET-SHORT% CHANGE IN LONGS CHANGE IN SHORTS CHANGE IN OI
EUR/USD BULLISH 49.78% 50.22% -20.50% Daily

-5.28% Weekly

35.51% Daily

17.81% Weekly

0.33% Daily

5.06% Weekly

EUR/USD Bullish
What could changes and extremes in retail trading signal for the market?
Get My Guide

EUR/USD: Retail trader data shows 49.78% of traders are net-long with the ratio of traders short to long at 1.01 to 1. In fact, traders have remained net-short since May 11 when EUR/USD traded near 1.09, price has moved 1.29% lower since then. The number of traders net-long is 20.50% lower than yesterday and 5.28% lower from last week, while the number of traders net-short is 35.51% higher than yesterday and 17.81% higher from last week.

We typically take a contrarian view to crowd sentiment, and the fact traders are net-short suggests EUR/USD prices may continue to rise.

Our data shows traders are now net-short EUR/USD for the first time since May 11, 2023 when EUR/USD traded near 1.09. Traders are further net-short than yesterday and last week, and the combination of current sentiment and recent changes gives us a stronger EUR/USD-bullish contrarian trading bias.

Trading Forex at the News Release

Trading Forex at the News Release

Trading forex news releases requires a tremendous amount of composure, preparation and a well-defined strategy. Without these qualities, traders can easily get swept up in all the excitement of a fast-moving market to their detriment. This article provides useful strategies on how to trade forex news during a major news release.

Forex News Trading Strategies

There are two common strategies for trading forex at the news release:

  1. Initial Spike Fade strategy
  2. News Straddle strategy

Each one provides a robust plan for traders to follow, depending on the market environment observed at the time of the release, and how best to approach that particular market.

Before reading further it is essential that you have a good grasp on the basics of news trading. If you are new to trading or simply require a refresher, take a look at our introduction on how to trade forex news.

1. Initial Spike Fade Strategy

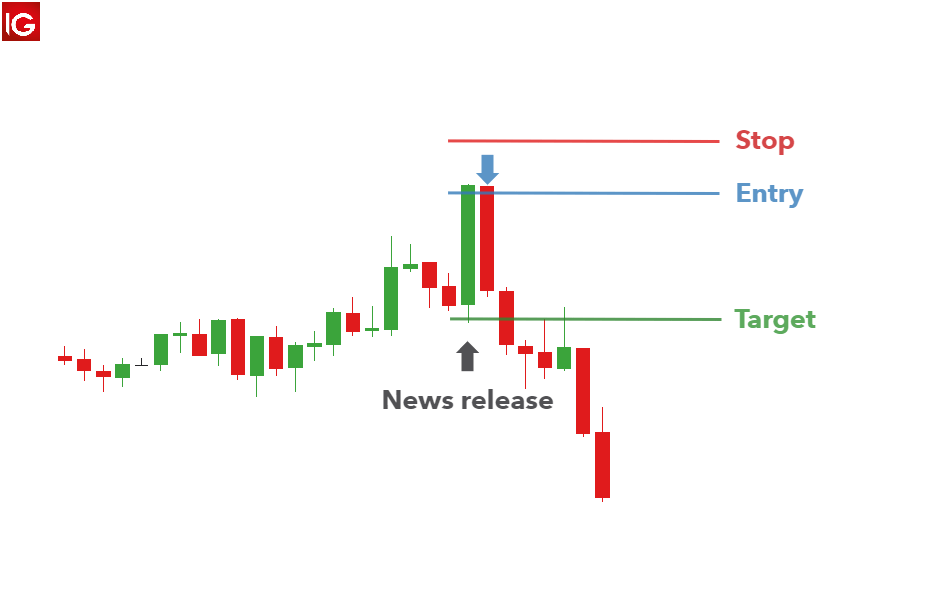
This strategy looks to capitalize on an overreaction in the market over the short term by fading the initial move. This strategy suits reversal traders, scalpers and day traders due to fast moving and erratic pricing that often follows a major news release.

Overreactions and subsequent reversals are seen fairly regularly in the forex market as large institutions add to the increased volatility of the initial move. The market as a whole, often spikes as an overreaction and subsequently push price back toward pre-release levels.

Once the market calms down and spreads return to normal, the reversal often gains momentum showing early signs of a potential new trend.

The shortfall associated with this strategy is that the initial spike may turn out to be the start of a prolonged move in the direction of the initial spike. This underscores the importance of using well-defined stops to limit downside risk and get you out of a bad trade quickly.

How to implement initial spike fade strategy:

  1. Select the relevant currency pair: Ensure the major news event corresponds to the desired currency pair to trade, i.e. Non-Farm Payrolls will affect USD crosses.
  2. Switch to a five-minute chart: After selecting the desired market, switch to a 5-minute chart just before the news release.
  3. Observe the close of the first five-minute candle: The first five-minute candle is usually quite large. When price approaches either the spike high or the spike low, fade the move by trading in the opposite direction.
  4. Stops and limits: Stops can be placed 15 pips above the high for a short trade or 15 pips below the low for a long trade. Targets can be set at two or three times the distance of the stop.

initial spike fade strategy in forex news trading

2. News Straddle Strategy

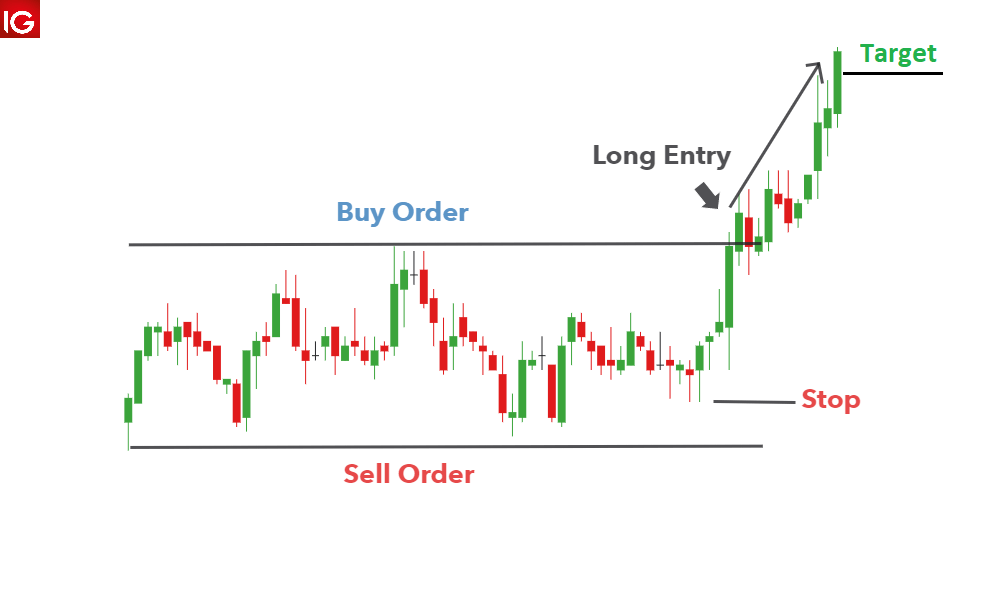
The news straddle strategy is perfect for traders expecting a huge surge in volatility but are unsure of the direction. This strategy lends its name from a typical straddle strategy in the world of options trading as it uses the same core strategy – to capitalize on an increase in volatility when direction is uncertain.

The disadvantage of the news straddle approach surfaces when price breaks support or resistance only to reverse soon thereafter. Similarly, price can trigger the entry order and move toward your target only to reverse until a stop it hit.

This strategy can be implemented using the following steps:

  1. Establish a range with support and resistance.
  2. Set two orders to open: Set a working order/ entry order to open a long trade if price breaks above resistance and one to go short if price trades below support.
  3. Remove remaining order after confirming direction: The market has the potential to breakout of the range and once this happens, the one entry order will be triggered, and a trade will be opened. Immediately remove the entry order that was not triggered.
  4. Stops and limits: A tight stop can be placed at the recent range low when going long and recent high when going short. Limits can be placed in line with a positive risk to reward ratio.

Straddle news trading strategy

Trading the News During the Release: Conclusion

Trading forex news at the news release has the potential to overwhelm traders with increased volatility in a short period of time. However, through the adoption of a solid strategy, traders can approach these volatile periods with greater confidence and mitigate risk of a runaway market through the use of guaranteed stops (where available).

Take a look at what our in-house analysts have forecasted as the top trading opportunities for the year.

Trading Forex News Releases FAQs

How can I tell which direction the market will trade after at the release?

Forecasting the economic news release is one thing, predicting how traders will react to the news release is quite difficult. When estimations are unsurprising or more or less similar to the previous recorded number, the market tends to digest this information and it is reflected in the lead up to the release. However, there is no guarantee that the market direction/trend will be maintained even if the news comes out exactly as was estimated. This is because different market participants can draw different conclusions that will influence their trades.

Someone may consider data that prints in line with expectations as a bad thing and someone else may view it as a good thing. The bottom line is that traders need to have a strategy in place with predetermined risk parameters.

USD Price Forecast: DXY Holds its Breath Ahead of Big Data Week

USD Price Forecast: DXY Holds its Breath Ahead of Big Data Week

USD FUNDAMENTAL BACKDROP

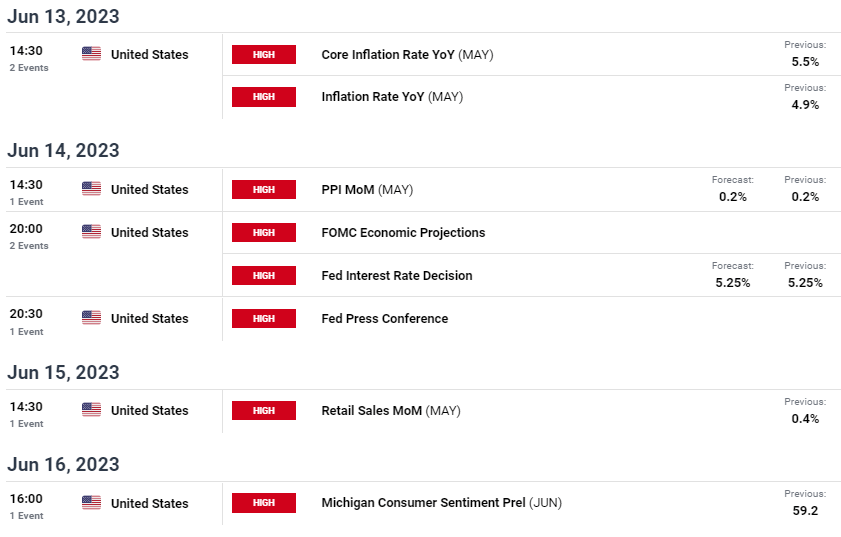
The Dollar Index (DXY) is marginally higher this Friday morning after yesterday’s slump following the US jobless claims report. With no economic data scheduled for today, focus shifts to next week’s plethora of high impact US releases (see economic calendar below). US CPI and the Federal Reserve’s interest rate decision will dominate. US CPI will be the primary factor for generating a short-term directional bias with recent data all culminating into a slowing US economy. Should inflation come in higher or elevated, this could unwind other data releases and heighten further monetary policy tightening forecasts from the Fed.

US ECONOMIC CALENDAR (GMT +02:00)

image1.png

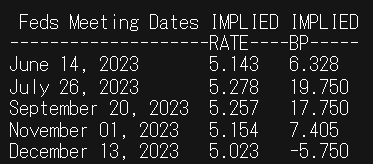
Money markets are currently pricing in a 75% probability of a rate pause for next week but may change in tandem with the US CPI print.

FEDERAL RESERVE INTEREST RATE PROBABILITIES

image2.png


Asia Day Ahead: Wall Street Up Overnight; Sentiment in Extreme-Greed Territory

Asia Day Ahead: Wall Street Up Overnight; Sentiment in Extreme-Greed Territory

The softer US economic calendar overnight prompted market participants to source for clues on the Fed’s policy path from the US weekly jobless claims, which reflected a pull-ahead in initial claims reading to its highest since October 2021 (261,000 versus 235,000 forecast). With its tendency to provide an early lead for the US unemployment rate, its sharp rise uplifted hopes that the US labour market may continue to see some softening ahead, although we will have to look towards subsequent weeks’ data to provide conviction for a clear trend.

With rate expectations being highly sensitive to economic data on the Fed’s data-dependent stance, the claims figure translated to a dovish adjustment in rate expectations towards the end of the year. Two-year and 10-year Treasury yields were lower by 4.1 basis-points and 7.5 basis-points respectively, overall dragging the US dollar to its two-week low while supporting a 1% jump in gold prices.

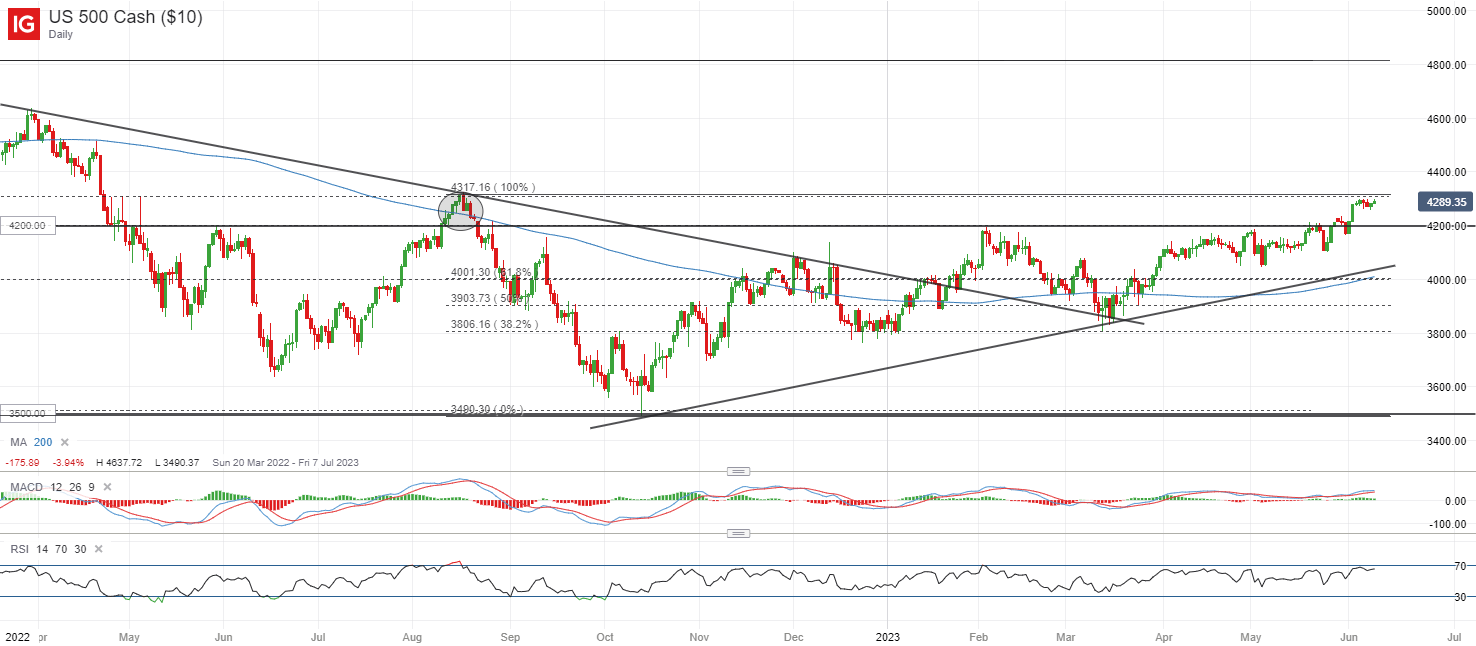
The quiet front on the economic schedule today may lead to a drift in Wall Street in the lead-up to the US Consumer Price Index (CPI) and the FOMC meeting outcome next week, which will be key catalysts to dictate whether the S&P 500 can deliver a break above its 4,320 level of resistance. For now, the CNN Fear and Greed Index has reflected market sentiments in “extreme greed” territory for the first time in four months. Previous two instances where the index touches this territory in December 2022 and February 2023, the S&P 500 forms a near-term top shortly thereafter. While it may not necessarily play out this time round, it suggests that risks may be considerably higher and a buy-on-retracement approach may be the preferred option.

image1.png

Asian stocks look set for a positive open, with Nikkei +1.62%, ASX +0.26% and KOSPI +0.43% at the time of writing, tracking the renewed gains in Wall Street overnight. The economic calendar today will place market focus on China’s inflation figures, which are expected to reinforce a low-for-longer growth outlook but could be seen as an added justification for more support stimulus from Chinese authorities.

Current consensus is for a subdued 0.3% rise in its headline consumer prices (previous 0.1%) as a reflection of still-soft demand, while producer prices is expected to decline for the eighth consecutive month (consensus -4.3% versus previous -3.6%).

Any higher-than-expected read may provide a much-needed positive surprise by pointing to stronger consumer demand but with the China’s Citi economic surprise index trending in negative territory for the first time since its reopening efforts in January this year, a clear trend of economic resilience will be what investors may want to see to support greater conviction for Chinese equities.

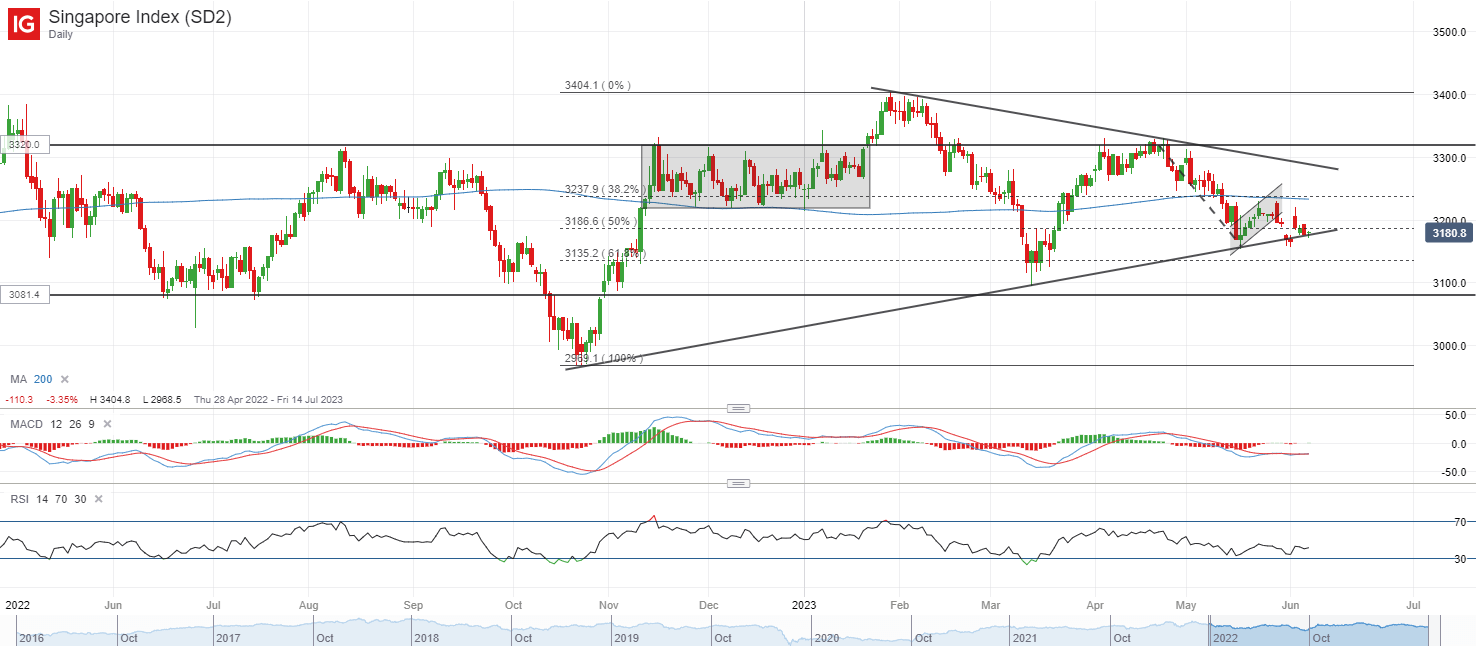
Closer to home, the Straits Times Index has been attempting to defend a key upward trendline support at the 3,180 level but intermittent bounces thus far have been short-lived as a reflection of strong selling pressures. A bearish flag formation since April this year remains in place and should the trendline support fail to hold ahead, a retest of its year-to-date bottom may be in sight. On any upside, the index will have to face a test of resistance confluence around the 3,220 level, where a previous support-turned-resistance stands alongside its 200-day moving average (MA).

image2.png

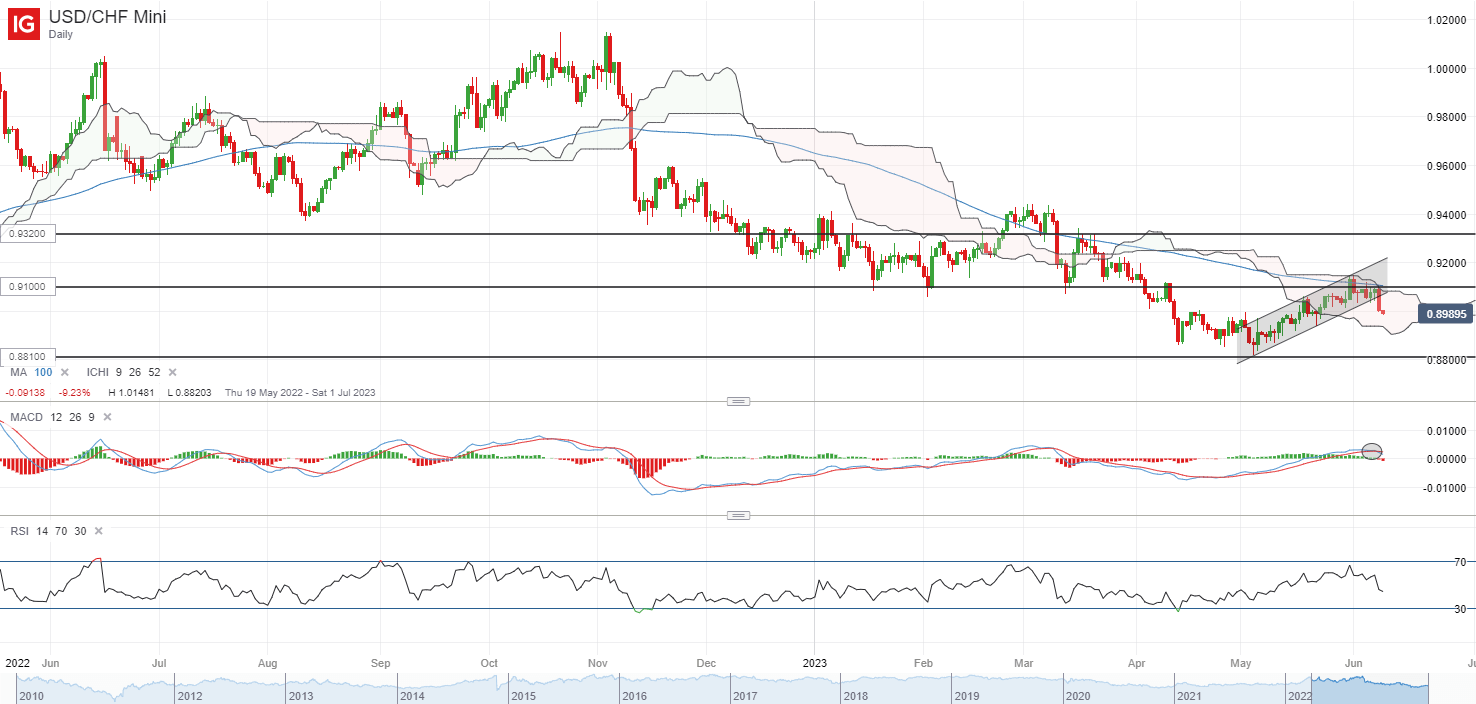
The USD/CHF has given back all of its past two weeks’ gains with a 1.2% dive overnight, following another failed attempt in overcoming the upper edge of its Ichimoku cloud on the daily chart. A more-than-expected rise in US initial jobless claim figure puts an overnight drag on the US dollar (-0.7%) while on the other hand, a highlight on inflation persistence by Swiss National Bank (SNB) Chairman Thomas Jordan suggests that its central bank’s policy may diverge with additional hikes being priced over the two meetings.

The confluence of both events saw a downward break of a near-term rising channel pattern for the USD/CHF, with a bearish crossover displayed on moving average convergence divergence (MACD). Near-term, the 0.910 level will be a key resistance level to overcome, where a move above the Ichimoku cloud resistance may support a move to retest the 0.922 level next. For now, selling pressures remain dominant, with further downside potentially leaving its May 2023 bottom on watch.

image3.png