Japanese Yen Drops After FOMC: Price Setups in USD/JPY, AUD/JPY, GBP/JPY

Japanese Yen Drops After FOMC: Price Setups in USD/JPY, AUD/JPY, GBP/JPY

Higher for longer US interest rates, broadly improving risk appetite, and the surprise interest rate hikes last week by the Reserve Bank of Australia and the Bank of Canada reinforce the broader bearish setup for the low-yielding Japanese yen against some of its peers.

To be sure, the recent yen’s weakness continues to be more pronounced against currencies where central banks are in rate hiking mode, including the RBA, BOC, BOE, and ECB, but less so central banks have paused (Fed) or where central banks have indicated that rates are at a peak (NZD). For more discussion see “Making Sense of Japanese Yen’s Recent Slide: Is it the Start of a Renewed Leg Lower?”, published June 1, and “Japanese Yen Week Ahead as Fed Skip Bets Grow: USD/JPY, EUR/JPY, AUD/JPY”, published June 5.

The US Federal Reserve kept interest rates unchanged on Wednesday but indicated that the hiking cycle is not over and that rates may need to rise by as much as 50 basis points on slower-than-expected moderation in inflation and resilience of the US economy. Key focus now shifts to the Bank of Japan’s meeting on Friday – the Japanese central bank is expected to reaffirm the bearish bias for JPY by maintaining its ultra-loose monetary policy along with no changes to the yield-curve control policy.

The BoJ Governor Kazuo Ueda has reiterated the central bank will patiently maintain the easy monetary policy as there is some distance to sustainably achieving its 2% inflation target. Data released last week showed Japan’s economy grew more than expected in the January-March quarter, supported by domestic spending and a buildup in inventories.

USD/JPY Daily Chart

image1.png

USD/JPY: Running into crucial resistance

USD/JPY is once again retesting a stiff converged resistance: the upper edge of a rising channel from early 2023, coinciding with the end-2022 high of 142.25. Above the area, there is another hurdle on the median line of a pitchfork channel from January (at about 143.75). There is no sign of a reversal of the uptrend, and the rebound this month from crucial support at the March high of 137.90 points to upside risks for USD/JPY. The pair would need to break below the early-June low of 138.50 for the bullish pressure to fade.

AUD/JPY Daily Chart

image2.png

AUD/JPY: Cracks above a key ceiling

AUD/JPY has broken above a tough converged barrier on the 200-day moving average, coinciding with the February high of 93.00. The break has taken place on strong momentum, suggesting that the rally may have legs, potentially toward 96.50, the price objective of the rising channel since April.

GBP/JPY Daily Chart

image3.png

GBP/JPY: Shifts to a higher gear

GBP/JPY’s break above the median line of a pitchfork channel since February indicates the cross has shifted to a higher gear. The median line had served as stiff resistance in recent weeks and the break above reflects an acceleration in gains. Having said that, the cross is looking overbought pointing to some consolidation/minor retreat in the near term. The next resistance is on the upper edge of the channel (now at about 181.75).

Crude Oil Prices Stifled by Chinese Economic Data & Stronger USD

Crude Oil Prices Stifled by Chinese Economic Data & Stronger USD

CRUDE OIL FUNDAMENTAL BACKDROP

Crude oil remains relatively depressed this Thursday morning after a drop yesterday post-FOMC. The Federal Reserve decided to keep rates on hold; however, central bank guidance was rather hawkish considering the lead up to the announcement was on the bearish side after US CPI and PPI data showed slowing inflationary pressures. The revised dot plot now reflects two further rate hikes for the year but money markets are yet to price this in (refer to table below) with possibly one additional rate hike expected. Incoming data will be required for further clarity around the stat of the US economy.

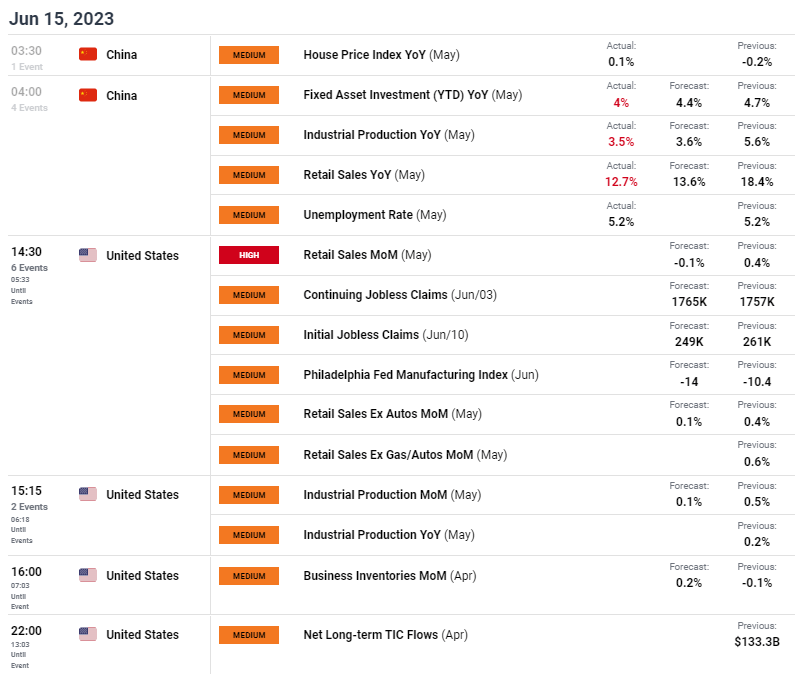
This morning began with the world’s second largest consumer of crude oil (China) releasing key demand-side data including industrial production and retail sales (see economic calendar below). Both metrics missed estimates and heightened fears around a slowing Chinese economy and subsequently less overall demand for crude oil. Similar sentiments could be echoed should US retail sales later today come in lower as expected. That being said, the USD may slip should this come in line or miss estimates potentially providing some support for crude oil prices. Jobless claims data will also be in focus after recent labor data exhibited a slight unwind of the recent very tight and robust environment.

ECONOMIC CALENDAR (GMT +02:00)

image2.png

TECHNICAL ANALYSIS

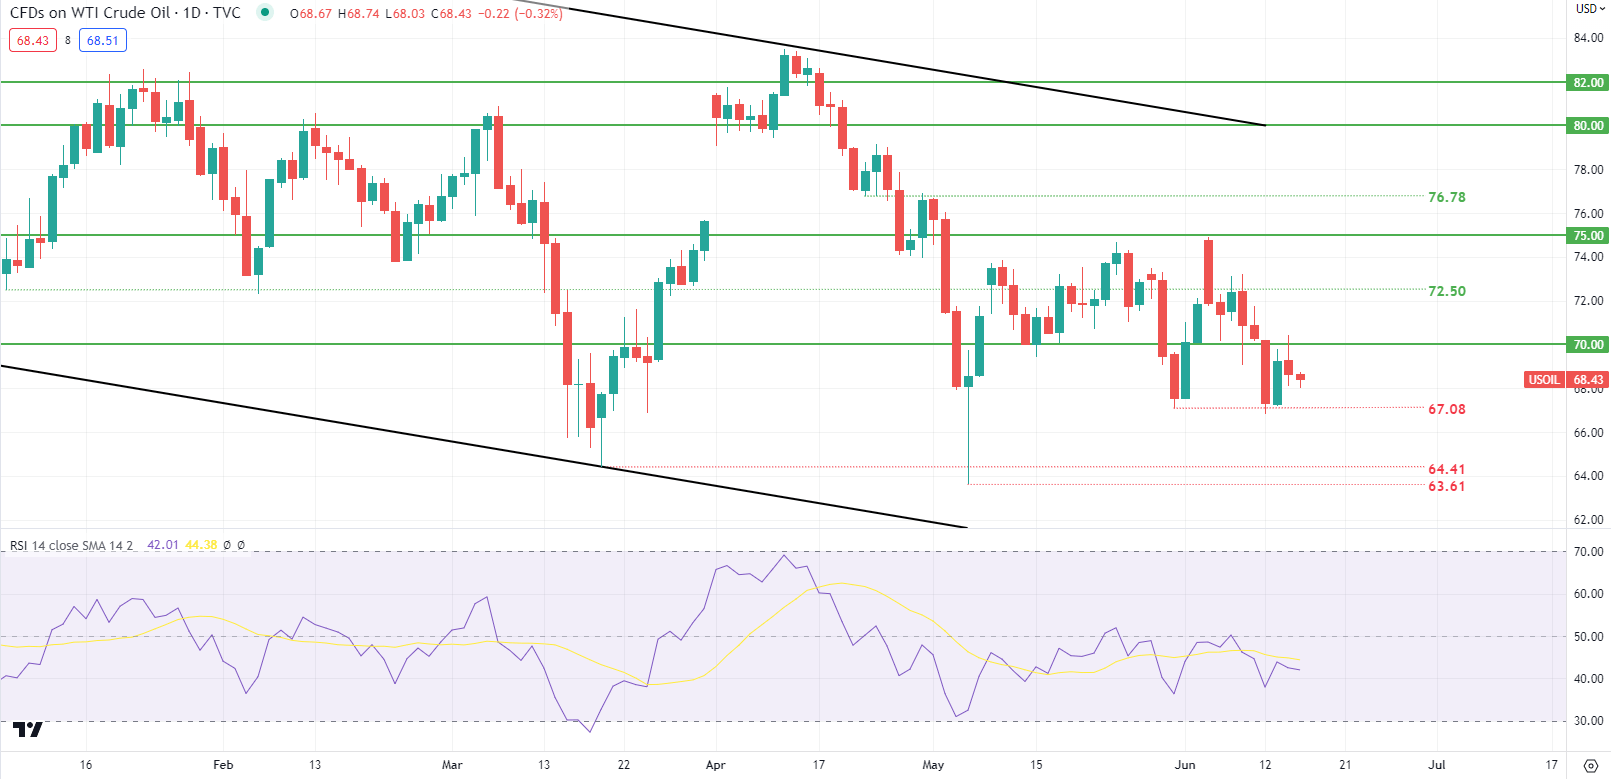
WTI CRUDE OIL DAILY CHART

image3.png

Price action on the daily WTI crude chart above shows prices below the 70.00 psychological handle but firm support has been shown around the 67.08 swing low. Another test could weaken the structure and see bears breakout and test subsequent support zones.

Key resistance levels:

  • $72.50
  • $70.00

Key support levels:

  • $67.08
  • $64.41
  • $63.61

IG CLIENT SENTIMENT: MIXED

IGCS shows retail traders are NET LONG on Crude Oil, with 85% of traders currently holding long positions (as of this writing). At DailyFX we typically take a contrarian view to crowd sentiment; however, due to recent changes in long and short positioning we arrive at a short-term cautious disposition.

Bitcoin & Ethereum Slide as Fed Signals Higher Rates: BTC/USD & ETH/USD Price Setups

Bitcoin & Ethereum Slide as Fed Signals Higher Rates: BTC/USD & ETH/USD Price Setups

Bitcoin and Ethereum have broken below key support after the US Federal Reserve left interest unchanged on Wednesday but signaled higher interest rates by the end of this year.

At the press conference following the two-day FOMC meeting, Fed Chair Jerome Powell said he doesn’t see a rate cut until inflation comes down meaningfully and significantly, which could take a couple of years. Moreover, the Fed’s June dot plot, an outlook for rate policy, indicated additional interest rate hikes are in the pipeline.

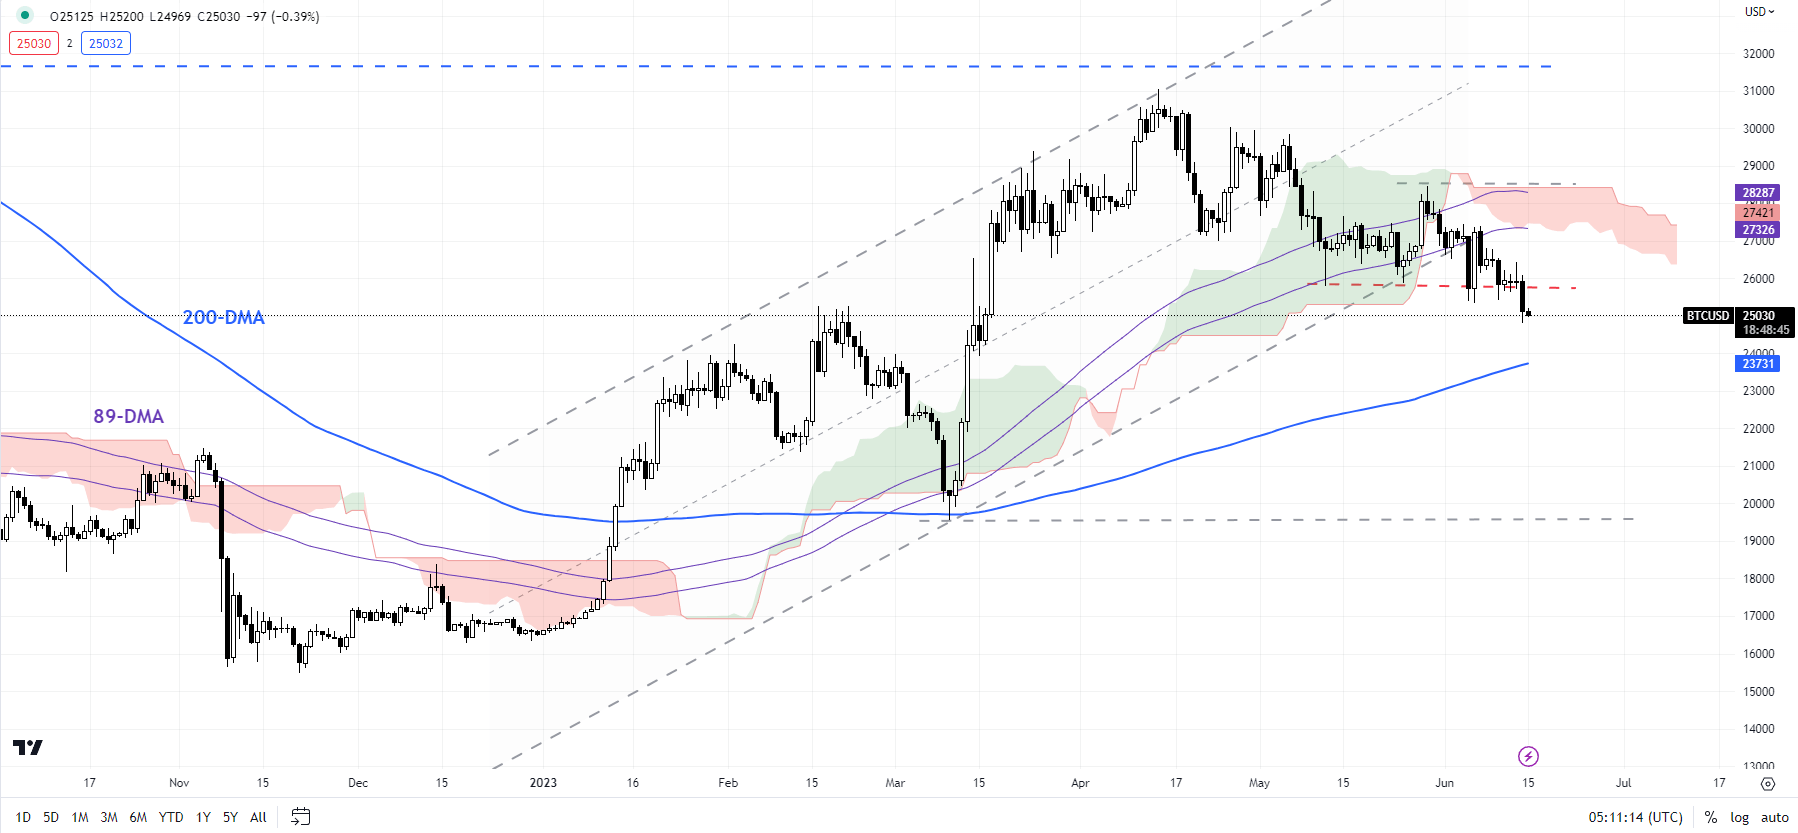
BTC/USD Daily Chart

image1.png

BITCOIN: Cracks below support

BTC/USD’s fall below the mid-May low of 25785 has opened the door initially toward the 200-day moving average (now at about 23700). There is major support at the March low of 19540 – this support needs to give way for the medium-term downtrend to resume. This follows a failure to regain the 30000 mark in May, accentuating downside risks – highlighted early-May “Bitcoin & Ethereum Price Action: Is the Rally Over?” published May 8, and “Bitcoin & Ethereum Week Ahead: Cracks in the Rally?”, published May 15.

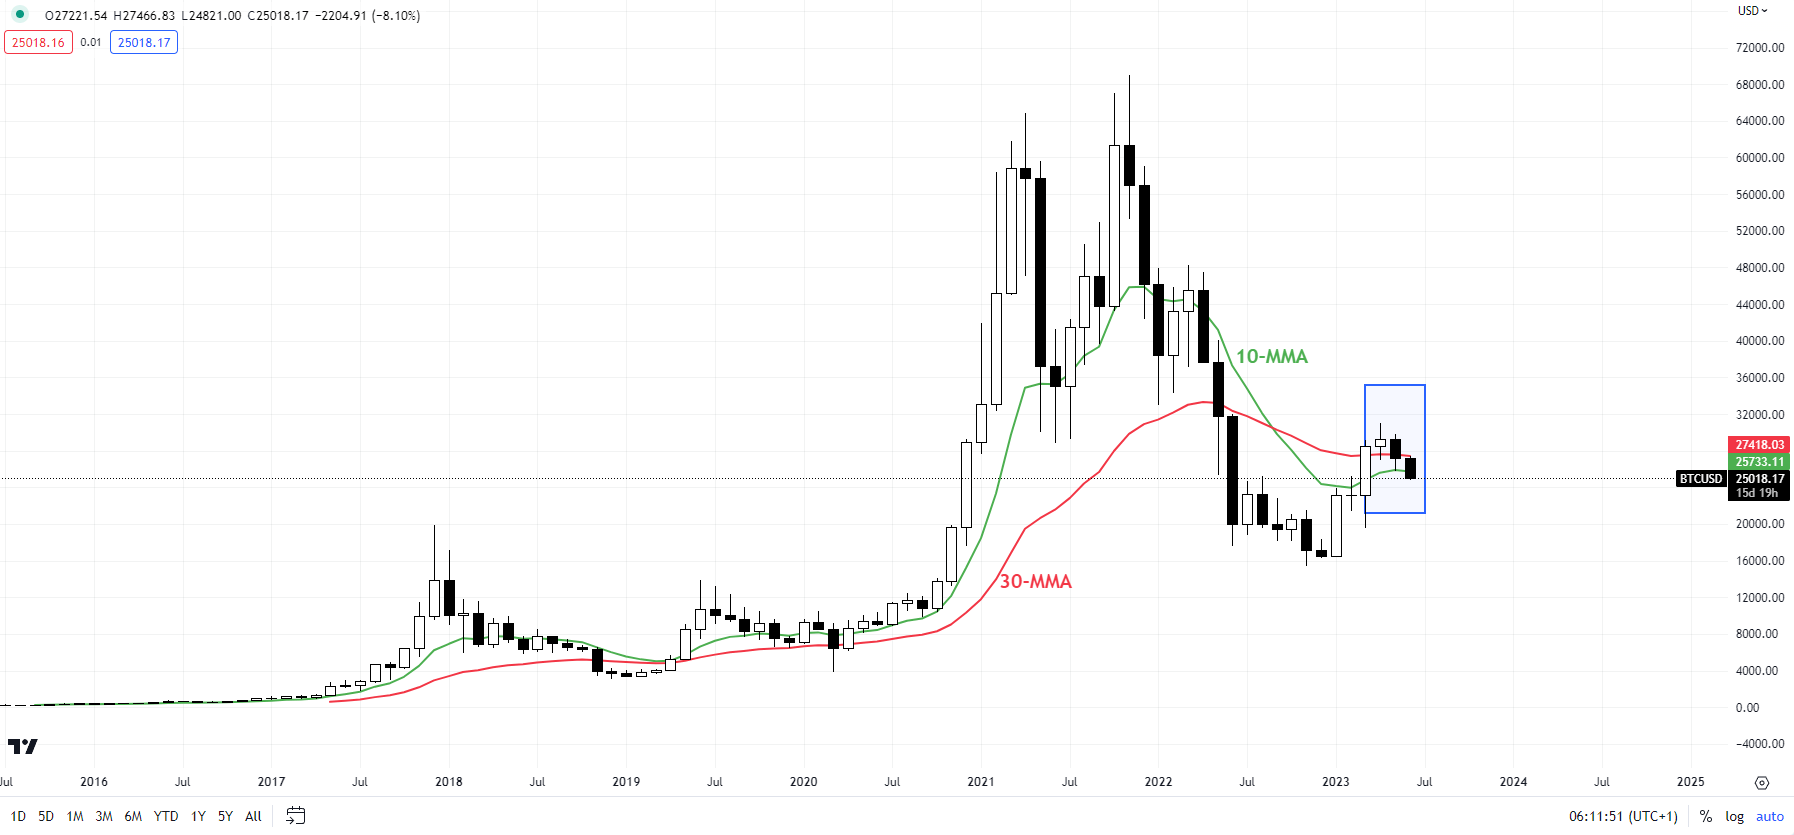
BTC/USD Monthly Chart

image2.png

In recent weeks, BTC/USD has struggled to hold above quite strong converged support around 25300-26000 (including the 89-day moving average and February 2023 high). The rebound at the end of May lacked momentum — see “Bitcoin & Ethereum Week Ahead: Upside Capped for Now?”, published May 30.

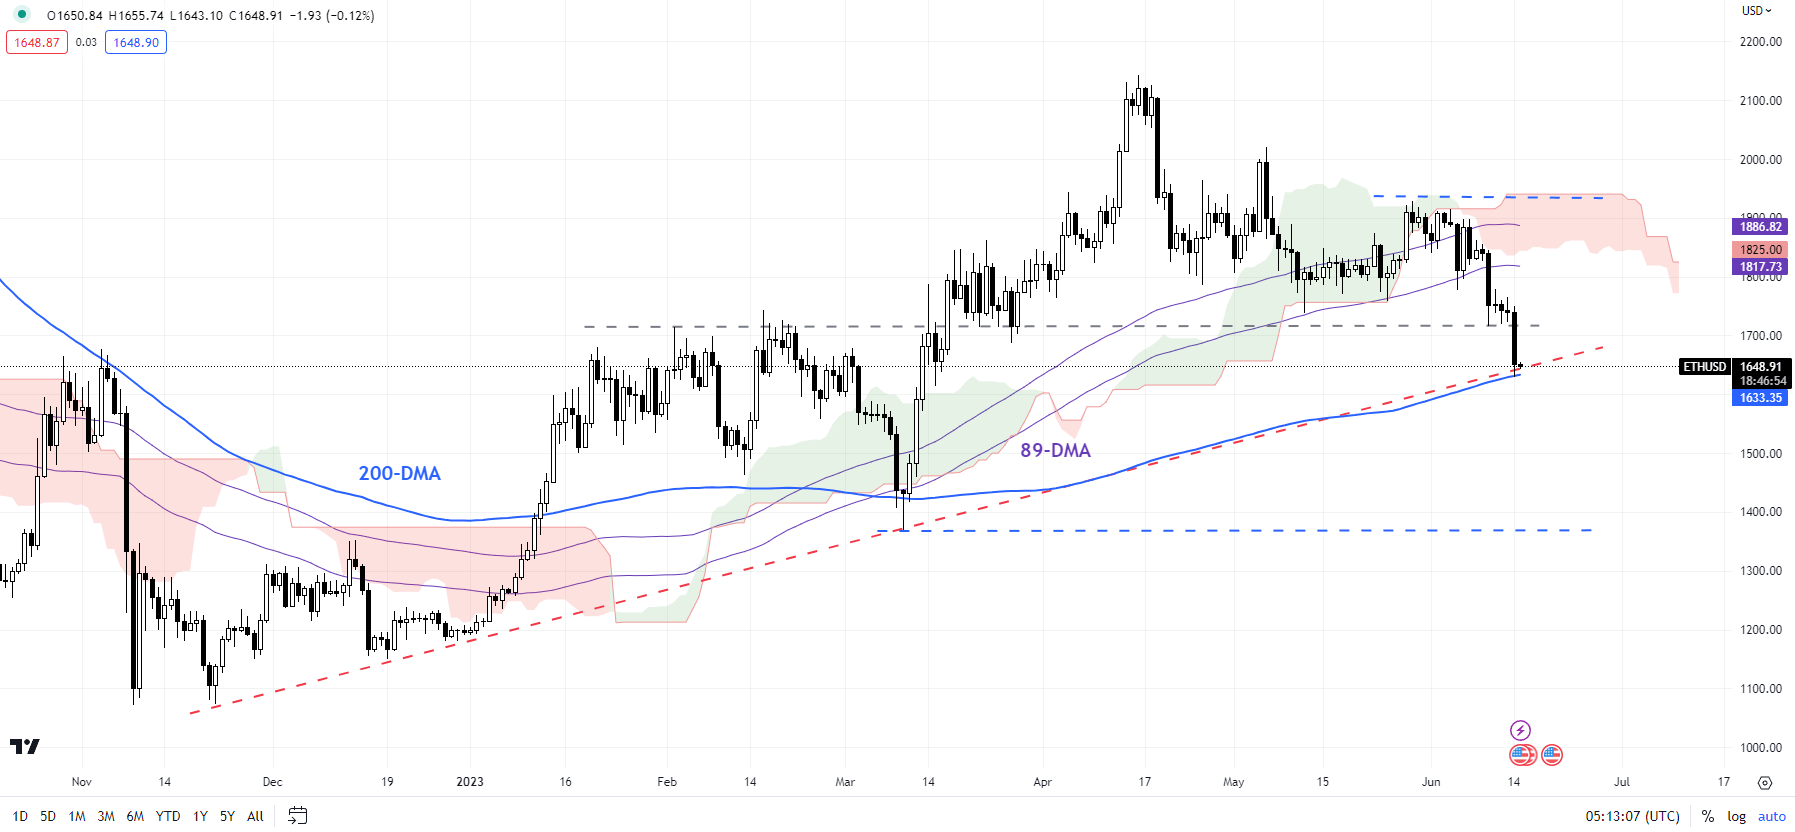
ETH/USD Daily Chart

image3.png

ETHEREUM: Upward pressure has faded

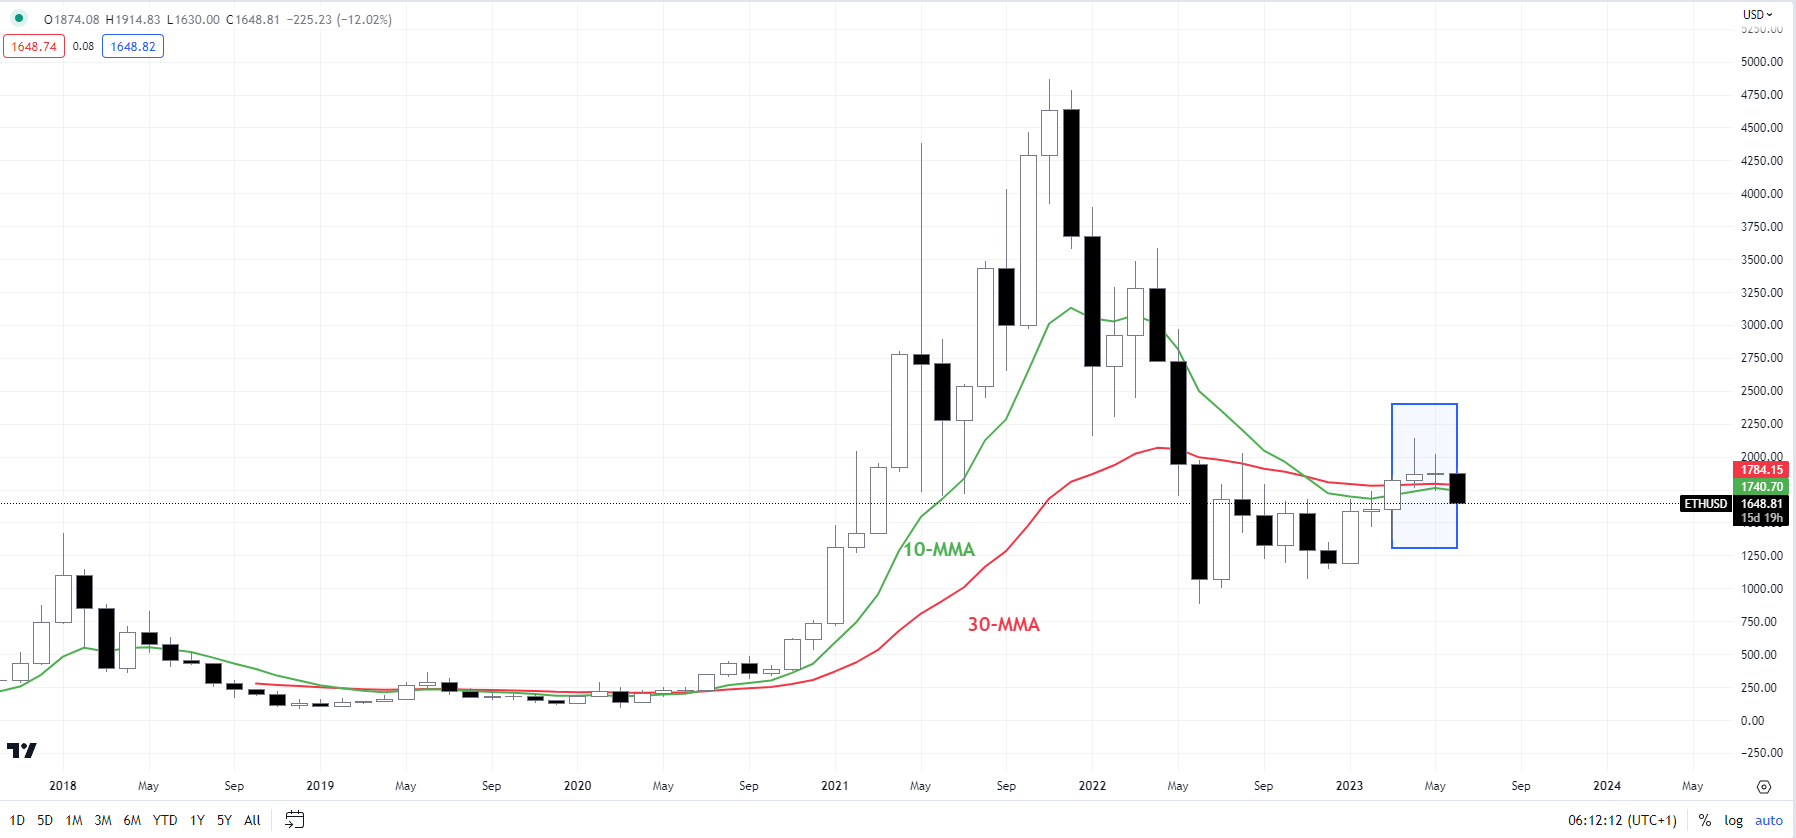
ETH/USD’s failure to reach the May 6 high of 2019 and the subsequent fall below the crucial cushion at the February highs of 1710-1740 (including the 89-day moving average) has confirmed that the bullish pressure has faded. Ethereum is now testing a vital floor on the 200-day moving average (now at 1630). A failure to hold above the long-term moving average could expose the downside toward major support at the March low of 1368.

ETH/USD Monthly Chart

image4.png


How to use the PPI in Forex Trading

How to use the PPI in Forex Trading

Using PPI to trade forex: Talking points

  • PPI stands for the Producer Price Index, which is an important piece of economic data
  • PPI data is released during the second week of each month.
  • Forex traders can use PPI as a leading indicator to forecast consumer inflation measured by the Consumer Price Index (CPI).

PPI is an important piece of economic data due to its signaling effect on future expected inflation. Traders monitor PPI in forex trading because of the positive relationship between inflation and interest rates, but ultimately, traders are concerned with how the resultant interest rate changes are likely to affect currency pairs. Continue reading to learn more about the PPI index and how it affects the foreign exchange market.

What is PPI and what does it measure?

PPI stands for Producer Price Index and measures the change in the price of finished goods and services sold by producers. PPI data represents the monthly change in the average price of a basket of goods purchased by manufacturers.

How is PPI calculated?

PPI examines three production areas; commodity-based, industrial-based, and stage-of-processing-based companies. Released by the Bureau of Labor Statistics, PPI is created using data collected from a mailed survey of retailers selected via a process of systematic sampling of all firms listed with the Unemployment Insurance System.

Traders can see changes in PPI expressed as a percentage change from the previous year, or on a month to month basis.

PPI and inflation

A positive change in the PPI index implies that costs are rising and, in the end, price increases get passed down to consumers. If this effect is large enough, there will be an increase in future CPI figures to reflect that the general level of prices has increased.

PPI is a leading indicator of inflation

Inflation and the effect on the economy

An increase in the general price level is good for an economy but only when this is contained. When demand for goods and services increases, businesses must increase capital expenditure and hire more workers in order to increase their output to meet higher demand. The problem arises when prices increase drastically, resulting in a decrease in the purchasing power of a country’s currency. $1 can buy less than it could one year ago, for example.

In the 1950s, gasoline was $0.27, while apartment rent was $42/month and a movie ticket was $0.48. These figures are nowhere near to where they are today, and this reflects how inflation erodes the value of local currency. In an attempt to combat the erosion of purchasing power, central banks effectively reduce inflation by raising the benchmark interest rate.

How does PPI impact currencies?

When it comes to money there is always a trade-off: individuals can save money and earn interest, or they can spend money immediately and forgo any interest payments.

If PPI is on the rise it may cause the interest rates to rise. When interest rates go up, electing to save money looks more attractive as the reward (interest) is greater than before. Spending money becomes costlier because consumers would effectively be losing out on the higher interest rate when they choose to spend money instead of saving. As a result, increased PPI may filter down into increased rates and a stronger currency.

Using the Euro as an example, forex traders know that higher interest rates results in increased financial flows by foreign investors wanting to buy the higher yielding Euro. This effect tends to drive the value of the Euro up as the demand for the Euro has increased.

A popular strategy chasing higher interest rates is the “carry trade” strategy; whereby traders borrow funds in a currency that has a low interest rate and buy a currency with a higher interest rate.

Money follows yield and traders will look to take advantage of this.

Learn more about how interest rates affect forex.

How PPI affects the US dollar

The Producer Price Index tends to have little effect on the US dollar initially. This is because in the real economy there is a time lag between the increase in prices from producers, and the end result of higher inflation resulting from consumers having to fork out more at the tills.

DailyFX economic calendar showing Producer Price Index (PPI)

However, don’t be misled by the “low priority” impact assessment of this data release. Astute traders are able to forecast the knock-on effects PPI is likely to have on CPI and interest rates and trade accordingly. Thus, the most valuable component of the PPI data is the signaling effect it provides to the market.

Federal Reserve is likely to skip a rate hike at pivotal meeting Wednesday yet signal more to come

Federal Reserve is likely to skip a rate hike at pivotal meeting Wednesday yet signal more to come

The Federal Reserve, having raised interest rates at the fastest pace in four decades, is poised Wednesday to leave rates alone for the first time in 15 months to allow time to gauge the impact of its aggressive drive to tame inflation.

Yet top Fed officials have made clear that any such pause may be brief — more of a “skip” — with another rate hike likely as soon as their next meeting in late July.

Fed Chair Jerome Powell and other top policymakers have also indicated that they want to assess how much a pullback in bank lending might be weakening the economy. Banks have been slowing their lending — and demand for loans has fallen — as interest rates have risen.

Some analysts have expressed concern that the collapse of three large banks last spring could cause nervous lenders to sharply tighten their loan qualifications and worsen the drop in lending. Economists at Goldman Sachs have estimated, though, that such damage will be modest.

For the Fed, “skipping” a rate hike at this week’s meeting may be the most effective way for Powell to unite a fractious policymaking committee. The 18 committee members appear split between those who favor one or two more rate hikes and those who would like to leave the Fed’s key rate where it is for at least a few months and see whether inflation further moderates. This group is concerned that hiking too aggressively would heighten the risk of causing a deep recession.

A government report Tuesday on inflation offered some ammunition to both camps, with overall price increases sharply slowing but some measures of underlying inflation remaining high. Consumer prices as a whole rose a modest 4% in May from 12 months earlier, the smallest such rise in more than two years and way below April’s 4.9% annual increase.

Yet much of that drop reflected sharply lower gas prices and slowdown in food inflation. Excluding volatile food and energy costs, uncomfortably high inflation persisted: So-called core prices rose 5.3% year over year, down from 5.5% in April but far above the Fed’s 2% annual target.

At the same time, the gradual but steady decline in overall inflation suggests that the Fed’s rate hikes have had some success. The central bank has jacked up its key rate by a substantial 5 percentage points since March 2022.

Those hikes have led to much higher costs for mortgages, auto loans, credit cards and business borrowing. The Fed’s goal is to achieve the delicate task of slowing borrowing and spending enough to cool growth and tame inflation, without derailing the economy in the process.

Tuesday’s inflation data showed that most of the rise in core prices reflected high rents and used car prices. Those costs are expected to ease later this year.

Wholesale used car prices, for example, fell in May, raising the prospect that retail prices will follow suit. And rents are expected to ease in the coming months as new leases are signed with milder price increases. Those lower prices, though, will take time to feed into the government’s measure.

Some economists have suggested that if those measures start to fall and reduce core inflation, the Fed might end up keeping its key rate unchanged for the rest of the year. Or the policymakers might decide to raise their key rate one last time in July, to about 5.4%, and keep it there.

“We think next month’s increase is probably the last of the cycle,” said Alan Detmeister, an economist at UBS.

On Wednesday, Fed officials will also update their quarterly economic projections, including a forecast of what their key rate will be at year’s end. Most economists expect that rate to tick up from the current 5.1% to 5.4%. That would signal that the central bank doesn’t think it has yet curbed inflation. If inflation were to remain chronically high in the months ahead, the Fed might decide to continuing raising rates.

The economy has fared better than the central bank and most economists had expected at the beginning of the year. Companies are still hiring at a robust pace, which has helped encourage many people to keep spending, particularly on travel, dining out and entertainment.

As a result, the Fed’s updated forecasts Wednesday may reflect its expectation that economic growth will pick up, albeit modestly. Analysts say the policymakers will likely project that the economy will expand 1% this year — a sluggish figure but up from a forecast in March of an anemic 0.4%.

Fed officials will also likely forecast a lower unemployment rate than they did three months ago, perhaps to 4.1% by year’s send, compared with their forecast in March of 4.5%. (The current jobless rate is 3.7%.)

In addition, they will likely raise their inflation estimate, with year-over-year core inflation envisioned to reach 3.8% by the end of this year, up from a forecast of 3.6% in March.

China Will Lose the Most Millionaires of Any Country This Year: Report

China Will Lose the Most Millionaires of Any Country This Year: Report

The country will lose 13,500 high-net-worth individuals (HNWI) with investable wealth exceeding $1 million in 2023, according to the report compiled by Henley & Partners released Tuesday. The country expected to see the second most departures of HNWIs was India, with an anticipated exodus of 6,500, followed by the U.K. in third with 3,200.

President Xi Jinping’s recent “common prosperity” crackdowns may be the motivation behind the expatriation of entrepreneurs in China. A senior China economic official late last year explained that the term meant “expanding the pie and dividing the pie,” and he emphasized that the government “will not ‘kill the rich to help the poor.’” Nevertheless, the wealthy have been flocking to Singapore or setting up backup plans, according to Bloomberg.

“General wealth growth in China has been slowing over the past few years, which means that the recent outflows could be more damaging than usual,” Andrew Amoils, head of research at wealth intelligence firm New World Wealth, said in the report. He added that while the country has seen its economy show substantial growth from 2000 to 2017, that expansion has not been accompanied by an increase in wealthy people.

China’s prolonged Covid restrictions have also been cited as a potential reason for wealthy people leaving the country. Dropping its zero-Covid policy appears to have caused notable benefits for China’s economy; the luxury industry has seen sales increase faster than the country’s overall economy.

According to the new wealth migration report, America’s draw for the wealthy is also weakening. It is less popular to migrating millionaires than it was before Covid due to potential higher taxes. The U.S. is set to maintain a net gain of HNWIs, with an influx of 2,100 this year. Though that’s a net plus, it’s a significantly smaller figure than in 2019, when the country saw an influx of 10,800 HNWIs.

EUR/GBP: Move below 0.8540 suppor to open up pre-Mini-Budget crisis levels – ING

EUR/GBP: Move below 0.8540 suppor to open up pre-Mini-Budget crisis levels – ING

EUR/GBP is pressing lower again. Economists at ING analyze the pair’s outlook.

Hard to buck the Sterling bullish trend

A move below the 0.8540 support would set the EUR/GBP pair back to pre-Mini-Budget crisis levels (August 2022).

The latest evidence from employment and wage growth has prompted yet another repricing higher in BoE rate expectations, with 132 bps of tightening priced in by year-end.

With short-dated gilts reaching their highest levels since 2008 yesterday, it remains hard to buck the EUR/GBP bearish trend, especially ahead of the ECB risk event, but our medium-term view remains bullish on the pair.

Resilient UK GDP Report Keeps Pound Afloat, Gilt Yields in Focus

Resilient UK GDP Report Keeps Pound Afloat, Gilt Yields in Focus

UK GDP IS POSITIVE AT SURFACE LEVEL

The British pound back in the picture once more this morning with UK GDP being the focal point for traders. Cable is trading relatively flat after yesterday’s positive close due to UK GDP releasing in line with expectations on most metrics (see economic calendar below). Highlights include:

In summary, the report is a net positive short-term for GBP with some shortcomings from the industrial and manufacturing sectors. Looking at the overall picture, it seems UK growth is stagnating somewhat and could be cause for concern later on. Chancellor of the Exchequer Jeremy Hunt responded to the robust UK economic data by stating that “high growth needs low inflation and we must stick relentlessly to our plan to halve rate this year.” Similar sentiments about inflation were emphasized yesterday via the Bank of England (BoE) Governor Andrew Bailey and Dhingra respectively.

UK ECONOMIC CALENDAR (GMT +02:00)

image1.png

A drastic change in BoE rate hike expectations post-jobs data yesterday now has the peak rate for 2023 up at almost 5.77% (refer to table below) from around 5.48% – roughly 30bps higher!

BANK OF ENGLAND INTEREST RATE PROBABILITIES

image2.png


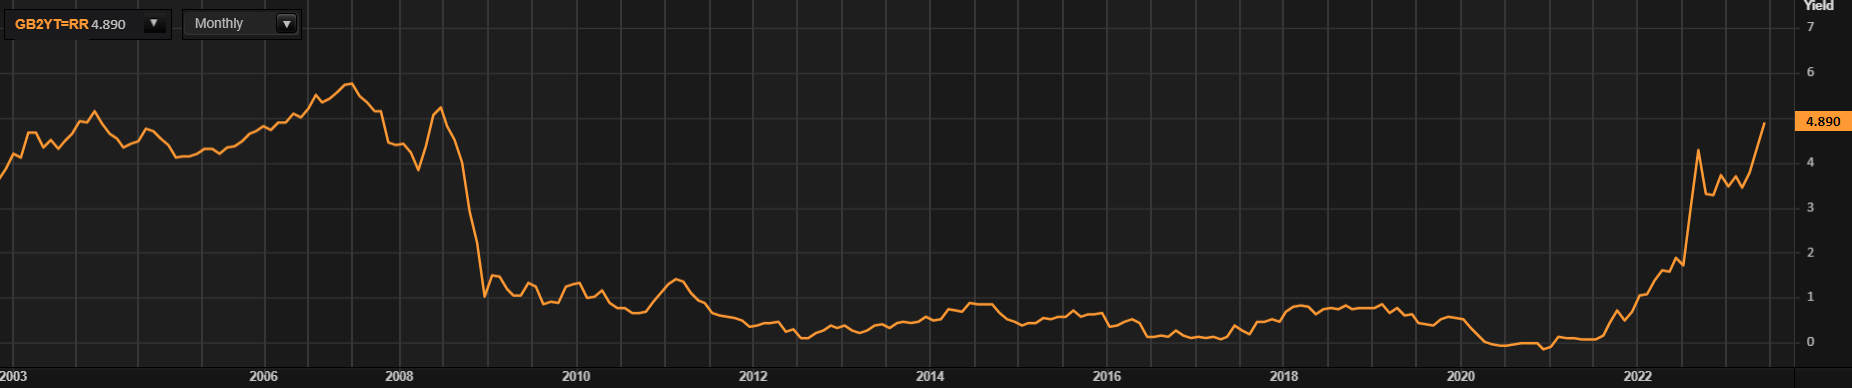
The UK 2-year gilt yield below now shows levels last seen in 2008 and well above the period surrounding former PM Liz Truss. This could bring back concerns around Defined Benefit (DB) pension schemes as the value of these pension schemes traditionally move inversely to gilt yields.

UK 2-YEAR GILT YIELD

image3.png

TECHNICAL ANALYSIS

GBP/USD DAILY CHART

image4.png

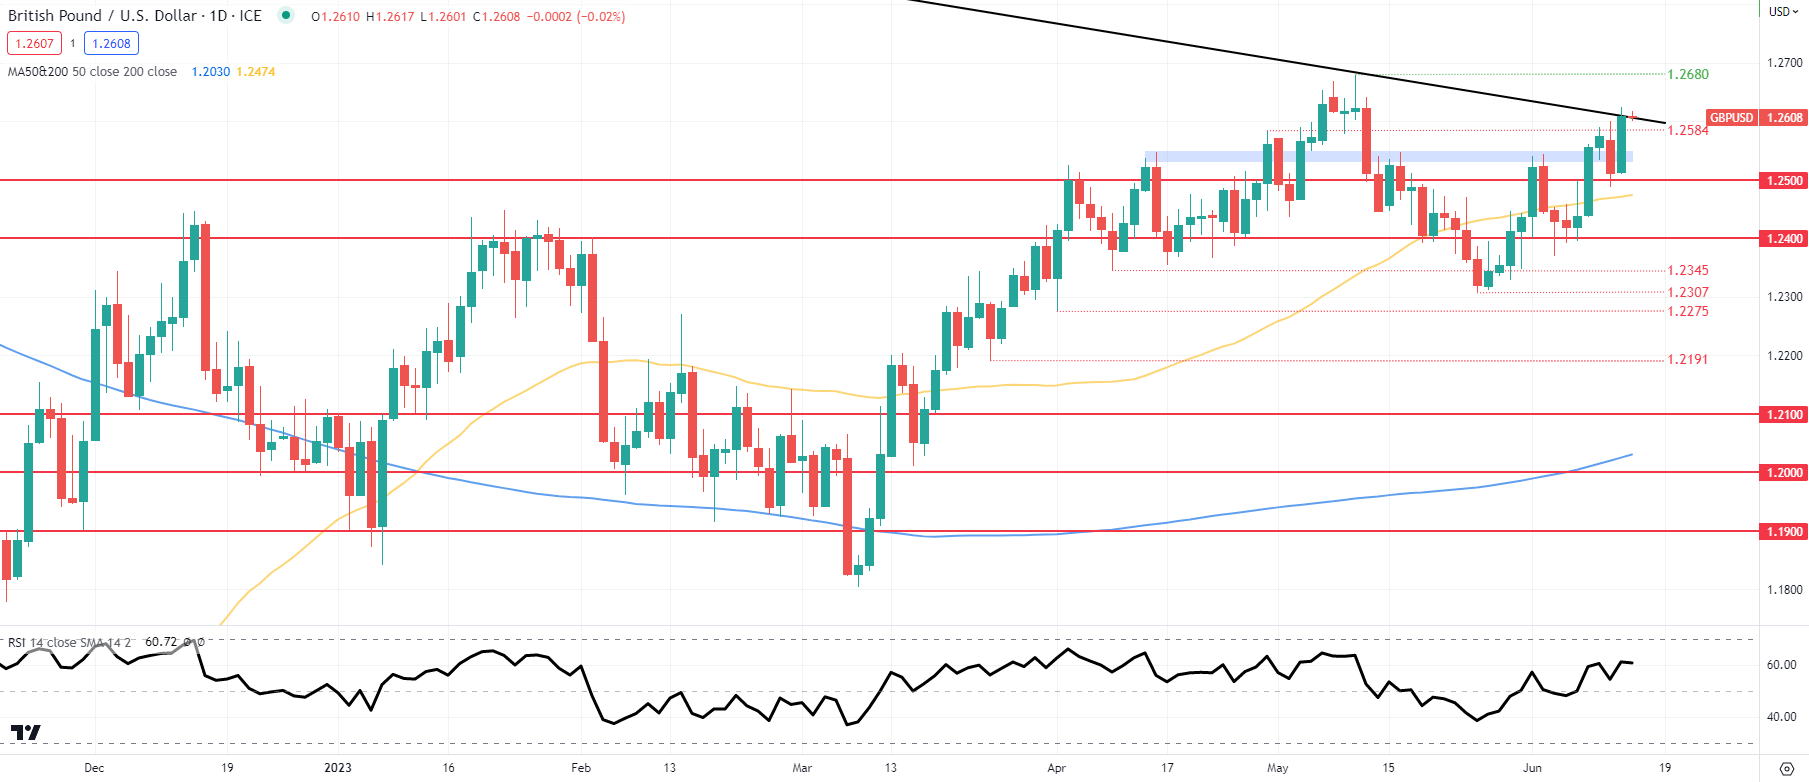
Price action on the daily cable chart shows sterling relatively flat this morning but still very much elevated. Attention will now shift over to the Federal Reserve and its interest rate announcement. Expectations are for the FOMC announcement to result in a pause/skip due to declining US CPI data yesterday thus reducing the interest rate differential between the two economies in favor of a stronger pound if the BoE sticks to current money market pricing.

GBP bulls are now testing the long-term trendline resistance zone (black) and a confirmation close above this key inflection point could spark an extended rally up towards the 1.2680 swing high.

Key resistance levels:

  • 1.2680
  • Trendline resistance

Key support levels:

  • 1.2584
  • 1.2500
  • 50-day MA (yellow)
  • 1.2400

BULLISH IG CLIENT SENTIMENT

IG Client Sentiment Data (IGCS) shows retail traders are currently net SHORT on GBP/USD with 63% of traders holding short positions (as of this writing). At DailyFX we typically take a contrarian view to crowd sentiment resulting in a short-term upside disposition.

GBP/USD rises above 1.2550 after UK employment data

GBP/USD rises above 1.2550 after UK employment data

GBP/USD extended its daily rebound beyond 1.2550 in the early European session on Tuesday. The data from the UK showed that wage inflation continued to run hot in May, providing a boost to Pound Sterling. Later in the day, US inflation data will be watched closely by investors.

1.2600 (psychological level, static level) aligns as immediate resistance for GBP/USD. The Relative Strength Index (RSI) indicator on the four-hour chart, however, stays in overbought territory slightly above 70, suggesting that the pair could correct lower before attempting to clear that hurdle.

On the downside, 1.2550 (static level) could be seen as first technical support before 1.2520 (Fibonacci 61.8% retracement) of the latest downtrend). A daily close below the latter could attract bears and cause GBP/USD to stretch lower to 1.2480 (200-period Simple Moving Average (SMA)).

In case GBP/USD rises above 1.2600 and confirms that level as support, next bullish target could be set at 1.2650 (static level, beginning point of the downtrend).

GBP/USD took advantage of the broad US Dollar (USD) weakness on Monday and climbed to its highest level in a month above 1.2590. The pair faces next resistance at 1.2600 and the near-term technical outlook suggests that there could be a downward correction before the next leg higher.

The upbeat market mood at the beginning of the week doesn’t allow the safe-haven USD to stay resilient against its main competitors, helping GBP/USD to stay afloat in positive territory. The UK’s FTSE 100 Index rises 0.3% and US stock index futures gain between 0.1% and 0.3% in the European session.

Earlier in the day, Bank of England (BoE) policymaker Jonathan Haskel’s hawkish comments also helped Pound Sterling gather strength. “My own view is that it’s important we continue to lean against the risks of inflation momentum, and therefore that further increases in interest rates cannot be ruled out,” Haskel wrote in an article published in The Scotsman newspaper.

On Tuesday, UK’s Office for National Statistics will release the labor market data. Annual wage inflation, as measured by Average Earnings Excluding Bonus, is forecast to rise to 6.9% in April from 6.7% in March. Markets are currently fully pricing in another 25 basis points (bps) Bank of England rate hike at the next policy meeting on June 22. Hence, a soft wage inflation could make it difficult for Pound Sterling to continue to outperform its rivals, while the positive impact of a stronger-than-forecast reading on the currency could remain short-lived.

May inflation data from the US and Bank of England Governor Andrew Bailey’s speech before the Lords Economic Affairs Committee hearing on Tuesday could also cause the pair to fluctuate wildly.

GBP/USD defends 1.2600 after UK data, Fed decision eyed

GBP/USD defends 1.2600 after UK data, Fed decision eyed

GBP/USD is defending 1.2600 after mixed UK GDP and Industrial Production data releases. The US Dollar steadies amid jittery markets, anticipating the Fed rate pause announcement following soft US inflation data.

GBP/USD lost more than 50 pips on Monday but gathered bullish momentum early Tuesday. The pair could stretch higher toward 1.2600 later in the day in case May inflation data from the US causes the US Dollar (USD) to stay under selling pressure.

In the absence of high-tier data releases on Monday, GBP/USD came under technical bearish pressure as markets reacted to overbought conditions.

Pound Sterling, however, attracted buyers in the European morning on Tuesday. Wage inflation in the UK, as measured by Average Earnings Excluding Bonus, climbed to 7.2% on a yearly basis in April from 6.8% in March, the Office for National Statistics reported. With this reading surpassing the market expectation of 6.9%, hawkish Bank of England (BoE) bets started to dominate the market action, providing a boost to GBP/USD. At the time of press, the 2-year UK gilt yield was up more than 10 basis points on the day at 4.75%.

In the second half of the day, the Consumer price Index (CPI) data for May will be watched closely by market participants ahead of the Federal Reserve’s policy announcements on Wednesday.

The monthly Core CPI, which excludes prices for volatile items and is not distorted by the base effect, is expected to rise 0.4% in May. With a smaller-than-forecast increase, markets could continue to price in a no change in the Fed’s policy rate and highlight the policy divergence between the Fed and the BoE, allowing GBP/USD to stretch higher. On the flip side, a reading at or above 0.5% should help the USD to turn resilient against its peers and cap GBP/USD’s upside