US Dollar Drips Lower Ahead of Key Fed Decision, Levels to Watch on DXY

US Dollar Drips Lower Ahead of Key Fed Decision, Levels to Watch on DXY

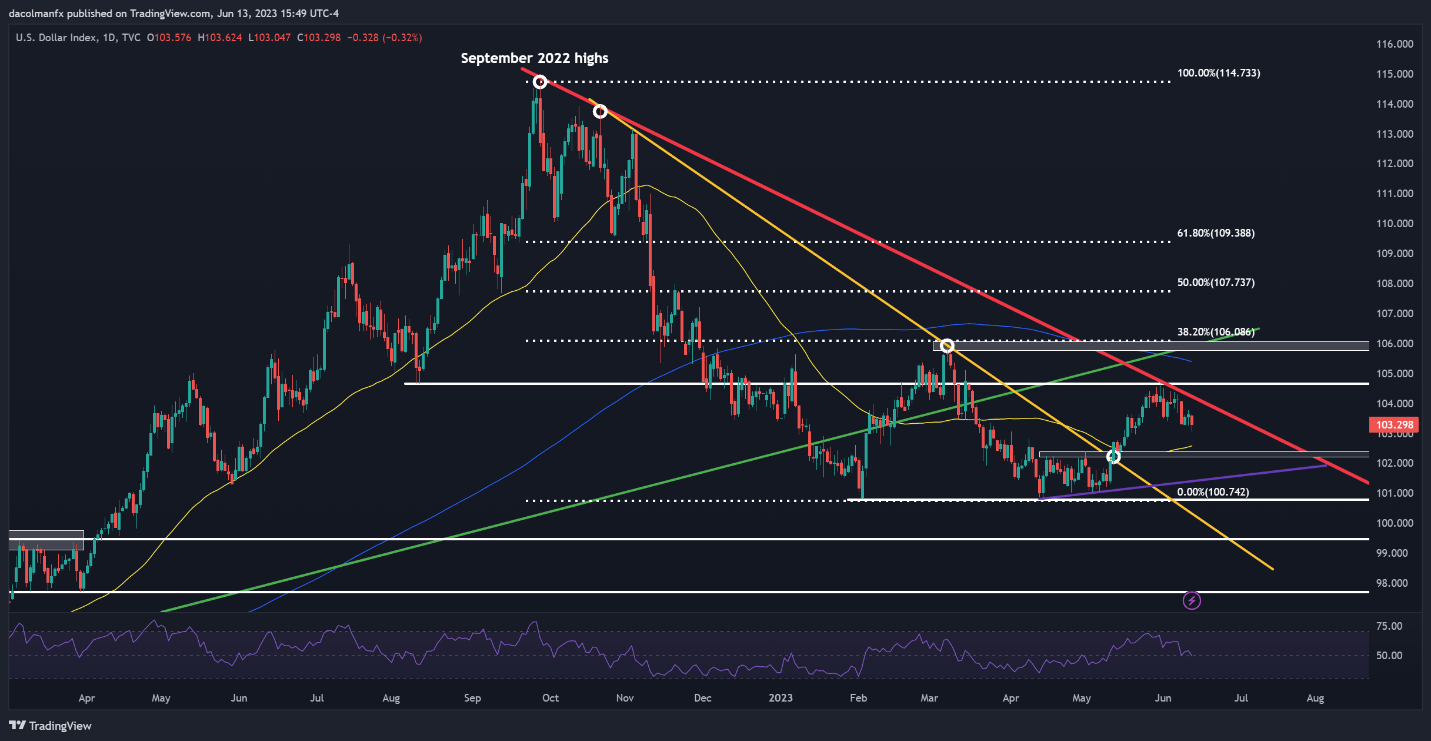
The U.S. dollar, as measured by the DXY index, weakened on Tuesday amid market caution ahead of Wednesday’s FOMC policy announcement. In late afternoon trading, the greenback gauge was down about 0.3% to 103.30, but was well off its session lows reached immediately after the U.S. CPI report crossed the wires.

U.S. economic data released in the morning, which showed a cooling of annual headline inflation to 4.0% in May, initially weighed on the U.S. currency by leading traders to fully discount a “pause” at this week’s Fed meeting. The kneejerk reaction in the FX space, however, faded quickly, as traders concluded the institution could resume hikes in July and keep rates higher for longer.

We will learn more about the outlook for monetary policy tomorrow when the US central bank unveils its June decision along with its updated summary of economic projections. That said, traders should pay close attention to the dot plot to find out how much additional tightening to expect and to see if policymakers intend to ease their posture next year.

Given the resilience of the U.S. economy and sticky core inflation, the dot plot could incorporate one or even two more 25 bp hikes for 2023 and possibly no rate cuts through 2024. This hawkish scenario is likely to skew short-dated nominal yields to the upside, sending the U.S. dollar sharply higher in the near term.

Conversely, if the Federal Reserve refrains from penciling in further rate rises compared to its March estimates and keeps the door open to a less restrictive stance in 2023, all bets are off. This outcome should be quite bearish for both yields and the U.S. dollar.

US DOLLAR TECHNICAL ANALYSIS

In terms of technical analysis, the U.S. dollar index has been moving lower since the beginning of the month after failing to push above medium-term trendline resistance in play since September of last year. That said, if the decline accelerates in the coming days and weeks, initial support stretches from 102.40 to 102.15. On further weakness, the attention will shift to 101.50.

On the other hand, if buyers regain control of the market and spark a bullish turnaround, the first ceiling to consider lies at the psychological 104.00 level (also trendline resistance). If this barrier is taken out decisively, we could see a move toward 104.70, followed by a possible retest of the 200-day simple moving average.

US DOLLAR (DXY) TECHNICAL CHART
A screen shot of a graph  Description automatically generated with low confidence


USD/CAD Bears Drool Over Trendline Break

USD/CAD Bears Drool Over Trendline Break

CANADIAN DOLLAR FUNDAMENTAL BACKDROP

The Canadian dollar has been benefiting from the divergence between the Bank of Canada (BoC) and Federal Reserve’s outlook on monetary policy – the BoC ‘hawkishly’ surprising last week while the Fed is likely to pause or ‘skip’ later this evening. Slightly higher crude oil prices have supplemented CAD strength against the USD today and should the Fed’s guidance be less aggressive than anticipated, the loonie may well rally further.

USD/CAD ECONOMIC CALENDAR (GMT +02:00)

image1.png

TECHNICAL ANALYSIS

USD/CAD DAILY CHART

image2.pngDaily USD/CAD price action is trading at a key area of confluence, around the long-term trendline support (black) and the 1.3300 psychological level respectively. While the trendline support was breached yesterday, bears failed to close below the 1.3300 handle which could be the catalyst that fuels a push lower. The recent downside move has been subsequent to the death cross (red) formation and although the pair is nearing oversold territory as measured by the Relative Strength Index (RSI), there is still room for further downside to come.

From a bullish perspective, a hawkish Fed announcement could invalidate the downside forecast and keep prices above trendline support exposing the 1.3407 swing low.

Key resistance levels:

  • 1.3407
  • Trendline support (black)

Key support levels:

  • 1.3300
  • 1.3263
  • 1.3226
  • 1.3200

IG CLIENT SENTIMENT DATA: MIXED

IGCS shows retail traders are currently LONG on USD/CAD , with 71% of traders currently holding long positions (as of this writing). At DailyFX we typically take a contrarian view to crowd sentiment but due to recent changes in long and short positioning we arrive at a short-term cautious disposition.

Gold Price Peels Lower Despite Soft US Dollar Ahead of the Fed. Lower XAU/USD?

Gold Price Peels Lower Despite Soft US Dollar Ahead of the Fed. Lower XAU/USD?

Gold has broken lower in the aftermath of US CPI figures that undermined the US Dollar and lifted Treasury yields ahead of today’s Federal Open Market Committee (FOMC) meeting.

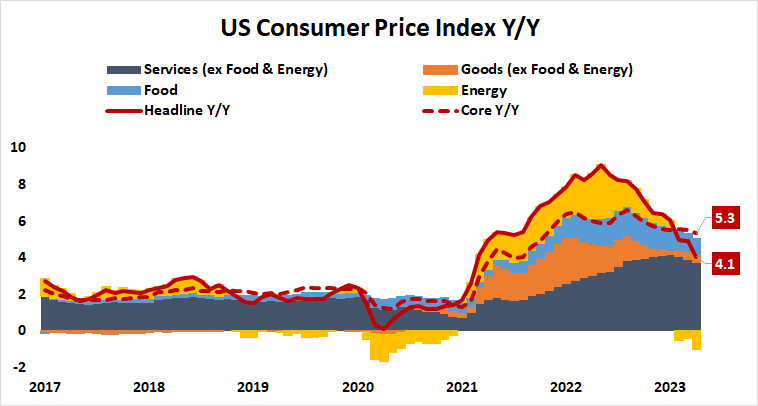
The monthly headline CPI gauge for May was 0.1% as anticipated against 0.4% previously to give a year-on-year number of 4.0%, slightly less than forecasts of 4.1% and 4.9% prior.

Looking at core CPI, it was 0.4% month-on-month for May, which was in line with expectations. Year-on-year it was 5.3%, a slight beat on the 5.2% anticipated and slightly below 5.5% prior.

The significant drop in the headline rate can be attributed to a base effect with the May 2022 monthly read of 0.9% dropping out of the data set.

Looking at the chart below, this outcome could be mostly attributed to the drop in the energy component of the data, which might be seen as impacted by changes in supply rather than demand.

image1.png

Source; Bloomberg, tastylive

Nonetheless, headway has been made in getting the drift of inflation going in the right direction. The absolute level of price pressures remains problematic, but it appears that the Fed might ‘skip’ a hike at its pow-wow later today.

The Fed’s target of 2% annual inflation is still some way off but by the time the July FOMC gathering rolls around, they will have another set of economic data points to reference.

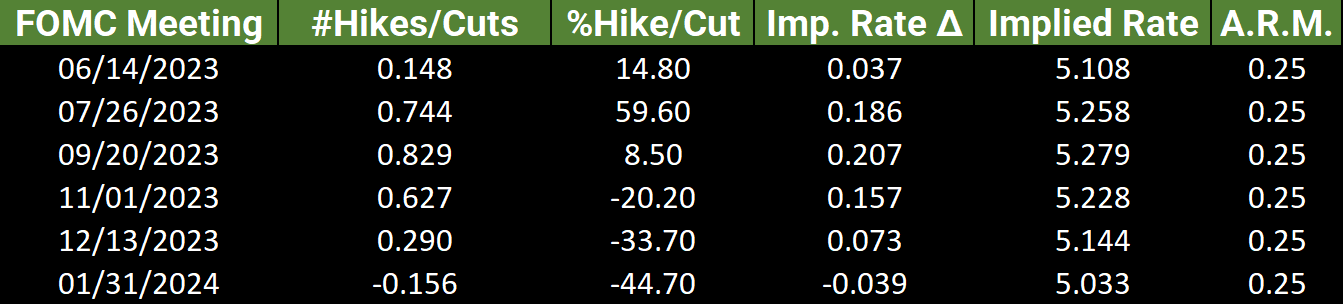
In any case, swaps and futures interest rate markets are pricing in no change for today but around a 75% chance of a 25 basis point lift at either the July or September meetings.

image2.png

Source; Bloomberg, tastylive

For gold, the uptick in Treasury yields may have played a role in the weakness seen overnight. The larger gains were seen in the 2- to 10-year part of the curve while the 1-year note remains near 23-year highs.

Additionally, the core component of the inflation data could indicate that some stickiness persists for high CPI. If inflation pressures linger this might see a resumption of a more hawkish Fed in subsequent meetings.

GC1 (GOLD FRONT FUTURES CONTRACT) TECHNICAL ANALYSIS

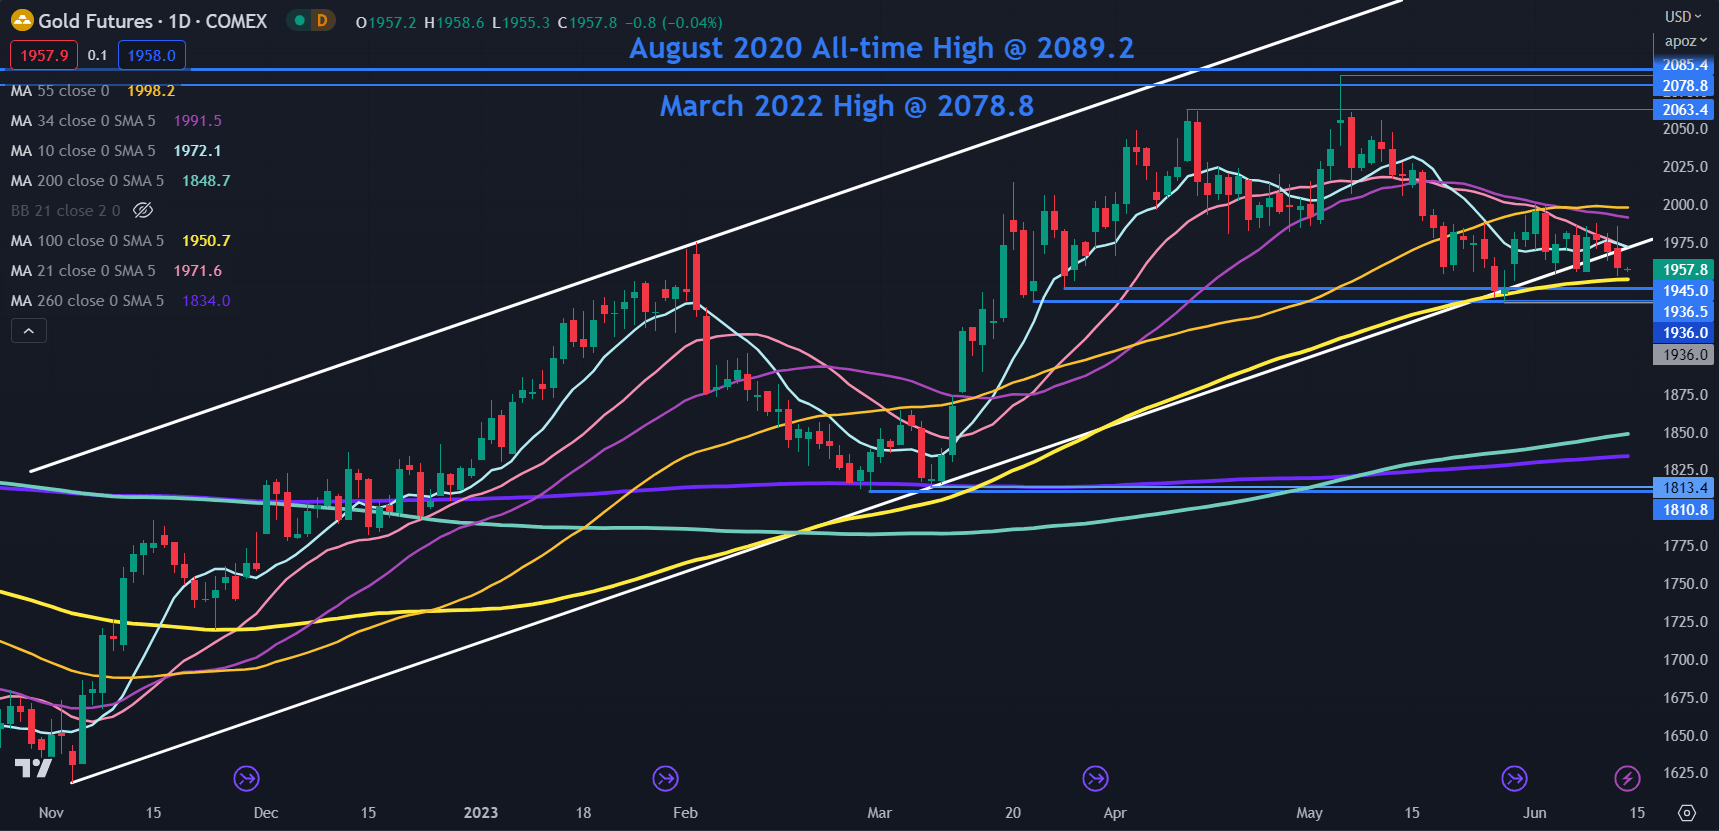
Gold has dipped below an ascending trend line again and might be at a crucial juncture in the coming sessions.

Below the price, the 100-day Simple Moving Average (SMA) currently lies just above prior lows in the 1936 – 1945 area which may provide a support zone. A clean break below those levels might see bearishness unfold.

On the topside, a sustained move above 2000 would clear all short, medium and long-term daily SMAs. This potentially suggests that bullish momentum could resume evolving if that target is achieved.

image3.png


Cooling US inflation provides room for Fed’s wait-and-see: Silver, Hang Seng Index, GBP/USD

Cooling US inflation provides room for Fed’s wait-and-see: Silver, Hang Seng Index, GBP/USD

Market Recap

Major US indices continue to add to recent gains overnight (DJIA +0.43%; S&P 500 +0.69%; Nasdaq +0.83%), as further cooling in US inflation reflects some degree of success in policy moves thus far and provides room for the Federal Reserve (Fed) to put on some wait-and-see at the upcoming Federal Open Market Committee (FOMC) meeting. An almost-certain 90% probability that rates will be put on hold this week is being priced by the Fed Funds futures, although expectations still largely lean towards a 25 basis-point (bp) upward adjustment in rates in July.

A 0.4% increase in core inflation from the previous month may be the reason behind it by pointing to some lingering prices’ stickiness. But nevertheless, the broader trend of moderating inflation suggests that we are still heading towards the final phase of the Fed’s tightening cycle, with one-off policy tweaks at best.

With expectations largely priced for a rate-pause scenario, more focus will be policymakers’ guidance and the fresh economic projections to determine what comes next. A more data-dependent stance and wordings around policy flexibility from the Fed may be looked upon as less hawkish. On the other hand, if terminal rate projection were to be revised higher alongside inflation estimates, it could paint a high-for-longer rate outlook and reignite hawkish concerns.

US Treasury yields were broadly higher, with the two-year yields delivering a new three-month high despite an initial decline. The rise in both nominal and real US yields kept the downward pressure on gold and silver prices overnight. Following an initial move higher, gains in silver prices were quickly pared through the day, with the formation of a long-tailed bearish candle pointing to the strong presence of sellers. Prices are struggling to hold above a near-term rising channel pattern for now, with any failure to defend the lower channel trendline support potentially paving the way towards its May 2023 low.

image1.png

Asia Open

Asian stocks look set for a positive open, with Nikkei +0.75%, ASX +0.32% and KOSPI +0.03% at the time of writing. A surprise cut in China’s short-term policy interest rate suggests that recent economic weakness is turning more of a concern for Chinese authorities, which may pave the way for more policy moves to come, with all eyes on the one-year medium-term lending facility (MLF) rate this Thursday. While a further dip into accommodative policies may be welcomed by investors, upside reaction could still remain more tepid, with clearer indications of policy success on the lookout to provide greater conviction on a sustained recovery.

Having traded on a descending wedge pattern since the start of the year, the Hang Seng Index is back to retest the upper trendline resistance, with a 9% gain month-to-date gain building on hopes that further support stimulus will kick in to lift growth. That said, a series of resistance remains in the way to drive the risks of the formation of a lower high, with the 19,600 level serving as immediate resistance to overcome. Much awaits, with the Relative Strength Index (RSI) crossing back above the key 50 level but sustaining above it will be key for now to keep buyers in control.

image2.png

Source: IG charts

On the watchlist: GBP/USD at one-month high as hawkish bets mount

Surprise strength in the UK job numbers has translated into gains in the GBP/USD overnight, as rate expectations for the Bank of England (BoE) recalibrated to price for more rate hikes from the central bank over subsequent meetings. A higher-for-longer rate outlook is the takeaway, with some pricing that rate could end at 6% by the end of this year, which is another 150 basis-point increase from the current 4.5%. This was followed by comments from the BoE Governor Andrew Bailey pointing to more sticky inflation, which reinforces the need that more needs to be done.

The GBP/USD has pushed to a new one-month high overnight, with a bullish crossover on moving average convergence/divergence (MACD) and its RSI trending above the key 50 level pointing to an upward bias for now. The pair has been trading within an ascending wedge pattern since October last year, with further upside potentially leaving the upper wedge trendline at the 1.276 level on watch for a retest. Ahead, focus will shift towards the FOMC meeting, which leaves any moves in the US dollar as greater catalyst in driving the pair. Near-term support may be at the 1.248 level, where the lower wedge trendline stands.

image3.png

Buy the Rumor Sell the Fact, Explained

Buy the Rumor Sell the Fact, Explained

Buy the rumor, sell the fact’ is not just trader lingo but is rooted in human psychology and presents itself repeatedly in financial markets. Understanding why traders and investors pile into a particular market in anticipation of the news and then sell right after that very same news is confirmed, can help traders avoid poor entries.

What Does ‘Buy the Rumor, Sell the Fact’ Mean?

It seems illogical for markets to rise before confirming some economic news or data. Why wouldn’t investors or traders wish to wait for confirmation and then enter the market? Well, what tends to happen is a narrative is revealed via price action, anticipating the positive news/data which then gains traction as investors pile in. The good news is then confirmed, and the market sells off as a result of profit taking with many people left wondering why the market reacted contrary to the news.

Why Markets Sometimes Rise Before the News and Sell-off Straight After?

There are a number of driving forces behind the ‘buy the rumor, sell the fact’ phenomenon. They largely consist of the following:

  1. Speculation
  2. Crowd psychology or herd behavior
  3. Fear of missing out (FOMO)
  4. Mass selling

1. Speculation

Speculation is the process of buying into an asset with the hopes of eventually selling that asset at a higher price, at a later date. When fund managers, investors or traders conduct analysis that reveals an opportunity for price appreciation, they are likely to enter a speculative position.

When market moving information makes its way to the market it causes market participants to re-evaluate the current bias/trend. Such news/data can be in the form of an interest rate decision of a major central bank, inflation report, murmurs of a merger etc. However, we often observe that prices do not immediately adjust, instead, we tend to see price action gaining momentum as more and more investors pile into the trade. This is where crowd psychology takes center stage.

2. Crowd Psychology or Herd Behavior

Herd behavior is the process where a group of individuals collectively act in the same manner and is characterized by a lack of individual decision making or introspection. In a financial context this could be observed when driving up the price of an asset, for example bitcoin, or piling into shares of GameStop.

Herd behavior assumes that because everyone else is doing it, it must be the right thing to do. Once a narrative takes hold, it can be difficult to fight, much like a narrative that the Federal Reserve Bank will raise interest rates by a certain percentage or rumors that company A intends to acquire company B.

3. Fear of Missing Out (FOMO)

Crowd psychology is a powerful thing. Once it gets going it has the potential to accelerate as those that were previously on the sidelines are convinced to join the party – often at already elevated levels. It is the fear of missing out (FOMO), rather than strategy and detailed analysis that propels people towards the popular narrative or trade once the majority of the crowd is already on board. FOMO leads to impulsivity and a lack of long-term perspective, often to the detriment of the individual and adds to price appreciation.

4. Mass Selling

As soon as the anticipated news or data is confirmed, traders and investors often look to realize their gains and sell to close their winning positions. Markets can plummet in a short amount of time as selling orders are executed right after the news/data is released. In today’s modern age of trading this has the potential to trigger momentum-based algorithms which continue the selling. To make things worse, those FOMO traders that entered the market right at the peak may be inclined to cut their losses after the sudden and sharp decline, sending the market even lower.

Example 1: The Fed to Hike by 75 Basis Points in June 2022

The June Federal Open Market Committee (FOMC) meeting provided an example where markets priced in a rate hike (via the US dollar Index, ‘DXY’) before it was confirmed, only to drop immediately after the confirmation of the hike.

Markets actually started to anticipate the 75-basis point hike based on rising inflation data which was released two days before the FOMC announcement. DXY advanced ahead of the meeting as each of the prior three inflation prints surprised to the upside, revealing a trend of higher-than-expected inflation readings. High inflation forces the Fed to act and raise interest rates. Then to almost confirm without a doubt that the Fed would hike by 75 bps the Wall Street Journal published a supposed leak from the 2-day FOMC meeting ‘confirming’ that the committee was united on the 75-bps hike. Immediately after the 75-basis point hike was confirmed, DXY dropped.

US Dollar Index (DXY) 2-Hour Chart

DXY chart showing price action before and after Fed rate hikeAlternative assets like cryptocurrencies are known to sway heavily with prevailing market sentiment, which has led to exponential rises and devastating declines over the years. In the first half of 2021, massive hype and media coverage spurred Dogecoin towards a value of 1:1 with the dollar ahead of Dogecoin cult figure, Elon Musk’s appearance on the popular TV show Saturday Night Live.

Dogecoin rose right up until the very day of his appearance and plummeted right after. This is another example whereby the market bid up the price of the coin and then sold off after the event.

Dogecoin ahead of Elon Musk's Saturday Night Live appearance and reaction thereafterOther examples that witness a ramp up ahead of the news can include company socks before reporting earnings, as well as rumors of a takeover or mergers.

Euro Gains as the US Dollar Frets ahead of the Fed after Benign CPI. Higher EUR/USD?

Euro Gains as the US Dollar Frets ahead of the Fed after Benign CPI. Higher EUR/USD?

The Euro dipped today after the recovery from its late May low on Tuesday and going into the Federal Reserve meeting today. The European Central Bank (ECB) monetary policy review will follow tomorrow.

Yesterday saw US CPI soften to 4.0% year-on-year to the end of May rather than the 4.1% anticipated and 4.9% prior. Core CPI for the same period beat forecasts of 5.2% printing at 5.3% against 5.5% previously.

The data may confirm the market’s perception that the Fed may ‘skip’ a hike today but might lift rates again when they congregate in July or September.

The focus of attention is likely to be on the post-decision press conference and Fed Chair Jerome Powell’s language for guidance on the rate path.

The ECB are anticipated by interest rate markets to hike by 25 basis points to try to rein in inflation of over 6%.

Elsewhere in Europe, the Norwegian Krone is eyeing a 2-month high against EUR ahead of the Norges Bank deposit rate decision next week.

Last week’s CPI data showed an acceleration to 6.7% year-on-year to the end of May for the Nordic nation. Rising price pressures could see the Norges Bank turn more hawkish at its gathering next week.

Crude oil had a solid session on Tuesday and has held onto the gains going into Wednesday trading. The WTI futures contract is near US$ 69.50 bbl while the Brent contract is oscillating around US$ 74.50 bbl at the time of going to print.

Treasury yields have been ticking higher so far this week and it appears to have undermined the gold price, currently trading near US$ 1,960.

North American equity indices clocked up decent gains into cash market close with the Russell 2000 leading the way, notching up a 1.23% gain. Somewhat ironically, the higher Wall Street travels, the higher the futures market price the Fed funds rate for December.

image1.png

Source; Bloomberg, tastylive

APAC equities have been mixed on Tuesday with Australian and Japanese markets climbing over a per cent while Hong Kong and South Korean indices slid lower.

The Fed decision and subsequent press conference will be crucial later today, but UK data and US PPI gauges will also be keenly watched.

EUR/USD TECHNICAL ANALYSIS

EUR/USD has recovered from the 10-week low seen last week at 1.0635. This was only a fraction below the 78.6% Fibonacci Retracement of the move from 1.0516 to 1.1096 at 1.0640.

This may see the 1.0635 – 40 area set up as a potential support zone ahead of the prior lows at 1.0525, 1.0516, 1.0483 and 1.0443.

On the topside, resistance could be near the breakpoints of 1.0831 and 1.0942.

In April and May, a series of highs were seen in the 1.1075 – 95 area and this might offer a resistance zone. In the bigger picture, a clean take out of these levels may confirm the resumption of the ascending trend.

These tops created an extension of a Double Top formation that heralded the sell-off last month. It should be noted though that past performance is not indicative of future results. The neckline from this formation is at 1.0942 and it might offer resistance.

image2.png

Chart created in TradingView

What Trading Style Best Suits Your Personality?

What Trading Style Best Suits Your Personality?

Trading style often correlates with the personality of the trader. It is important to reflect internally on personality and lifestyle before choosing a trading strategy and creating a trading plan. This is because using a trading style contrary to your personality will lead to difficulties down the road in sticking to your trading plan.When a trader finds the trading style that suits them best; the style generally endures long term. A trader who isn’t comfortable with a trading style or has not found a home in a specific trading style is the one who most often makes the most common trading mistakes.

Trading Styles for Highly-Organized Individuals Short on Time

Strategies to consider:

  • Swing Trading– Swing trades are considered medium-term as positions are generally held anywhere between a few hours to a few days. The time investment is minimal which is suitable for traders short on time. Orders to open and close may be used which will automatically trigger once certain price levels are reached.
  • Automated Trading – Another approach for traders short on time, or trading in their spare time, is automated trading. Traders merely set their entry and exit criteria along with the size of the trade and allow the market to do the rest.

Trading Style for Cautious Individuals with Time to Research

Strategies to consider:

  • Position Trading – This is suitable for traders looking to hold positions for a prolonged period (months/years), often basing decisions on long-term fundamental factors. Large capital is required to withstand any potential volatility during the lifetime of the trade in order to avoid a margin call. Cautious individuals will also tend to trade smaller sizes, make use of stops, and avoid highly volatile markets.

Trading Style for Decisive Individuals who Prefer Instant Results

Strategies to consider:

  • Scalp Trading – A scalp trader looks to open and close a trade within minutes, often takingadvantage of small price movements usually with high leverage. Profits and losses are realized swiftly due to the fast-moving nature of this trading strategy. Decisive traders that seek instant results often trade the news by formulating an opinion of how the market is likely to react and plan accordingly.

Being Consistent with Your Trading Style

Consistency in trading style will lead to consistency in results. Altering styles when trades are not favourable is a common mistake with novice traders. Judgement should not be handed after limited trades, because not every trade is successful. If the trading strategy is sound with proper risk management, sticking to it should provide the desired results.

Finding Your Trading Personality and Style: A Summary

Traders of different personalities and lifestyles can all participate in the forex market. Whether a trader is comfortable with a hands-on longer-term swing or position trading approach, or shorter-term day trading or scalping approach or even a hands-off automated trading approach; trading has something for everyone!

Discover what kind of trader you are with the DailyFX DNA FX quiz !

Become a Better Trader with Our Trading Tips

  • Knowing how to control emotions while trading can prove to be the difference between success and failure. explore the importance of emotions in trading.
  • It is important to have trading goals to work towards. Learn more about how to set these goals in our Becoming a Better Trader webinar series.
  • Our research team analyzed over 30 million live trades to uncover the Traits of Successful Traders. Incorporate these traits into your strategy to give yourself an edge in the markets.
Gold Price Flirts with Support as US CPI Shapes Views Ahead of the Fed and ECB

Gold Price Flirts with Support as US CPI Shapes Views Ahead of the Fed and ECB

The gold price edged up to start Tuesday’s session as the market contemplates the possible outcomes of US CPI and PPI ahead of the Fed’s Federal Open Market Committee (FOMC) meeting late Wednesday.

Treasury yields have been remarkably steady so far this week ahead of the crucial inflation data and monetary policy meeting. The 2s 10s curve inversion remains deeply negative below -0.80% but equity markets don’t seem too fazed by what the bond market is saying.

At the same time that nominal yields have plateaued out, the US 10-year real yield continues to tick slightly north, trading above 1.5%.

The real yield is the nominal yield less the market-priced inflation rate derived from Treasury inflation-protected securities (TIPS) for the same tenor.

If CPI data later today is notably different to expectations, the real yield might see volatility that could see the gold price react accordingly. When the 10-year real yield was at these levels in February, the yellow metal was below US$ 1,850.

A Bloomberg survey of economists is forecasting CPI to be 0.1% month-on-month for May against 0.4% prior. Further details of the data can be found on the DailyFX calendar here.

The US Dollar is a bit softer so far on Tuesday and has helped crude oil lift itself off a 5-week low. The WTI futures contract is near US$ 67.50 bbl while the Brent contract is a touch above US$ 72 bbl.

The People’s Bank of China (PBOC) gave markets a slight boost when they cut the 7-day reverse repo rate from 2% to 1.9%.

APAC equities are mostly slightly in the green after a positive lead from the Wall Street close. Futures are pointing to a steady start to its cash session.

GC1 (GOLD FRONT FUTURES CONTRACT) TECHNICAL ANALYSIS

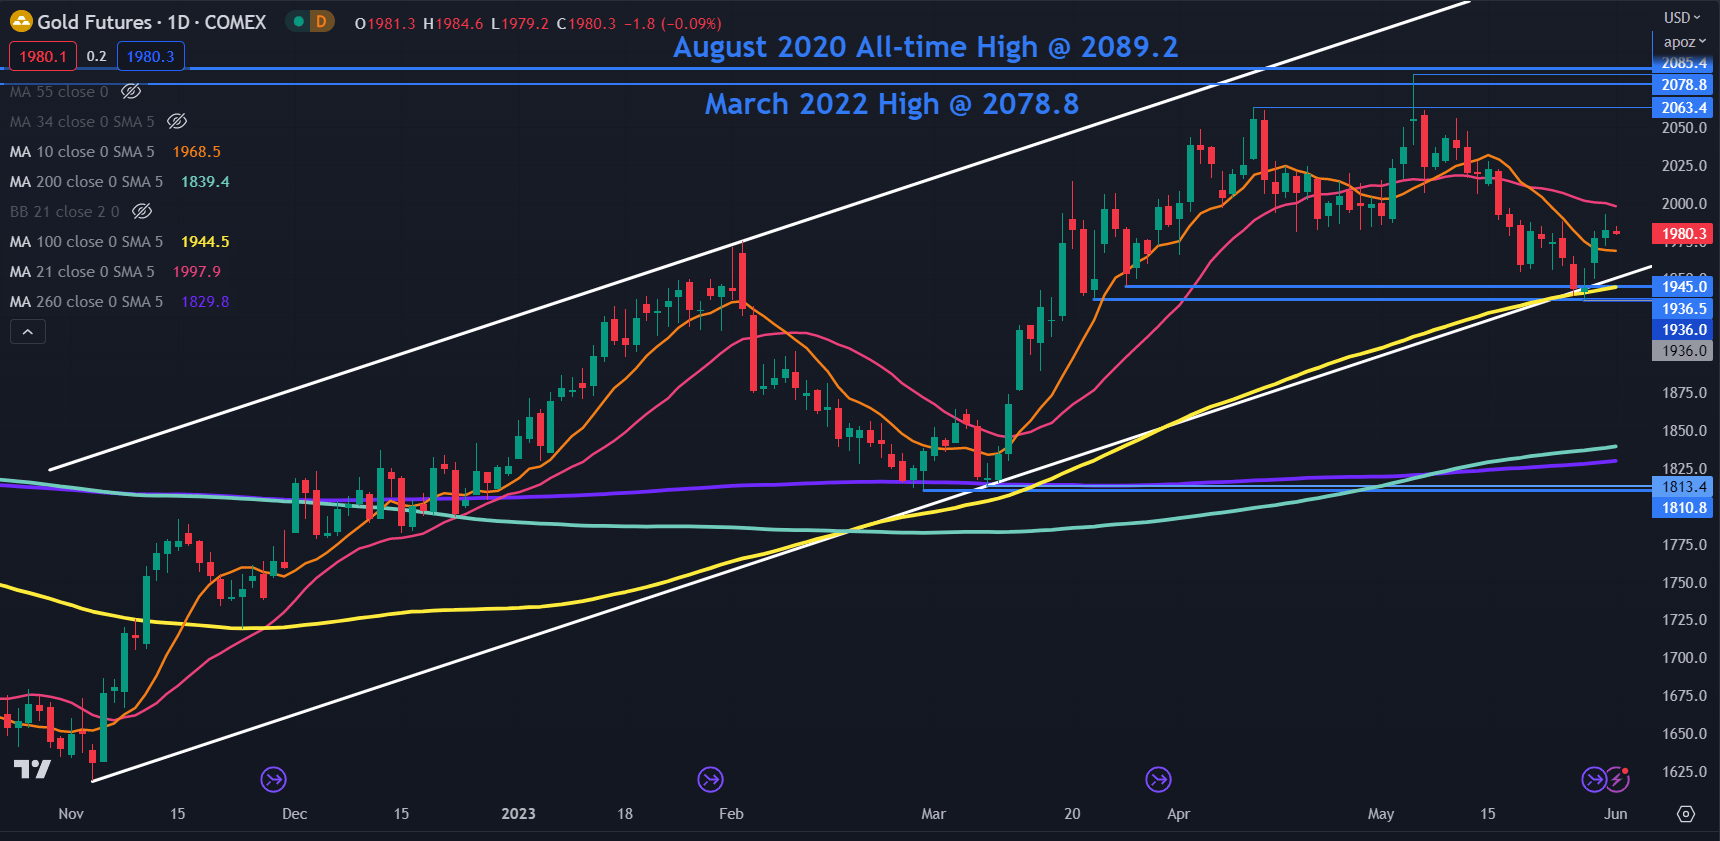
Gold remains in an ascending trend channel that began in November last year and it continues to toy with the idea of breaking the lower ascending trend line of that channel.

A clean break below this trend line might suggest that the bullish run could face scrutiny

The 100-day Simple Moving Average (SMA) is below the ascending trend line ahead of the prior lows in the 1936 – 1945 area that may provide a support zone

If these support levels are broken, a bearish run may evolve, and the next support zone of note could be at the Double Bottom of 1811 and 1813.

If the nearby support levels hold and the price moves back above the short-term 10- and 21-day SMAs, it might suggest that bullish momentum could unfold further.

The early May high of 2085 eclipsed the March 2022 peak of 2079 but was unable to overcome the all-time high of 2089. This failure to break new ground to the upside has created a Triple Top which is an extension of a Double Top formation.

This has set up a potential resistance zone in the 20280 – 2090 area but a snap above those levels may indicate evolving bullishness. The next level of resistance could be at the upper ascending trend channel line that is currently near 2185.

image1.png


Euro (EUR) Market Latest – EUR/USD and EUR/GBP Poised Ahead of Fed and ECB

Euro (EUR) Market Latest – EUR/USD and EUR/GBP Poised Ahead of Fed and ECB

The next two days will see both the Federal Reserve (Fed) and the European Central Bank (ECB) announce their latest monetary policy decisions with markets fully expecting the Fed to pause its fourteen-month hiking cycle, while the ECB will hike rates by a further 25 basis points. Both these outcomes are fully expected and priced into the market, however post-decision commentary from both central banks will be key. Ahead of these two policy decisions, later today the May US inflation report is released with forecasters expecting price pressures in the US to ease, but not at a particularly quick rate. A miss of expectations, either way, today could give the US dollar a shot of volatility ahead of Wednesday’s FOMC decision.

image1.pngimage2.png

For all market-moving events and economic data releases, see the real-time DailyFX Calendar

EUR/USD is testing a prior level of resistance just under 1.0800 ahead of today’s inflation report and today made a fresh two-week high. The pair will likely remain trapped in a small range ahead of US CPI, unless there is a large deviation from expectations, before settling into a holding pattern ahead of Wednesday’s FOMC decision.

EUR/USD Daily Price Chart – June 13, 2023

image3.png

Retail Trading Sentiment is Mixed

Retail trader data shows 59.86% of traders are net-long with the ratio of traders long to short at 1.49 to 1.The number of traders net-long is 6.98% higher than yesterday and 8.88% lower from last week, while the number of traders net-short is 2.14% lower than yesterday and 6.55% higher from last week.

We typically take a contrarian view to crowd sentiment, and the fact traders are net-long suggests EUR/USD prices may continue to fall. Positioning is more net-long than yesterday but less net-long from last week. The combination of current sentiment and recent changes gives us a further mixed EUR/USD trading bias.

The British Pound is pushing higher again today after the latest UK jobs report showed the unemployment rate moving back to 3.8%, while UK wages rose by a robust 7.2%. These figures, while good for the UK economy, will give the Bank of England further cause for concern in its fight against inflation and will embolden BoE hawks further to keep hiking the UK Bank Rate.

GBP Breaking News: Searing UK Jobs Report Lifts the Pound

EUR/GBP has moved consistently lower over the six weeks as traders price in a higher UK terminal rate. This, expected, widening of the EU/UK interest rate differential has seen EUR/GBP print a multi-month low this week around 0.8540 and this move lower may continue in the coming weeks with 0.8500 the next level of support. A larger sell-off could see 0.8340 as the end target.

EUR/GBP Daily Price Chart – June 13, 2023

image4.png

What is your view on EUR/USD and EUR/GBP – bullish or bearish

GBP Breaking News: Searing UK Jobs Report Lifts Pound

GBP Breaking News: Searing UK Jobs Report Lifts Pound

NO LET UP FOR UK LABOR MARKET, POUND BID!

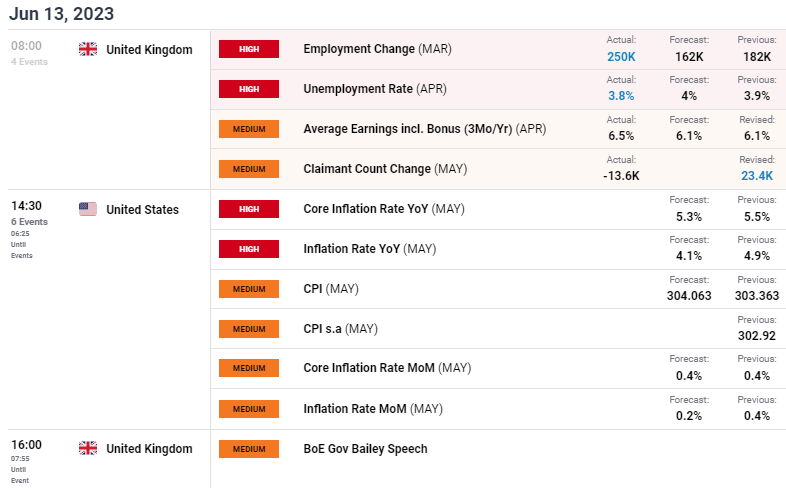
The British pound rallied on stellar jobs data (see economic calendar below. All metrics showed improvement which is not a good sign for Bank of England (BoE) doves. Concerns around sticky core inflation from the BoE’s Mann and aggressive monetary policy comments from Haskel yesterday will surely be heightened with today’s data and the fact that several other BoE speakers are scheduled for today (Greene, Governor Bailey and Dhingra) could augment the hawkish bias.

ECONOMIC CALENDAR

image1.png

Source: DailyFX Economic Calendar

The average earnings metric is of particular concern as it reached fresh yearly highs (6.5%) and should contribute to elevated inflation pressures. Money markets now expect roughly 105bps of rate hikes by December 2023 (refer to table below) with an 82% probability of a 25bps (down from 93% a few days ago) increment for the June meeting. Should impending UK economic data release in the same fashion, projections may shift further in favor of a 50bps hike.

While the pound is bid this morning, market may not get behind the data as forcefully as usual due to market hesitancy around the upcoming US CPI report that could shape the short-term directional bias for cable.

BANK OF ENGLAND INTEREST RATE PROBABILITIES

image2.png

TECHNICAL ANALYSIS

GBP/USD DAILY CHART

image3.png

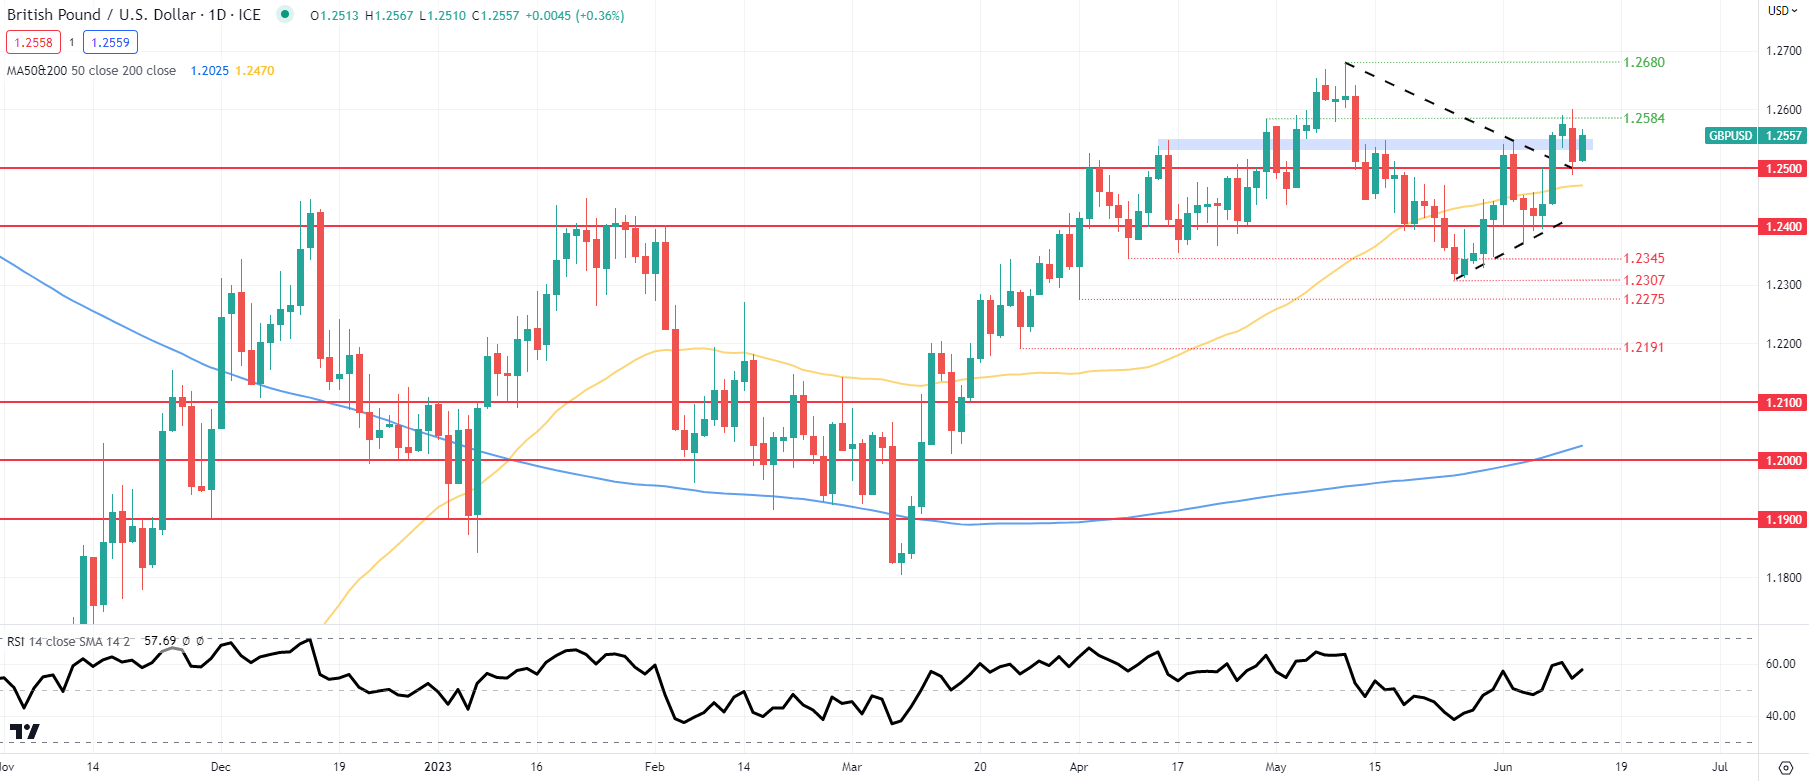
Price action on the daily cable chart is firmly above the 1.2500 psychological handle after breaking through the symmetrical triangle chart pattern (black). A full bullish breakout could be spurred on by fading US inflation later today thus exposing subsequent resistance zones.