Annual inflation down to 6.1% in the euro area

Annual inflation down to 6.1% in the euro area

The euro area annual inflation rate was 6.1% in May 2023, down from 7.0% in April. A year earlier, the rate was 8.1%. European Union annual inflation was 7.1% in May 2023, down from 8.1% in April. A year earlier, the rate was 8.8%. These figures are published by Eurostat, the statistical office of the European Union. The lowest annual rates were registered in Luxembourg (2.0%), Belgium (2.7%), Denmark and Spain (both 2.9%). The highest annual rates were recorded in Hungary (21.9%), Poland and Czechia (both 12.5%). Compared with April, annual inflation fell in twenty-six Member States and rose in one.

Bank of England/Ipsos Inflation Attitudes Survey – May 2023

Bank of England/Ipsos Inflation Attitudes Survey – May 2023

News release

This news release describes the results of the Bank of England’s latest quarterly survey of public attitudes to inflation.

From February 2022, the survey has been conducted on the Bank of England’s behalf by Ipsos, prior to that it was conducted by Kantar. Ipsos interviewed a quota sample of people aged 16-75 across the United Kingdom; the sample was surveyed between 12 and 16 May 2023.

Please note, the Government’s social distancing guidance meant that face-to-face interviewing was not possible for the surveys conducted since May 2020. These have been conducted online instead. This change resulted in a methodological break in the series in May 2020. For example, the proportions of respondents who answered “Don’t know/ No idea” to the May survey’s questions declined substantially. That perhaps reflected the design of the online questionnaire, where the option of “Don’t know/ No idea” appeared only if the respondent tried to move onto the next question without giving an answer. In the surveys since August 2020 however, the option of “Don’t know/ No idea” appeared in the same showcard as the other options. The proportions of respondents answering “Don’t know/ No idea” returned to usual levels for most questions in the August 2020 and subsequent surveys.

These mode of collection changes mean caution should be taken when making comparisons across the latest twelve surveys and May 2020 and with previous vintages, which were based on face-to-face interviews.

More details about the methodology applied in the surveys since May 2020 can be found in the ‘Methodology and notes – online survey’ attachment and that of previous surveys in the ‘Methodology and notes – face-to-face survey’ attachment.

Highlights from the Survey

Question 1: Asked to give the current rate of inflation, respondents gave a median answer of 9.6%, up 9.2% February 2023.

Question 2a: Median expectations of the rate of inflation over the coming year were 3.5%, down from 3.9% in February 2023.

Question 2b: Asked about expected inflation in the twelve months after that, respondents gave a median answer of 2.6%, down from 3.0% in February 2023.

Question 2c: Asked about expectations of inflation in the longer term, say in five years’ time, respondents gave a median answer of 3.0%, unchanged from February 2023.

Question 3: By a margin of 69% to 6%, survey respondents believed that the economy would end up weaker, rather than stronger, if prices started to rise faster, the same as February 2023.

Question 4: 37% of respondents thought the inflation target was ‘about right’, down from 38% in February 2023. The proportions saying the target was ‘too high’ or ‘too low’ were 32% and 14% respectively.

Question 5: 75% of respondents said that interest rates on things such as mortgages, bank loans and savings had risen over the past 12 months, the same as February 2023. Meanwhile, 3% of respondents thought that interest rates had fallen over the past 12 months, down from 4% in February 2023.

Question 6: When asked about the future path of interest rates, 57% of respondents expected rates to rise over the next 12 months, down from 58% in February 2023. 20% said they expected rates to stay about the same over the next twelve months, down from 21% in February 2023.

Question 7: Asked what would be ‘best for the economy’ – higher interest rates, lower rates or no change – 16% thought rates should ‘go up’, unchanged from February 2023. 37% of respondents thought that interest rates should ‘go down’, compared to 33% in February 2023. 25% thought interest rates should ‘stay where they are’, down from 27% in February 2023.

Question 8: When asked what would be ‘best for you personally’, 26% of respondents said it would be better for them if interest rates were to ‘go up’, down from 27% in February 2023. 31% of respondents said it would be better for them if interest rates were to ‘go down’, up from 30% in February 2023.

Question 14: Respondents were asked to assess the way the Bank of England is ‘doing its job to set interest rates to control inflation’. The net satisfaction balance, the proportion satisfied minus the proportion dissatisfied, was -13%, down from -4% in February 2023.

Dollar may well stay soft against most currencies except the Yen – ING

Dollar may well stay soft against most currencies except the Yen – ING

This month in the G10 space, the Dollar is only stronger against the Yen. Economists at ING analyze the USD

DXY can probably edge down to the 102.00 area

In the short term, the Dollar may well stay soft against most currencies except the Japanese Yen, with the Bank of Japan remaining resolutely dovish. Here, Yen-funded carry trades will remain popular.

For today’s data, we have the University of Michigan’s inflation expectations. This occasionally moves markets and any meaningful drop could nudge the Dollar lower. Equally, we have three Fed speakers, generally from the hawkish end of the spectrum.

We think the mood to put money to work probably dominates and barring any big upside surprise in US inflation expectations, DXY can probably edge down to the 102.00 area, if not below.

Nigeria’s naira recorded a historical plunge after being floated freely

Nigeria’s naira recorded a historical plunge after being floated freely

The decision by the Central Bank of Nigeria (CBN) to float the naira freely has come with an unwanted outcome: a historical fall of the value of currency against the US dollar.

Intended to curb dollar scarcity and curtail parallel forex exchange markets, the move has sent the naira down by 36% on the official market on June 14. The new policy removed trading restrictions on the official market, forcing the naira to go from 477 per US dollar on June 13 to 750 on June 14. As of June 15, the black market rate stood at 760 per US dollar.

As buyers and sellers of foreign currency in the official forex market continue to quote rates they find comfortable, compared to previous practice where rates were dictated by the Nigeria central bank, the naira could reach 800 against the US dollar.

Though it remains a wait-and-see situation, analysts expect the currency float to help close the gap between official and parallel market exchange rates, boost investor confidence, increase foreign inflows, reduce import costs, and ease pressure on the naira.

Major banks cut China 2023 GDP forecasts as recovery falters

Major banks cut China 2023 GDP forecasts as recovery falters

BEIJING: Four major Western banks have cut their 2023 gross domestic product (GDP) growth forecasts for China after May data showed a post-COVID recovery was faltering in the world’s second-largest economy.

UBS, Standard Chartered, Bank of America (BoA) and JPMorgan now expect China’s GDP growth to be between 5.2 per cent and 5.7 per cent this year, down from an earlier range of 5.7 per cent to 6.3 per cent.

Data on Thursday (Jun 15) showed China’s economy stumbled in May with industrial output and retail sales growth missing forecasts, adding to expectations that Beijing will need to do more to shore up a shaky post-pandemic recovery.

The government has set a modest GDP growth target of around 5 per cent for this year after badly missing its 2022 goal.

UBS economists on Friday cut their GDP forecast to 5.2 per cent from 5.7 per cent and said in a note that they expected more policy support to come.

China’s central bank on Thursday cut the interest rate on its one-year medium-term lending facility, the first such easing in 10 months, paving the way for cuts in the benchmark loan prime rates (LPR) next week.

Economists at Standard Chartered lowered their 2023 growth forecast to 5.4 per cent from 5.8 per cent previously.

Additional stimulus likely to be measured, as China prioritises improving business climate and confidence,” the economists said in a note.

Standard Chartered lowered its forecast for China’s second-quarter growth to 5.8 per cent from 7 per cent. The April-June growth is widely expected to be boosted by a low base of comparison given there were widespread COVID-19 lockdowns a year earlier.

BofA downgraded its 2023 GDP growth forecast to 5.7 per cent from 6.3 per cent, while JPMorgan had earlier trimmed its outlook to 5.5 per cent from 5.9 per cent.

China will roll out more stimulus to support a slowing economy this year, but authorities are likely to focus on shoring up weak demand in the consumer and private sectors, sources involved in policy discussions said.

Major banks cut China 2023 GDP forecasts as recovery falters

Major banks cut China 2023 GDP forecasts as recovery falters

EUR/USD treads water around mid-1.0900s during a sluggish Friday morning in Europe. The Euro pair struggles to extend the previous day’s run-up amid a minor US Dollar rebound and a cautious market mood. US sentiment data, Fedspeak eyed.

The EUR/USD surged on Thursday, reaching 1.0952, the highest level in a month. The pair is holding firm to gains, suggesting that the rally might not be over. The pair had its best day in months, boosted by the European Central Bank’s hawkish tone and by broad-based Dollar weakness.

The European Central Bank (ECB) raised its interest rates by 25 basis points as expected, while leaving the forward guidance unchanged. President Lagarde mentioned that the job is not done, and stated that the most likely scenario is another hike in July. Inflation forecasts were revised higher, and a 25 basis point hike at the next meeting is priced in.

German bond yields rose while Treasury yields declined, boosting the EUR/USD. The hawkish tone from Federal Reserve Chair Powell on Wednesday did not have a lasting impact on the US Dollar. The Greenback was also affected by the improving risk sentiment and by US economic data. US stocks finished with gains of more than 1%.

Inflation data from the Eurozone is due on Friday, but considering those figures are final estimations, no impact is expected. In the US, the University of Michigan Consumer Sentiment Index is due. Market participants will continue to digest recent central bank meetings.

Asia Day Ahead: Lingering Market Doubts on Fed’s Hawkish Guidance

Asia Day Ahead: Lingering Market Doubts on Fed’s Hawkish Guidance

Wall Street looks set to deliver its fifth consecutive week of gains, pushing ahead with another round of stellar gains overnight (DJIA +1.26%; S&P 500 +1.22%; Nasdaq +1.15%). Considering that the Fed is still data-dependent, market participants have not been buying into the Fed’s hawkish guidance, with the Fed funds futures continuing to price for one last 25 basis-point hike in July and rate cuts as early as next year. This serves as a pushback against the Fed’s guidance of 50 basis-point hike by the end of 2023 and a ‘couple years out’ in rate cuts, which may be perceived to lack commitment with the aim to avoid complacency.

Overnight economic data saw US retail sales turned in a positive surprise (0.3% month-on-month versus -0.1% expected) as a reflection of resilient consumer demand. While previous concerns were that stronger consumer demand may feed into inflation, the broader trend of easing pricing pressures has somewhat put inflation risks in the backseat for now, with the narrative shifted towards whether a soft landing can be delivered. Along with jobless claims’ numbers indicating further progress in cooling the overheated US labour market, sentiments managed to resume its risk-on mode following the data release.

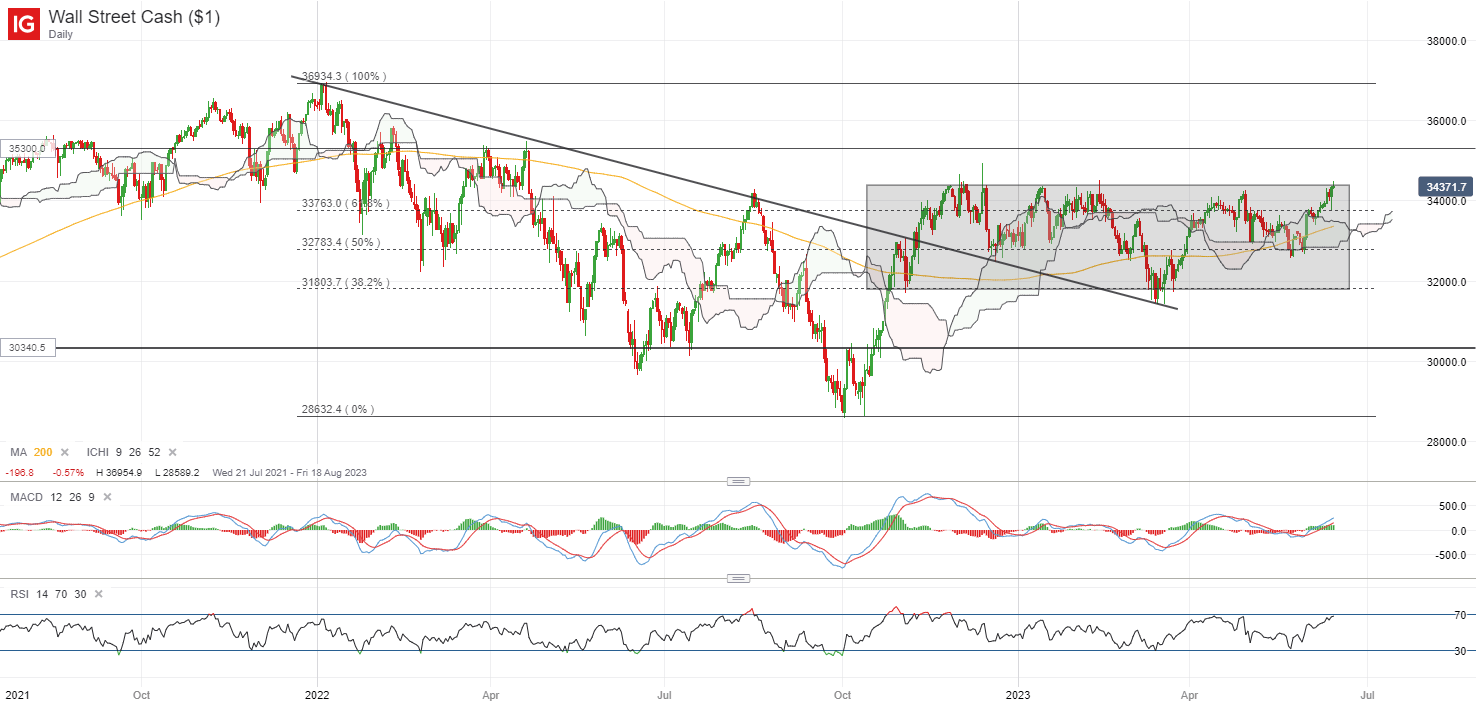
The DJIA is back to retest the upper range of its consolidation pattern at around the 34,400 level, where the index has failed to overcome on at least five occasions since October last year, reinforcing the level as a crucial resistance. A break of the upper range may pave the way to retest the 35,300 level next. The overall upward trend remains, with its moving average convergence/divergence (MACD) heading above the zero line as a sign of building upward momentum. In the event of a retracement, immediate support may be at the 33,800 level (Fed-meeting bounce).

image1.png

Asia Open

Asian stocks look set for a mixed open, with Nikkei -0.66%, ASX +0.54% and KOSPI +0.32% at the time of writing. The Nikkei has diverged from the positive handover in Wall Street, seemingly a sign of some near-term exhaustion as technicals trend in overbought territory. With follow-up rate cuts coming from China yesterday, the Hang Seng Index is hovering just below its 20,000 psychological level in today’s session. Overcoming this level may further support bulls in control for now.

Economic data saw Singapore’s non-oil domestic exports (NODX) contracting for the eighth straight months (-14.7% versus -1.3% consensus), with the significant underperformance reflecting greater risks to global demand conditions. A low-for-longer growth outlook for Singapore seems to be the takeaway, validating the cut in 2023 growth forecast to 1.4% (previous 1.9%) from a MAS survey this week.

Ahead, the Bank of Japan (BoJ) meeting will be in focus. Speculations for a quicker policy shift from the BoJ have not been receiving much validation by policymakers thus far, with a dovish rhetoric from BoJ Governor Kazuo Ueda last week anchoring expectations for a no-change in policy rate for at least the next three policy meetings.

Market participants will be looking for any response to the continued pull-ahead in Japan’s “core core” inflation (4.1% in April) but while a higher inflation picture may be acknowledged, an uneven recovery in Japan and still-subdued wage growth of 1% may still provide some reasoning for the central bank to justify its ‘transitory inflation’ view.

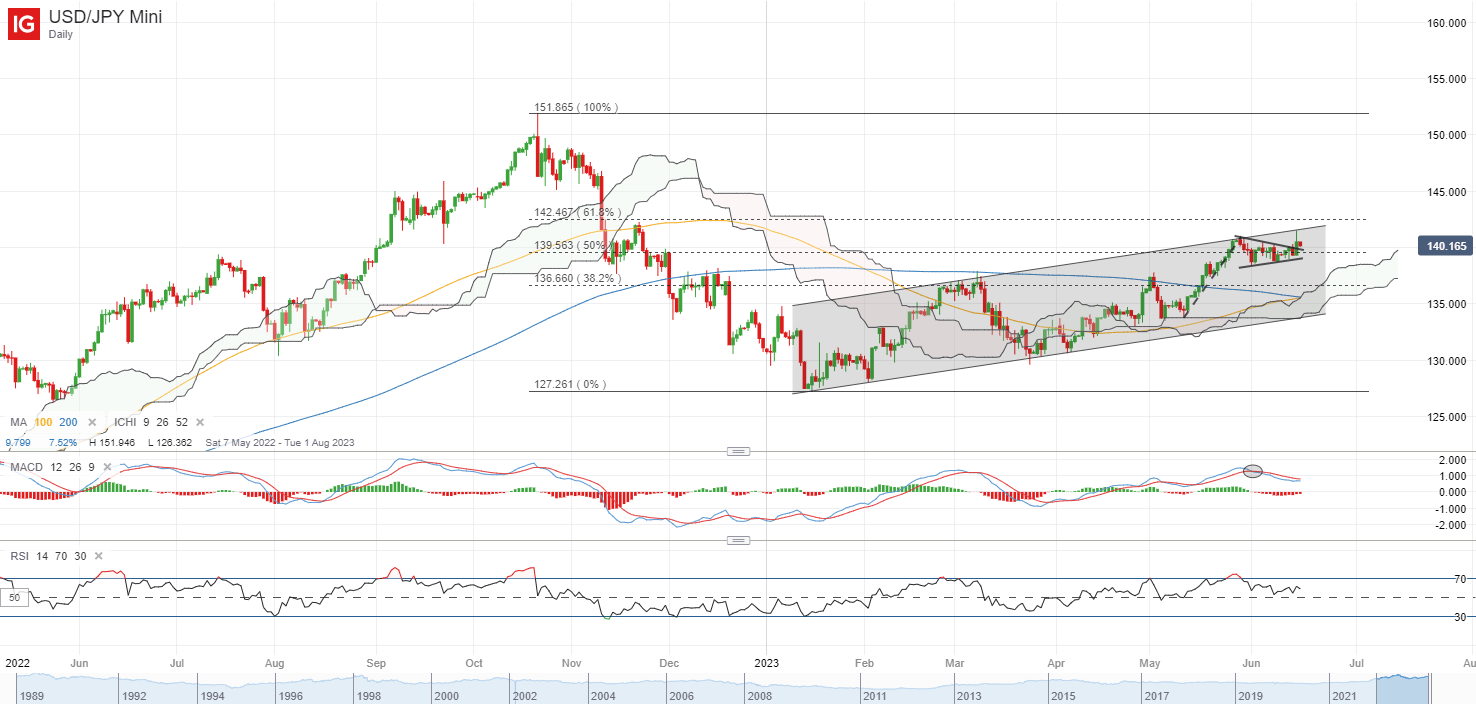
The USD/JPY has been trading within an ascending channel pattern since the start of the year, with a retest of the upper channel trendline overnight met with some resistance on a lacklustre US dollar. The lower highs on RSI may point to some near-term exhaustion, with further downside to leave immediate support at the 138.50 level on watch, followed by the 136.70 level. That said, the overall trend remains upward bias, with the formation of higher highs and higher lows, along with a firm sit above its 100-day and 200-day moving averages (MA). Any failure to hold above its key 200-day MA line may be an indication of a trend reversal ahead.

image2.png

Source: IG charts

On the watchlist: Trend for EUR/USD tilted to the upside following the ECB meeting

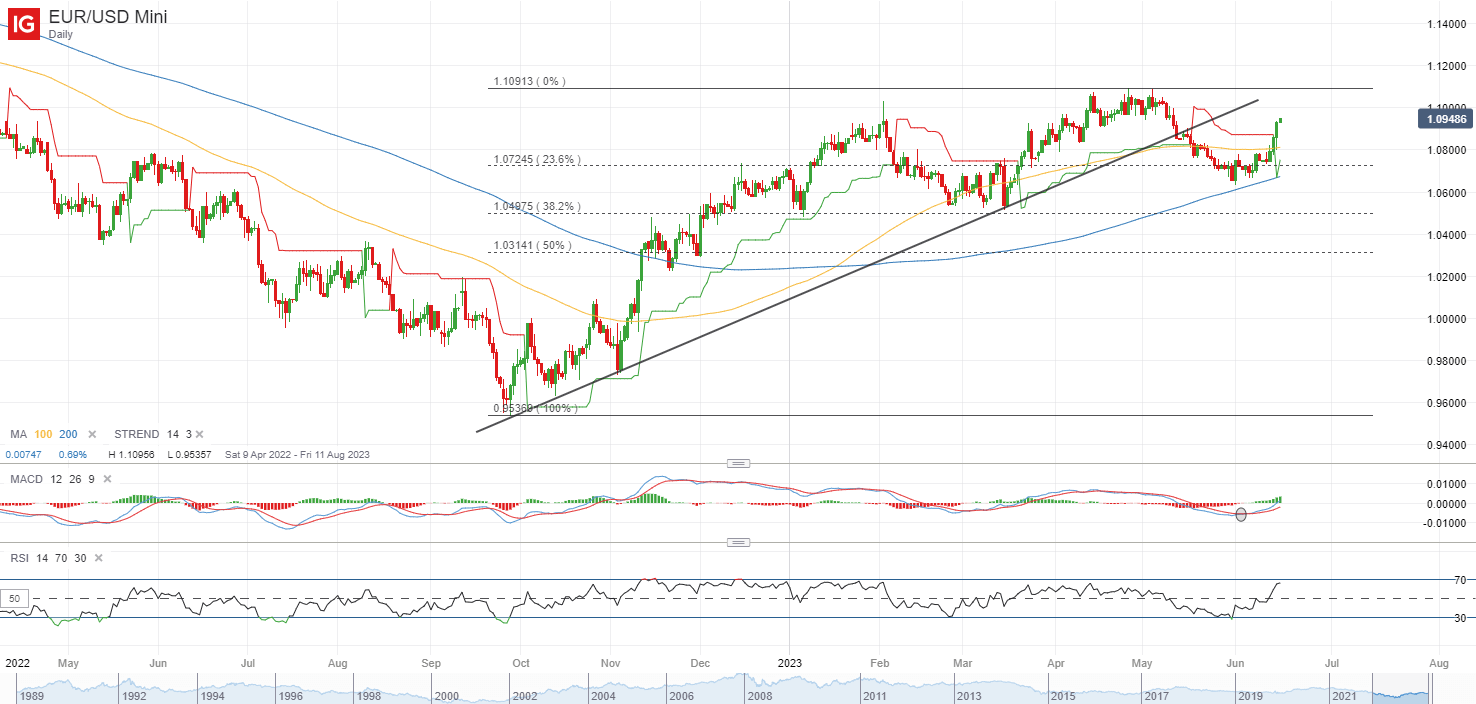
The conclusion of both the FOMC and ECB meeting this week has allowed the EUR/USD to reclaim its 100-day MA, as the US dollar failed to sustain its recent gains while the ECB pushed on with a hawkish guidance at its latest meeting. Policy divergence remains the key driving force.

Following a 25 basis-point move yesterday, an upward revision in inflation forecast from the ECB points to stickier pricing pressures and that more needs to be done. Validation was further sought from the ECB President Christine Lagarde, who anchored expectations for another hike in July and pushed back against any impending policy pause in its hiking cycle.

A switch in the Supertrend indicator from red to green indicated that the trend for EUR/USD has tilted to the upside. The RSI has also headed back above the key 50 level, reflecting buyers taking control after a 4% retracement in May this year. With the formation of a new higher low, the pair may set its sight on its May 2023 high at the 1.109 level, with any move above the level pointing to a new higher high and reinforces the overall upward trend.

image3.png

Japanese Yen Slips as BOJ Keeps Policy Unchanged: What’s Next for USD/JPY?

Japanese Yen Slips as BOJ Keeps Policy Unchanged: What’s Next for USD/JPY?

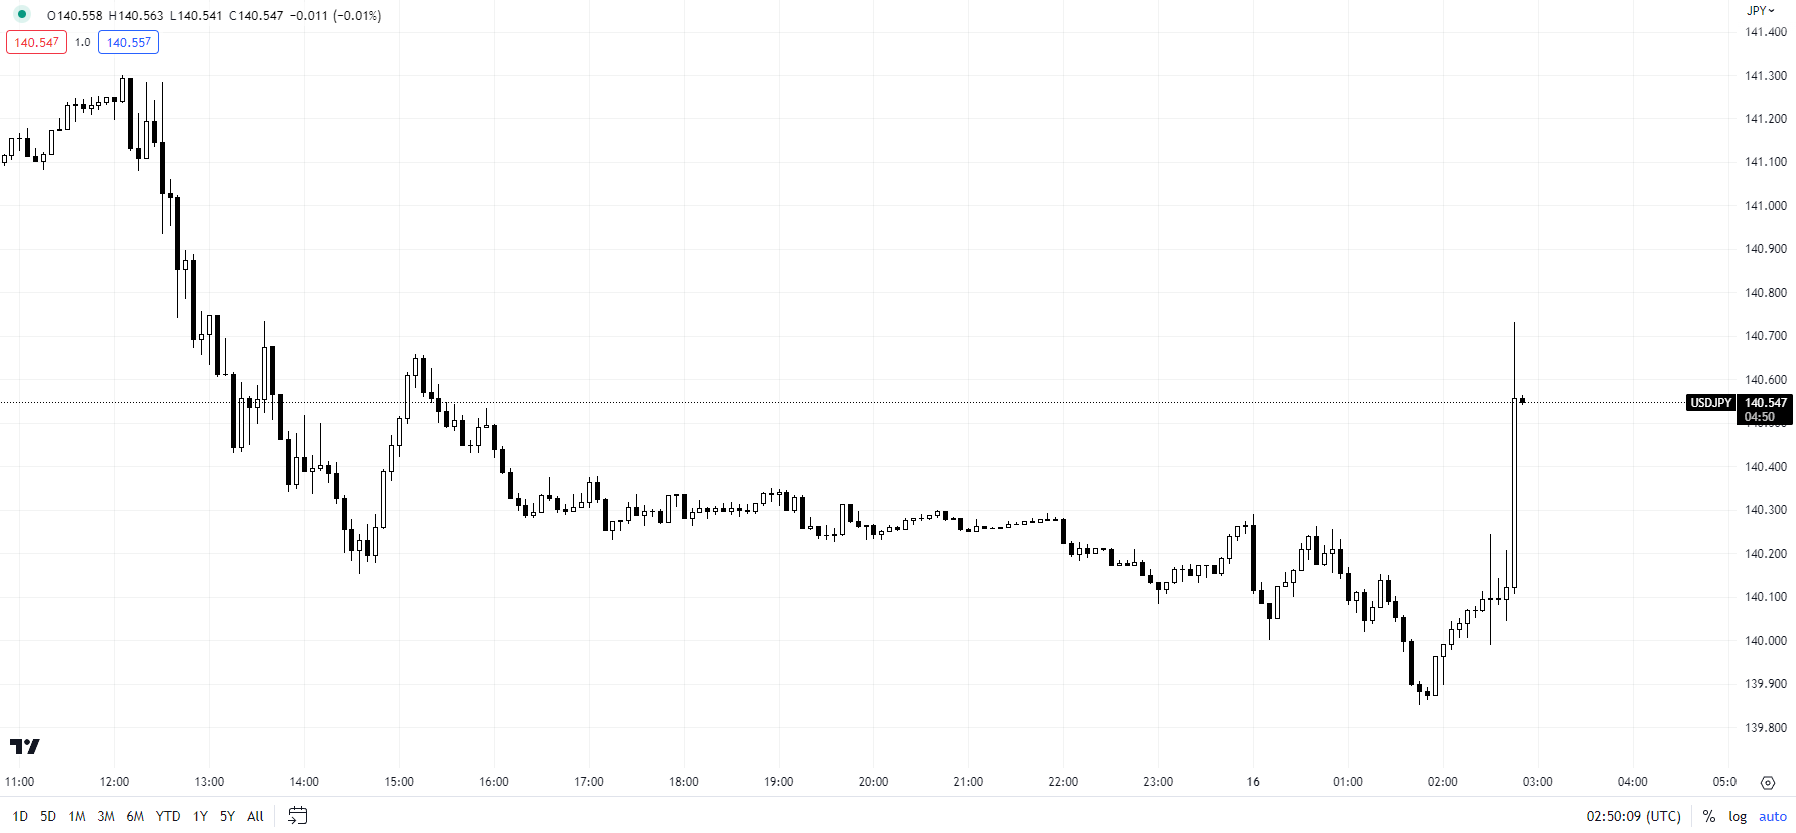
The Japanese yen fell slightly against the US dollar after the Bank of Japan’s (BOJ) maintained ultra-loose policy settings, especially the closely watched yield curve control (YCC) policy, in a bid to support the nascent economic recovery and sustainably achieve its inflation goal.

The BOJ was widely expected to maintain its ultra-easy monetary policy at Friday’s meeting after BOJ Governor Kazuo Ueda said last month the central bank would ‘patiently’ maintain the current policy as there is still some way to achieve its 2% inflation target stably and sustainably. The central bank on Friday said that the uncertainty regarding Japan’s economy is ‘very high’.

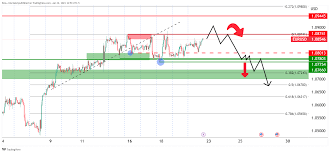
USD/JPY 5-Minute Chart

image1.png

Chart Created Using TradingView

Ueda has also said the central bank expects inflation to slow below 2% toward the middle of the current fiscal year and rebound thereafter. Last week, Ueda added the country’s corporate price-setting behaviour was showing changes that could push up inflation more than expected.

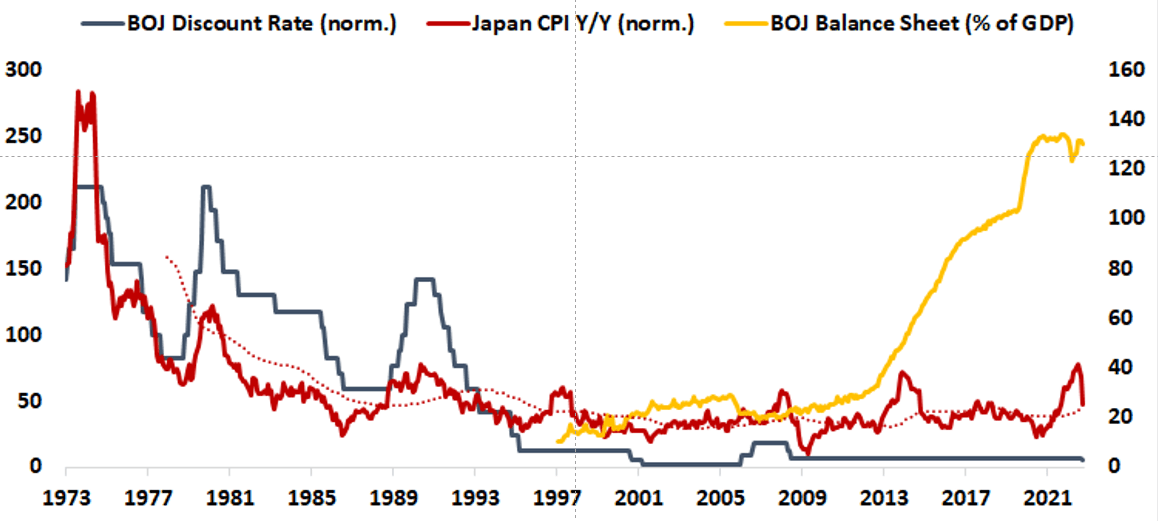
Japan’s core inflation hit 3.4% in April, well over BOJ’s 2% target, and it would be a matter of time before the YCC policy is adjusted. The BOJ removed its long-standing forward guidance at its April meeting while nimbly responding to developments in economic activity and prices. This makes the July 28 meeting a ‘live’ one.

Japan Inflation and BOJ Balance Sheet

A picture containing text, plot, line, screenshot  Description automatically generated

Source data: Bloomberg; chart created in Microsoft Excel

For the low-yielding yen, higher for longer US interest rates, easing fears of a hard landing in the US, and still-hawkish global central banks reinforce the broader bearish setup. For more details see “Japanese Yen Drops After FOMC: Price Setups in USD/JPY, AUD/JPY, GBP/JPY,” published June 15.

However, the yen’s weakness appears to be more pronounced against currencies where central banks are in rate hiking mode, including the RBA, BOC, BOE, and ECB, but less so central banks have paused (Fed) or where central banks have indicated that rates are at a peak (NZD). For more discussion see “Making Sense of Japanese Yen’s Recent Slide: Is it the Start of a Renewed Leg Lower?”, published June 1, and “Japanese Yen Week Ahead as Fed Skip Bets Grow: USD/JPY, EUR/JPY, AUD/JPY”, published June 5.

USD/JPY Daily Chart

image3.png

Chart Created Using TradingView

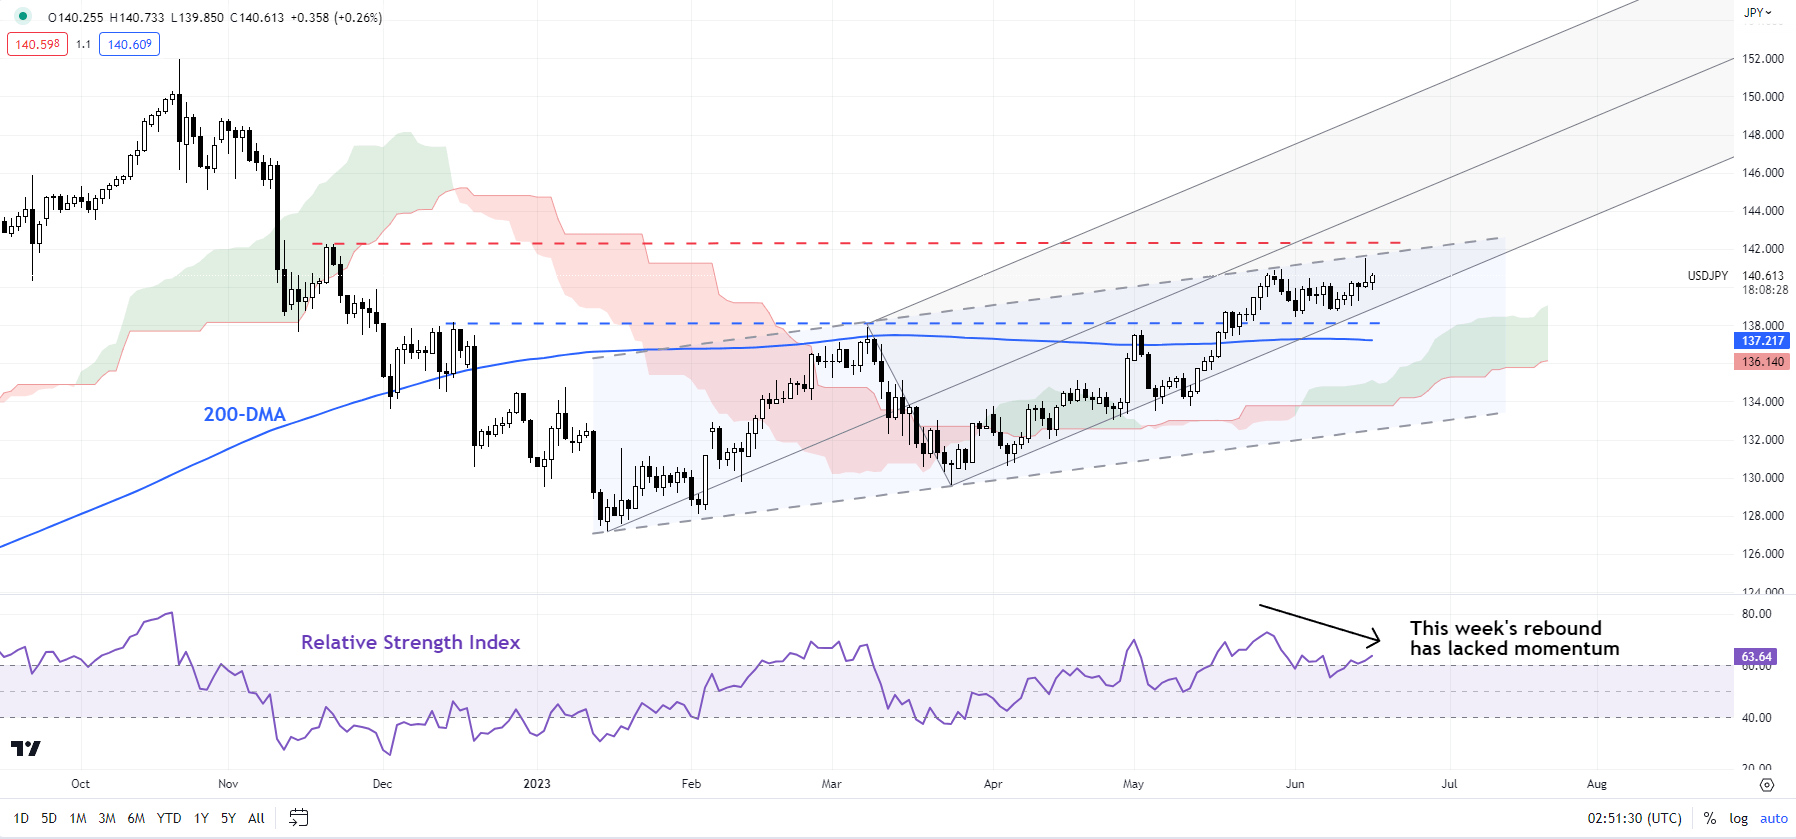
On technical charts, USD/JPY has been flirting with a stiff converged resistance: the upper edge of a rising channel from early 2023, coinciding with the end-2022 high of 142.25, not too far from the median line of a pitchfork channel from January (at about 143.75).

The bearish inverted hammer candlestick pattern on the daily candlestick chart on Thursday has raised the bar for an imminent break above the key resistance. However, as highlighted in theprevious update, the pair would need to break below the early-June low of 138.50 for the upward pressure to fade.

Gold Price Outlook Steadies After a Test Lower that May Prove Pivotal. Higher XAU/USD?

Gold Price Outlook Steadies After a Test Lower that May Prove Pivotal. Higher XAU/USD?

Gold has tried lower but rallied off the floor after the US Dollar took a turn in the aftermath of rate decisions from the Federal Reserve and the European Central Bank this week.

GC1 (GOLD FRONT FUTURES CONTRACT) TECHNICAL ANALYSIS

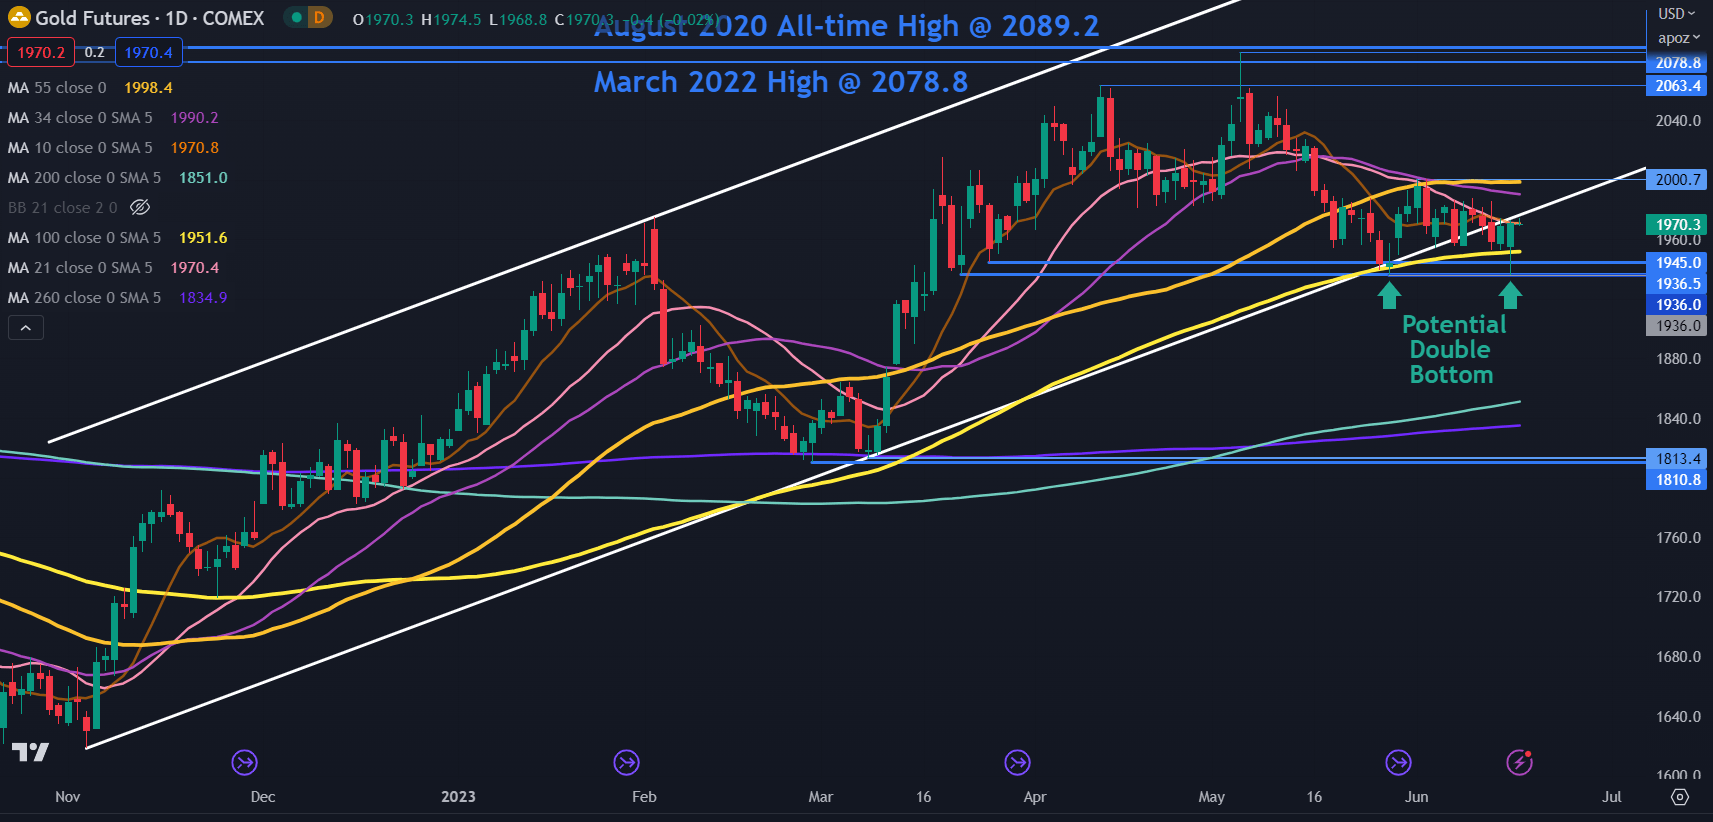
Gold’s recent dip below an ascending trend line and subsequent test of support levels in the 1936 – 1945 area might ask more questions than it answers.

Thursday’s low of 1936 has set up a potential Double Bottom that coincides with a previous low. The potential Double Bottom could be confirmed should it move above the neckline at 2000.

The push lower went under the 100-day Simple Moving Average (SMA) but the daily close was back above it.

This may suggest that recent bearishness could have been rejected by the market for now and that the 1936 – 1945 zone might remain supportive.

A clean break below that area may see a bearish run evolve, and the next support zone of note could be at the next Double Bottom of 1811 and 1813.

While the price is above the 100-, 200- and 260-day SMAs, it remains below all other shorter-period SMAs. If gold gets above the 55-day SMA, currently dissecting at 2000, it will be above all period daily SMAs, which may suggest that bullish momentum is evolving.

This potentially opens up 2000 as a critical level for gold to overcome if it is to reignite bullish momentum.

If it does break above 2000, it could run for the crucial resistance zone ahead of the all-time high.

The early May high of 2085 eclipsed the March 2022 peak of 2079 but was unable to overcome the all-time high of 2089. This failure to break new ground to the upside has created a Triple Top which is an extension of a Double Top formation.

This has set up a potential resistance zone in the 2080 – 2090 area but a snap above those levels may indicate further evolving bullishness. The next level of resistance could be at the upper ascending trend channel line that is currently near 2190.

image1.png


The CPI and Forex: How CPI Data Affects Currency Prices

The CPI and Forex: How CPI Data Affects Currency Prices

What is CPI and why does it matter to forex traders?

The Consumer Price Index, better known by the acronym CPI, is an important economic indicator released on a regular basis by major economies to give a timely glimpse into current growth and inflation levels.

Inflation tracked through CPI looks specifically at purchasing power and the rise of prices of goods and services in an economy, which can be used to influence a nation’s monetary policy.

CPI is calculated by averaging price changes for each item in a predetermined basket of consumer goods, including food, energy, and also services such as medical care.

It is a useful indicator for forex traders due to its aforementioned effect on monetary policy and, in turn, interest rates, which have a direct impact on currency strength. The full utility of knowing how to interpret CPI as a forex trader will be explored below.

CPI release dates

CPI release dates usually occur every month, but in some countries, such as New Zealand and Australia, quarterly. Some nations also offer yearly results, such as Germany’s index. The US Bureau of Labor Statistics has reported the CPI monthly since 1913.

The following table shows a selection of major economies and information about their CPI releases.

Country/jurisdiction Compiling body Frequency of releases
Australia Australian Bureau of Statistics Quarterly
Canada Statistics Canada Monthly
China National Bureau of Statistics of China Monthly
Eurozone European Central Bank Twice monthly
Germany Federal Statistical Office of Germany Monthly, yearly
Italy Istat Monthly
India Ministry for Statistics and Programme Implementation Monthly
Japan Statistics Japan Monthly
UK Monetary Policy Committee Monthly
US US Bureau of Labor Statistics Monthly

Why forex traders should follow CPI data

Understanding CPI data is important to forex traders because it is a strong measure of inflation, which in turn has a significant influence on central bank monetary policy.

So how does CPI affect the economy? Often, higher inflation will translate to higher benchmark interest rates being set by policymakers, to help dampen the economy and subdue the inflationary trend. In turn, the higher a country’s interest rate, the more likely its currency will strengthen. Conversely, countries with lower interest rates often mean weaker currencies.

The release and revision of CPI figures can produce swings in a currency’s value against other currencies, meaning potentially favorable volatility from which skilled traders can benefit.

Also, CPI data is often recognized as a useful gauge of the effectiveness of the economic policy of governments in response to the condition of their domestic economy, a factor that forex traders can consider when assessing the likelihood of currency movements.

The CPI can also be used in conjunction with other indicators, such as the Producer Price Index, for forex traders to get a clearer picture of inflationary pressures.

What to consider when trading forex against CPI data

When using CPI data to influence forex trading decisions, traders should consider the market expectations for inflation and what is likely to happen to the currency if these expectations are met, or if they are missed.

Similar to any major release, it may be beneficial to avoid having an open position immediately before. Traders might consider waiting for several minutes after the release before looking for possible trades, since forex spreads could widen significantly right before and after the report.

Below is a chart displaying the monthly inflation rates for the US. For the latest month, expectations are set at 1.6% inflation compared to last year’s data. If CPI is released higher or lower than expectations this news event does have the ability to influence the market.
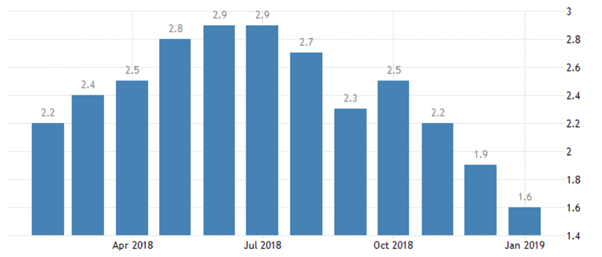
Chart to show US inflation levels in 2018/19. Source: TradingEconomics.com. US Bureau of Labor Statistics

One way the effects of CPI data can be interpreted is by monitoring the US Dollar Index, a 2018/19 example chart for which is below. If CPI is released away from expectations, it is reasonable to believe this may be the catalyst to drive the Index to fresh highs, or to rebound from resistance.

Since the Index is comprised of EUR/USD, USD/JPY, and GBP/USD, by watching the US Dollar we can get a full interpretation of the events outcome.
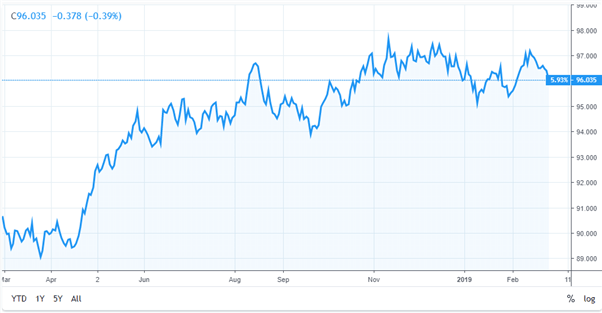
Chart to show movement in the US Dollar Index. Source: TradingView.com

As can be observed in the example above, as inflation rose during the first half of 2018, the US Dollar Index went up accordingly. But with US inflation drifting lower in the following months and with a missed target of 2%, this pushed US interest rate hikes off the agenda. As a result, the dollar struggled and weakened against a basket of other currencies.

Not every fundamental news release works out through price as expected.

Once the CPI data has been released and analyzed, traders should then look to see if the market price is moving through or rebounding off any areas of technical importance. This will help traders understand the short-term strength of the move and/or the strength of technical support or resistance levels, and help them make more informed trading decisions.

Read more on CPI, inflation and forex

Make sure you bookmark our economic calendar to stay tuned in to the latest CPI data released by a range of countries, and stay abreast of all the DailyFX news and analysis updates. Also, reserve your place at our Central Bank Weekly webinar series to learn about news events, market reactions, and macro trends.

For more information on inflation and its impact on forex decisions, take a look at our article Understanding Inflation for Currency Trading.