EUR/USD stays on the back foot below 1.0950, ECB-speak eyed

EUR/USD stays on the back foot below 1.0950, ECB-speak eyed

EUR/USD is trading on the defensive below 1.0950 in early Europe this Monday. The pair is weighed down by the US Dollar bounce and risk aversion, as investors digest US-Sino headlines amid mounting Chinese growth fears. ECB-speak will be in focus. US markets are closed on account of Juneteenth.

EUR/USD extended its weekly rally and reached its highest level since May 11 at 1.0962 on Friday before retreating modestly. Hawkish European Central Bank (ECB) rhetoric allows the Euro to outperform its rivals but the technical outlook points to overbought conditions in the near term.

The ECB raised its key rates by 25 basis points (bps) in June as expected. The policy statement revealed that Eurosystem staff revised core inflation projections for 2023 and 2024 higher. In the post-meeting news conference, ECB President Christine Lagarde all but confirmed one more 25 bps hike at the next meeting.

“Bearing a material change to our baseline, it is very likely the case that we will continue to raise rates in July, which probably doesn’t come as a surprise,” Lagarde told reporters. She also downplayed softer HICP readings from the Euro Area and reiterated that inflation is projected to remain “too high for too long.”

Lagarde’s hawkish tone, combined with upward revisions to inflation forecasts, fuelled EUR/USD’s rally on Thursday.

On the other hand, the US Dollar stayed under persistent selling pressure after disappointing Initial Jobless Claims data, which came in at 262,000 in the week ending June.

Ahead of the weekend, the University of Michigan’s Consumer Sentiment Survey for June will be featured in the US economic docket. With the Federal Reserve’s (Fed) blackout coming to an end on Friday, Fed officials are likely to comment on the policy outlook as well. The CME Group FedWatch Tool shows that markets are pricing in a 25 bps Fed rate increase in July. In case policymakers try to steer markets toward a rate increase at the next policy meeting, the USD could stage a rebound, causing EUR/USD to edge lower.

Nevertheless, ECB policymakers don’t seem to be wasting anytime to reassure investors about their intentions to stick to tight policy, allowing the Euro to hold its ground. ECB policymaker and Bundesbank Chief Joachim Nagel said that inflation risks are still tilted to the upside and Governing Council member Gediminas Šimkus noted that he wasn’t expecting a rate cut early next year.

Asia Day Ahead: Wall Street Rally Pauses Ahead of Series of Fedspeak

Asia Day Ahead: Wall Street Rally Pauses Ahead of Series of Fedspeak

With the conclusion of the recent Federal Open Market Committee (FOMC) meeting, a series of hawkish Fedspeak is lined up on the horizon. We have a glimpse from Fed Governor Christopher Waller and Richmond Fed President Thomas Barkin last Friday, with persistent core inflation still at the top of their minds and that more tightening may need to be done.

Nevertheless, market participants continue to have their doubts, with interest rate futures firmly in the camp that the Fed will head towards its final phase of tightening with one last 25 basis-point (bp) move in July and rate cuts as early as next year. All eyes will be on Fed Chair Jerome Powell, who will have the opportunity to justify his hawkish stance with his testimony to the US Senate Banking Committee this week. Sticking to his usual script may potentially have limited impact in swaying rate expectations and he will have to provide greater conviction that his guidance at the Fed meeting is more than just a jawbone.

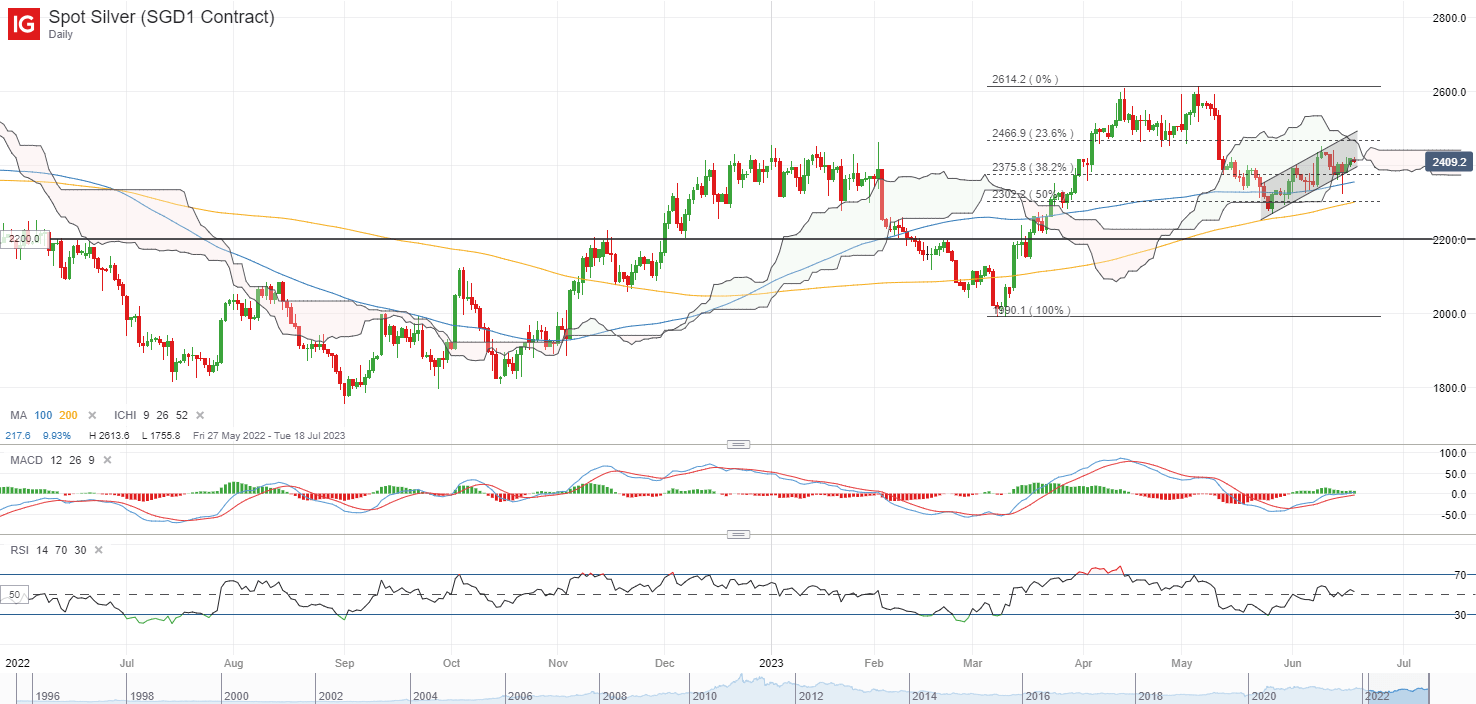
US market will be off for the Juneteenth holiday today, which could bring a quiet start to the new trading week for global markets. Treasury yields largely held firm last Friday, with the two-year and ten-year yields up 8 bp and 5 bp respectively, allowing the US dollar some slight reprieve following recent post-Fed sell-off. Perhaps one to watch will be silver prices, which saw some dip-buying with a long-tailed candle last week. Thus far, buyers have managed to defend a key support confluence at a lower trendline of a rising channel pattern (US$23.80 level), along with the lower edge of its Ichimoku cloud on the daily chart. That may leave the US$24.70 level on watch as the next resistance to overcome, while on the other hand, any breakdown of the channel pattern may place the US$23.00 level in sight.

image1.png

Asia Open

Asian stocks look set for a mixed open, with Nikkei -0.38%, ASX +0.24% and KOSPI -0.70% at the time of writing. US Secretary of State Antony Blinken’s visit to Beijing has been on the radar, with extended “candid” and “constructive” talks on Sunday at least showing some willingness to cooperate, although whether that will lead to any actual positive outcomes still awaits to be seen. Any inaction on that front could still see any optimism fizzle out eventually.

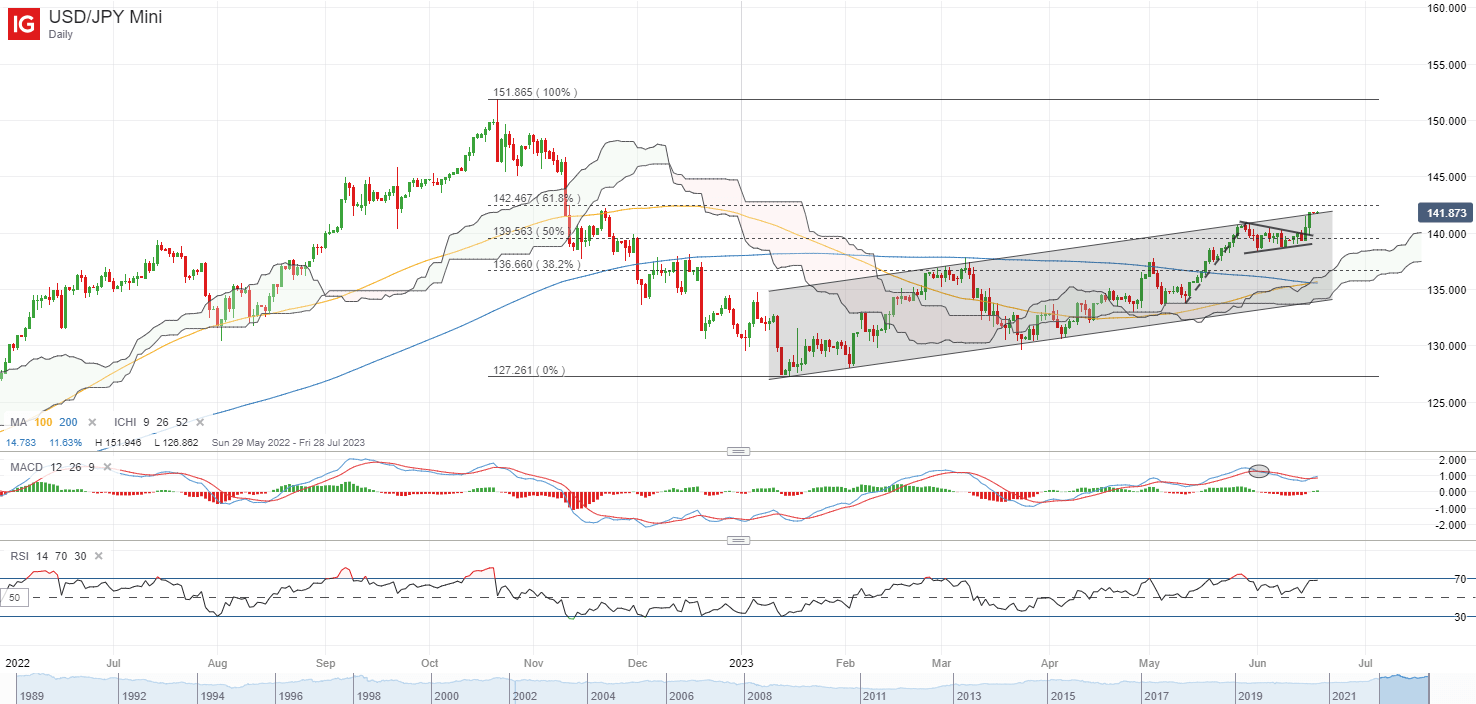
To conclude last week, the Bank of Japan (BoJ) has kept rates on hold in a widely-expected move, with its yield curve control held unchanged as well. Any tweak to its yield curve control policy will likely come as a surprise in the likes of that in December last year, but at least for now, maintaining their view that inflation will slow over the coming months seem to suggest that it will take some time. The USD/JPY is back to retest an upper channel trendline resistance currently, with a bullish crossover formed between its 100-day and 200-day moving average (MA). Any successful move past the channel resistance may then leave the 145.20 level on watch next.

image2.png

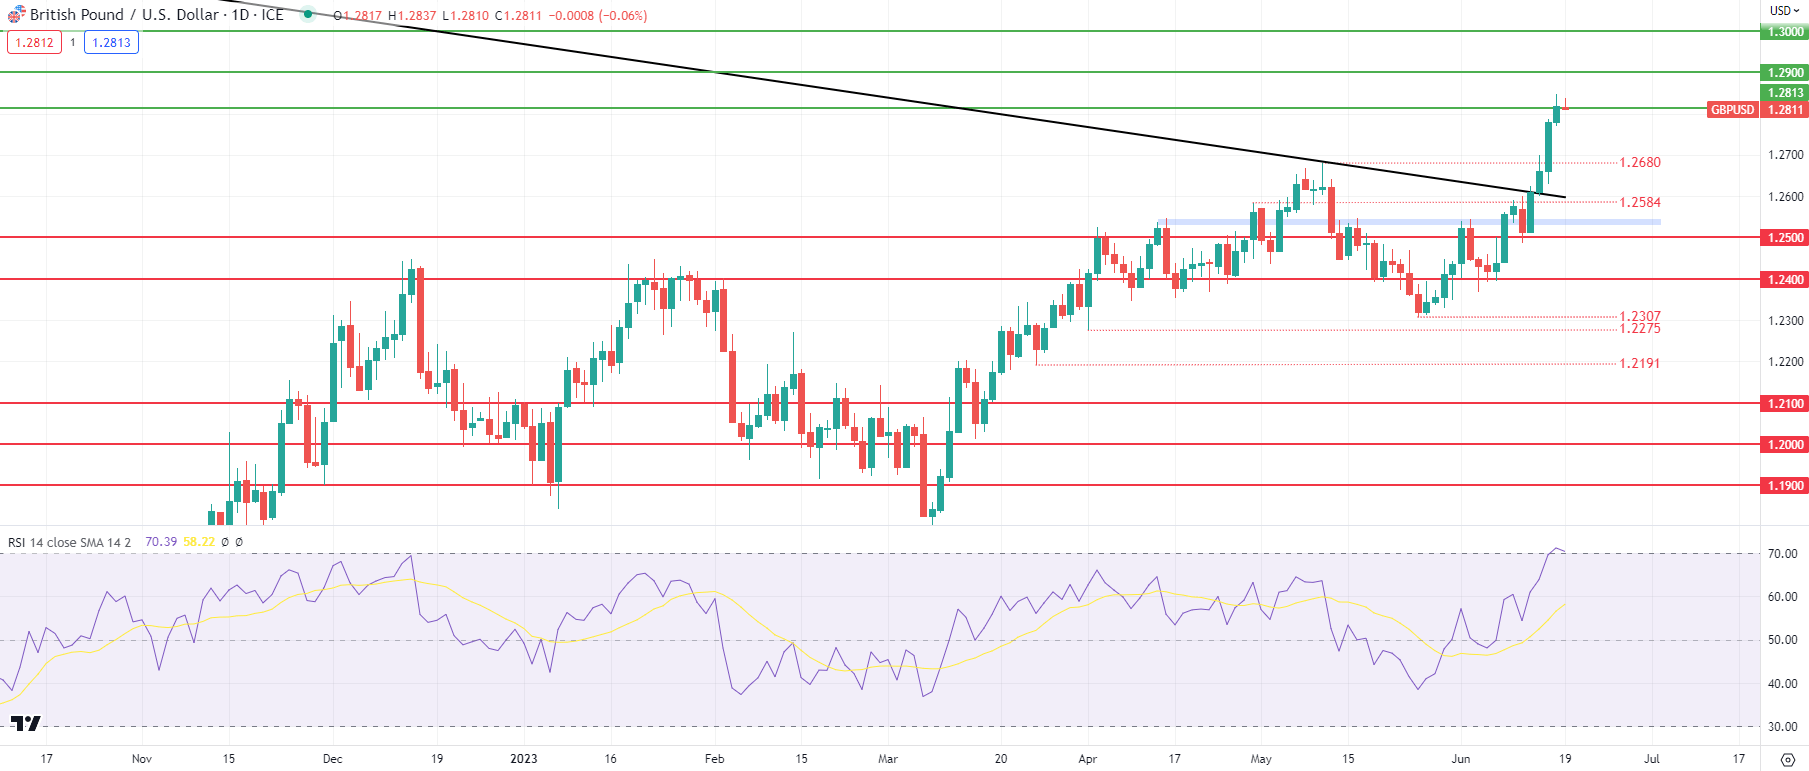
On the watchlist: GBP/USD at 13-month high ahead of Bank of England (BoE) meeting this week

Ahead of the BoE meeting this week, more persistent pricing pressures in the UK has led markets to price for another relentless grind higher in interest rates from the BoE, with 125 bp worth of tightening expected over the coming months. In the Governor Andrew Bailey’s own words, inflation is ‘taking a lot longer’ than hoped to come down, as UK April core inflation rose to the highest since records began in 1992 (6.8%).

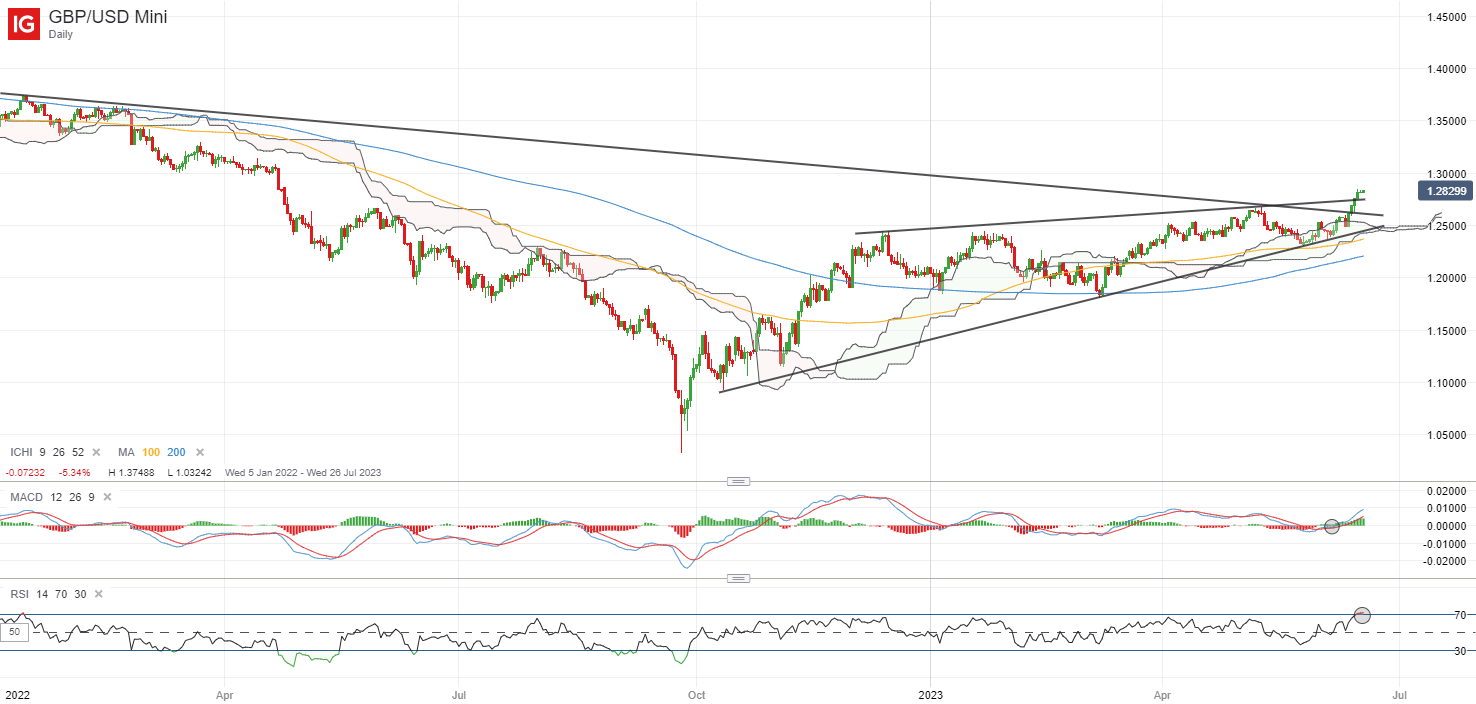
This contrasts with broad expectations for one last 25 bp hike from the Fed in July, paving the way for GBP/USD to push to its 13-month high on the Fed-BoE policy divergence. Further validation from the BoE this week that rates will go higher-for-longer may provide room for more upside in the GBP.

Recent upmove for the pair has marked a break above a rising wedge pattern on the daily chart, along with a key downward trendline resistance in place since June 2021. Its RSI hangs above the key 50 level, while an increasing MACD points to building upward momentum. The formation of higher highs and higher lows suggest that the overall trend remains up, placing the 1.316 level on watch next for a retest. On the downside, a series of support lines remain in focus to potentially underpin a higher low (200-day MA, Ichimoku cloud, lower wedge trendline), with immediate support at the 1.265 level.

image3.png

GBP/USD Price forecast: BoE Eyes UK CPI Ahead of Rate Decision

GBP/USD Price forecast: BoE Eyes UK CPI Ahead of Rate Decision

GBPUSD FUNDAMENTAL BACKDROP

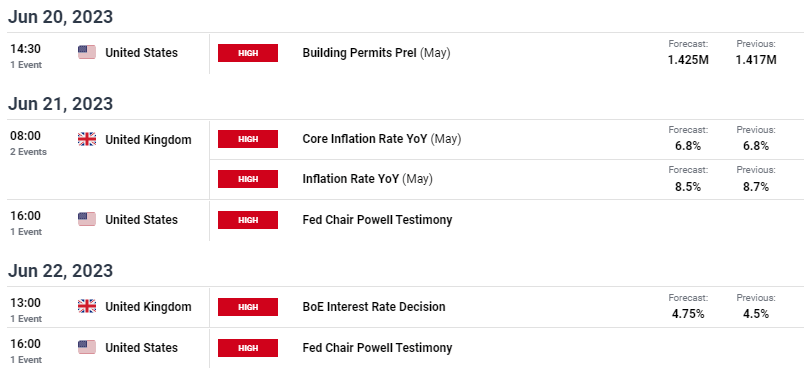
The British pound has held on to it’s gains from last week, despite being marginally weaker against the US dollar. This comes on the back of a hawkish rhetoric surrounding the Bank of England (BoE)’s upcoming interest rate decision (see economic calendar below). Recent robust jobs data and elevated inflation levels will most likely keep the 25bps increment on the table regardless of what happens with UK CPI. Money markets are currently pricing in a 73% chance of a 25bps hike alongside roughly 125bps of cumulative rate hikes for 2023. This may be slightly too optimistic considering global recessionary fears and may angle cable for a leg lower.

BANK OF ENGLAND INTEREST RATE PROBABILITIES

image1.png

From a USD perspective, Fed chair Jerome Powell is scheduled to testify at the US Senate Banking Committee and will surely drive some market volatility in what is a relatively quiet week for US data.

UK ECONOMIC CALENDAR (GMT +02:00)

image2.png

TECHNICAL ANALYSIS

GBP/USD DAILY CHART

image3.png

Australian Dollar Softens After Bull Run. Will AUD/USD Test Support Levels?

Australian Dollar Softens After Bull Run. Will AUD/USD Test Support Levels?

The Australian Dollar has eased lower to start Monday after a stellar rally last week that posted a 4-month peak.

Rock solid jobs data revealed an unemployment rate of 3.6% and has opened the prospect of an RBA hike in a fortnight’s time. The interest rate market is pricing around a 50-50 chance of a 25 basis point lift at their monetary policy meeting on July 4th.

It is a holiday in the US today and it may contribute to less liquid trading conditions.

AUD/USD TECHNICAL ANALYSIS

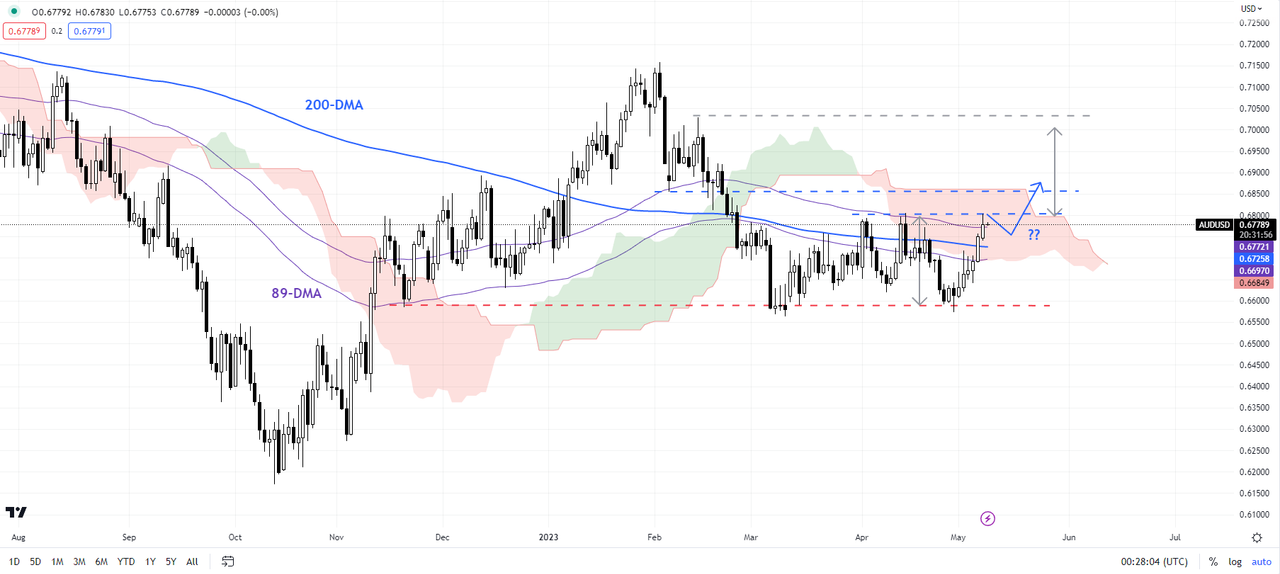
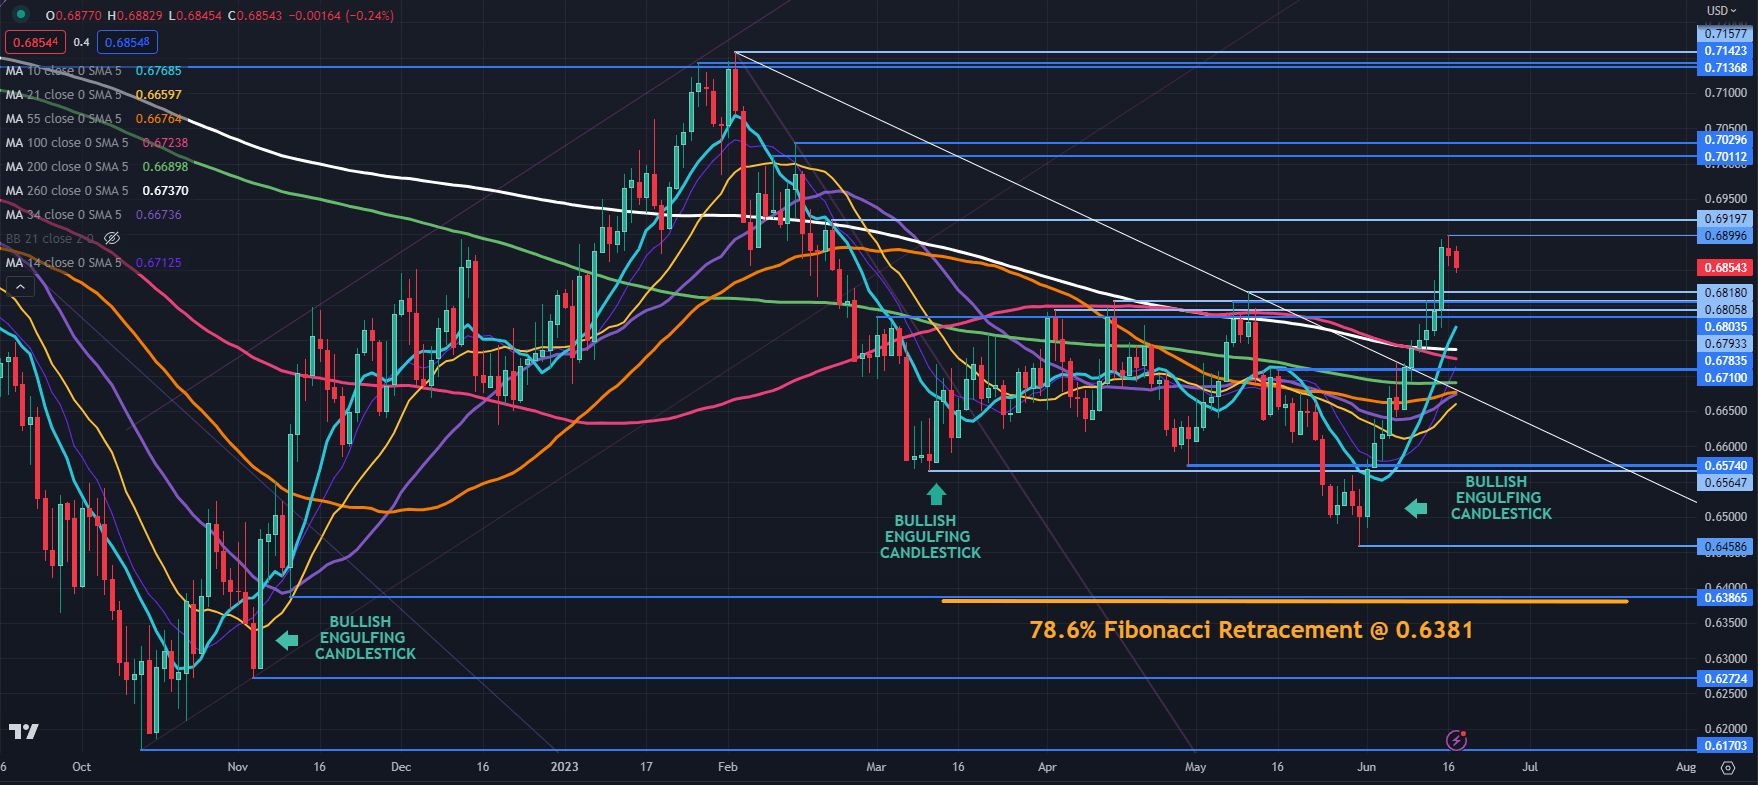
AUD/USD shot to a high just shy of 69 cents last week, not far from a prior peak of 0.6920. Those levels might offer resistance should the rally resume.

Further up, resistance could be at the previous peaks of 0.7011 and 0.7030 ahead of a cluster zone in the 0.0.7137 – 0.7157 area.

The run-up in the Aussie started after a Bullish Engulfing Candlestick formation emerged and proved to be a salient signal on this occasion.

This technical indicator has previously been worthwhile watching and might be something to keep an eye on going forward. It should be noted though that past performance is not indicative of future results.

On the downside, prior resistance levels between 0.6780 – 0.6820 might now become a breakpoint support area.

Below there, the 10-, 14-, 21-, 34, 55-, 100-, 200- and 260-day Simple Moving Average (SMA) all lie between 0.6660 and 0.6769. Given the significant movement in AUD/USD, it is unusual for all of these SMAs to be bunched reasonably close to one another.

If the price remains above these SMAs, it could be suggesting that bullish momentum is evolving. If it went below these SMAs, it may indicate that the bullishness may no longer persist, and bearish momentum might unfold.

Support could be at the breakpoints of 0.6710, 0.6574 and 0.6565 or the late May low of 0.6458.

Further down, support may lie at the prior low of 0.6387 and the nearby Fibonacci level of 0.6381. The latter is the 78.6% Fibonacci Retracement of the move from the low of 0.6170 to the peak of 0.7158.

AUD/USD DAILY CHART

image1.png


Euro After ECB Rate Hike: EUR/USD, EUR/AUD, EUR/GBP Price Setups

Euro After ECB Rate Hike: EUR/USD, EUR/AUD, EUR/GBP Price Setups

The euro could attempt to recoup some of the recent losses against some of its peers, thanks to the European Central Bank’s (ECB) hawkish hike, oversold conditions, and a spate of underwhelming Euro area macro data. However, still-elevated speculative long EUR positioning could limit the gains.

EUR has rebounded against the US dollar, but has continued to soften against the Australian dollar and the British pound, as forecast in the previous update – see “Ahead of Euro Area Inflation: EUR/USD, EUR/GBP, EUR/AUD Price Setups,” published May 30.

The ECB raised interest rates by 25 basis points last week to the highest level in 22 years and signaled more rate hikes in coming months. Back in May, the mention that the tightening of financial conditions is “forcefully” trickling through the economy gave an impression that ECB could be nearing a pause in its tightening campaign. However, ECB President Christine Lagarde’s remarks last week that the central bank has still ground to cover indicates the ECB is in no mood to pause just yet, aiding EUR.

Economic Surprise Index and FX Positioning

image1.png

Source Data: Bloomberg

Euro area macro data have underwhelmed in recent weeks, as reflected in the Euro area economic surprise index (ESI). However, as the chart shows, the series tends to be mean reverting, suggesting the bar for further downside surprise in the bloc appears to be low. Better-than-expected incoming data could support the single currency.

Having said that, despite the recent correction, speculative long EUR positioning is still running around the highest since 2020 and within the major currency space (see chart), suggesting continued overcrowded conditions for the single currency.

EUR/USD Daily Chart

image2.png

EUR/USD: Upside capped?

On technical charts, EUR/USD has rebounded from near quite strong support area: the March low of 1.0510, near the 200-day moving average. However, the pair has run into stiff resistance on the upper edge of the Ichimoku cloud on the daily charts (at about 1.0970). Also, on the higher timeframe charts, the 14-month Relative Strength Index has been capped around 50-55 – a barrier for corrective rallies.

EUR/USD Monthly Chart

image3.png

The upshot of the above is that EUR/USD may need to consolidate a bit further within the slightly upward-sloping channel since February before a fresh trend ensues. Above 1.0970, there is resistance at the May high of 1.1100. On the downside, 1.0550-1.0650 offers quite a strong cushion.

EUR/GBP Daily Chart

image4.png

EUR/GBP: Due for a minor rebound?

EUR/GBP looks oversold as it tests a key floor at the December low of 0.8545. Moreover, the cross has met the price objective of the sideway channel. A minor rebound can’t be ruled out in the short term. Such a rebound could be capped around the mid-June high of 0.8620. On the downside, a decisive break below 0.8545 could pave the way toward the August low of 0.8340.

EUR/AUD Daily Chart

image5.png

EUR/AUD: Approaches strong support

EUR/AUD is approaching a fairly strong floor on the 200-day moving average, coinciding with the mid-May low of 1.5850. The cross looks oversold, raising the prospect of a minor rebound. Any break above last week’s high of 1.6000 could pave the way toward the mid-May low of 1.6130.

Moving Average (MA) Explained for Traders

Moving Average (MA) Explained for Traders

Introduction to Moving Averages:
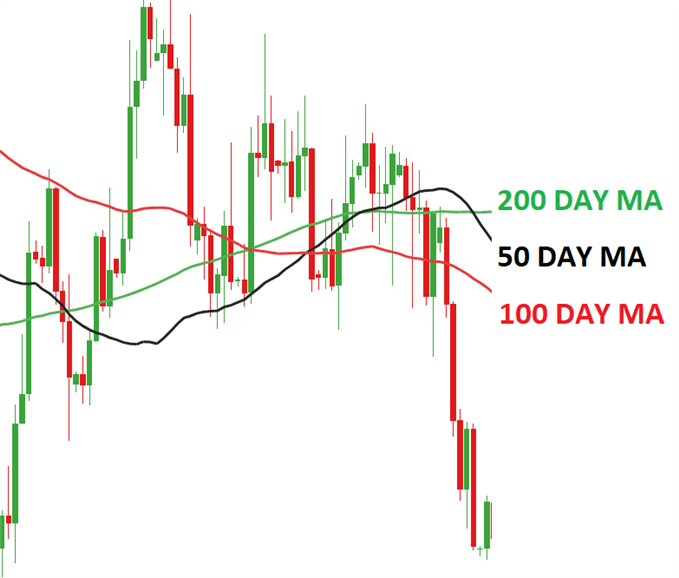
EUR/USD with moving averages

Moving Average – Talking Points:

What is a Moving Average?

In technical analysis, the moving average is an indicator used to represent the average closing price of the market over a specified period of time. Traders often make use of moving averages as it can be a good indication of current market momentum.

The two most commonly used moving averages are the simple moving average (SMA) and the exponential moving average (EMA). The difference between these moving averages is that the simple moving average does not give any weighting to the averages in the data set whereas the exponential moving average will give more weighting to current prices.
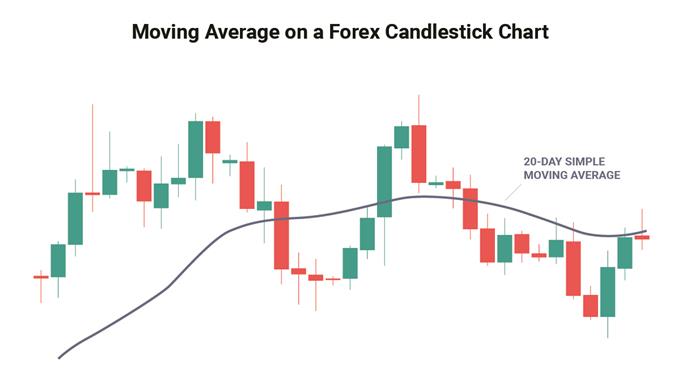
What is a moving average in forex

How do you calculate moving average?

As explained above, the most common moving averages are the simple moving average (SMA) and the exponential moving average (EMA). Almost all charting packages will have a moving average as a technical indicator.

The simple moving average is simply the average of all the data points in the series divided by the number of points.

The challenge of the SMA is that all the data points will have equal weighting which may distort the true reflection of the current market’s trend.

The EMA was developed to correct this problem as it will give more weighting to the most recent prices. This makes the EMA more sensitive to the current trends in the market and is useful when determining trend direction.

The mathematic formula for each can be found below:

Simple Moving Average:

SMA =

Where:

A= Is each of the data points

n = Number of time periods

For example, looking at a 5-day SMA on a daily chart of EUR/USD and the closing prices over the 5 days are as follows:

Day 1: 1.321

Day 2: 1.301

Day 3: 1.325

Day 4: 1.327

Day 5: 1.326

SMA = (1.321 + 1.301 + 1.325 + 1.327 + 1.326)/5

SMA = 6.6/5

SMA = 1.32

Exponential Moving Average:

EMA =

Where:

EMAt​= EMA today

Vt​= Value today

EMAt​ = EMA today

s =smoothing

d = number of days​

Steps for calculating EMA:

1. Calculate the SMA for the particular time period

2. Calculate the multiplier for weighting the EMA using the formula:

[2 ÷ (selected time period + 1)]. So, for a 10-day moving average, the multiplier would be [2/(10+1)]= 0.01818.

3. Use the smoothing factor combined with the previous EMA to arrive at the current value.

For example, looking at a 10-day EMA for a share, the table below displays how the EMA would be calculated:

Date Price 10-day SMA Smoothing Constant 2/(10 + 1) 10-day EMA
1 24-Apr-18 23.24
2 25-Apr-18 22.99
3 26-Apr-18 22.85
4 27-Apr-18 23.00
5 28-Apr-18 22.96
6 29-Apr-18 22.21
7 30-Apr-18 21.99
8 1-May-18 22.43
9 2-May-18 22.24
10 3-May-18 22.55 22.65 22.65
11 4-May-18 22.15 22.54 0.1818 22.56
12 5-May-18 22.39 22.48 0.1818 22.53
13 6-May-18 22.38 22.43 0.1818 22.50
14 7-May-18 22.61 22.39 0.1818 22.52
15 8-May-18 23.36 22.43 0.1818 22.67
16 9-May-18 24.05 22.62 0.1818 22.92
17 10-May-18 23.75 22.79 0.1818 23.07
18 11-May-18 23.83 22.93 0.1818 23.21
19 12-May-18 23.95 23.10 0.1818 23.35
20 13-May-18 23.63 23.21 0.1818 23.40

What is the purpose of moving averages?

The main purpose of the moving average is to eliminate short-term fluctuations in the market. Because moving averages represent an average closing price over a selected period of time, the moving average allows traders to identify the overall trend of the market in a simple way.

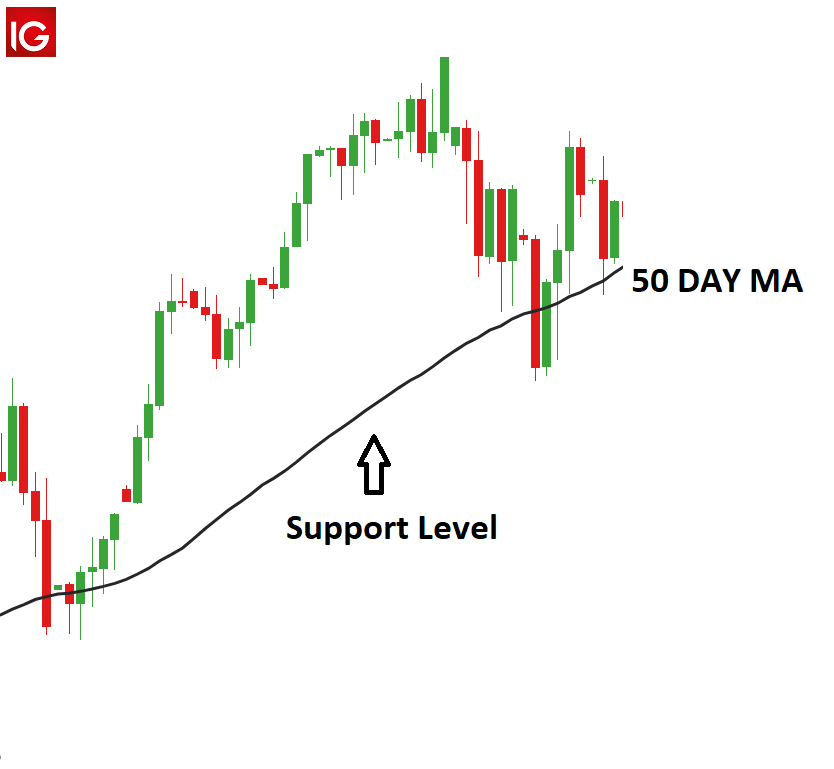
Another benefit of the moving average is that it is a customizable indicator which means that the trader can select the time-frame that suits their trading objectives. Moving Averages are often used for market entries as well as determining possible support and resistancelevels. The moving average often acts as a resistance level when the price is trading below the MA and it acts as a support level when the price is trading above the MA.

How do you interpret moving averages?

There are 3 ways in which trader’s use the moving average:

  • To determine the direction of the trend
  • To determine support and resistance levels
  • Using multiple moving averages for long- and short-term market trends

1. To determine the direction of the trend:

When prices are trending higher, the moving average will adjust by also moving higher to reflect the increasing prices. This could be interpreted as a bullish signal, where traders may prefer buying opportunities.

The opposite would be true if the price was consistently trading below the moving average indicator, where traders would then prefer selling opportunities due to the market signaling a downward trend.

2. The moving average for support and resistance levels:

The moving average can be used to determine support and resistance levels once a trader has placed a trade.

If the trader sees the moving average trending higher, they may enter the market on a retest of the moving average. Likewise, if the trader is already long in an uptrend market, then the moving average can be used as a stop loss level. The opposite is true for down trends.

The charts below are examples of how the moving average can be used as a both a support and a resistance level.
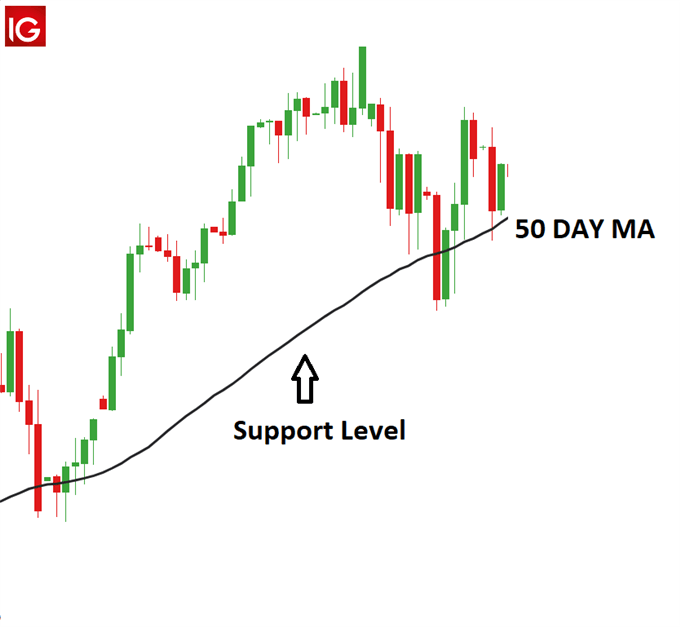
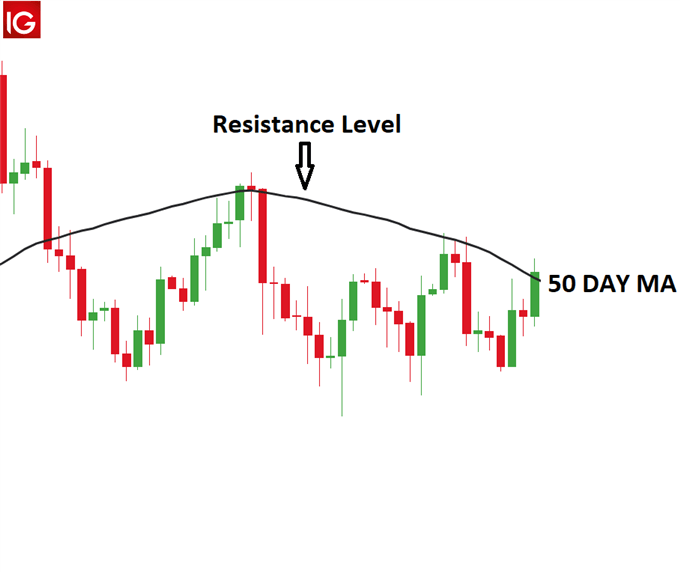
Germany30 with 50 Day MA as supportGold with 50 Day MA as resistance

3.Making use of multiple moving averages

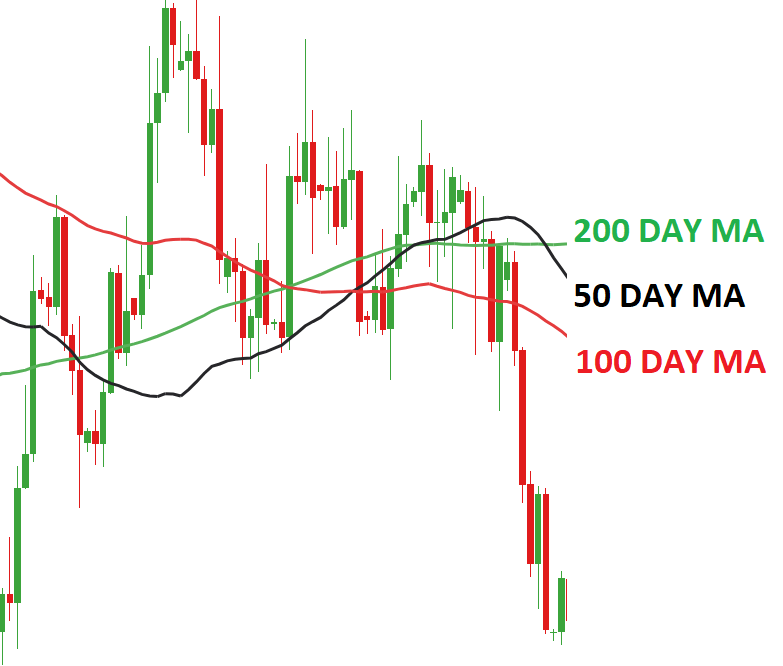
It is common for traders to make use of multiple moving average indicators on a single chart, as depicted in the chart below. This allows traders to simultaneously assess the short and long-term trends in the market. As price crosses above or below these plotted levels on the graph it can be interpreted as either strength or weakness for a specific currency pair.This method of using more than one indicator can be extremely useful in trending markets and is similar to using the MACD oscillator.

When making use of multiple moving averages, many traders will look to see when the lines will cross. This phenomenon is referred to as ‘The Golden Cross’ when a bullish pattern is formed and ‘The Death Cross’ when the pattern is bearish.

A Golden cross is identified when the short-term moving average (such as the 50-day moving average) crosses above the long-term moving average (such as the 200-day moving average), while the Death cross represents the short-term moving average crossing below the long-term moving average. Traders that are long, should view a Death Cross as a time to consider closing the trade while those in short trades should view the Golden Cross as a signal to close out the trade.
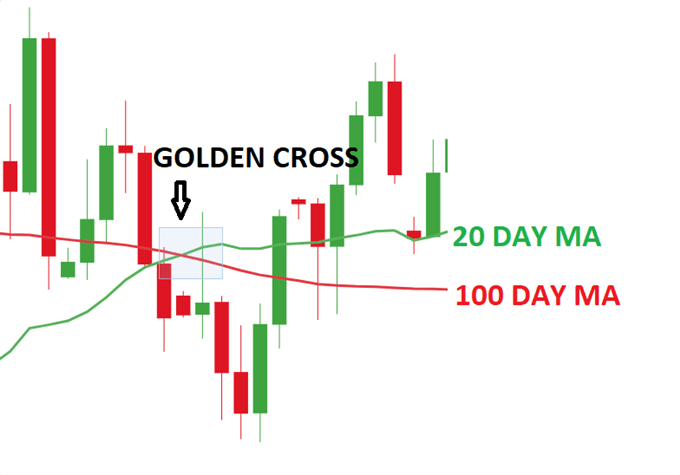
GBP/USD Golden cross

Moving Average Indicator: A Summary

In summary, the Moving Average is a common indicator used by traders to determine trends in the market. Many traders use more than one Moving Average at a time as this gives a more holistic view of the market. Moving averages are often used to determine market entries as well as support and resistance levels.

AUD/USD: Aussie to be well supported in view of hawkish RBA – Commerzbank

AUD/USD: Aussie to be well supported in view of hawkish RBA – Commerzbank

The Australian labour market data for May published yesterday was much better than expected. Economists at Commerzbank analyze AUD outlook after the report.

Surprise rise in employment in Australia fuels rate hike expectations

Employment rose by an impressive 75.9K MoM. The data is likely to add to the Australian central bank’s (RBA) concerns that inflation remains stubbornly at high levels.

The market expects the RBA to take countermeasures and to further hike the key rate compared with the current 4.1%.

Against this background, it would seem that the Aussie, which yesterday also benefitted from a weakening USD, will not continue to rise endlessly. Seeing that the Fed seems willing to implement further rate hikes despite the recent pause we consider AUD to be well supported though in view of an also hawkish RBA.

USD/JPY Price Analysis: Climbs firmly above 141.00 as BoJ continues ultra-dovish policy stance

USD/JPY Price Analysis: Climbs firmly above 141.00 as BoJ continues ultra-dovish policy stance

The USD/JPY pair showed a V-shape recovery from 140.00 after the Bank of Japan (BoJ) Governor Kazuo Ueda announced an unchanged interest rate decision. BoJ Ueda decided to continue monetary stimulus to spur wages and the overall demand as current inflationary pressures in Japan are majorly contributed by higher import prices.

BoJ Ueda has commented that Japan’s headline CPI around 3.5% is due to external, cost-push factors, and cannot be controlled by Japan’s monetary policy.

Meanwhile, the US Dollar Index (DXY) is consistently trading in a narrow range above 102.00 amid an absence of potential triggers ahead.

Economists at ING analyzed the USD Index outlook stating that in the short term, the Dollar may well stay soft against most currencies except the Japanese Yen, with the Bank of Japan remaining resolutely dovish. Here, Yen-funded carry trades will remain popular.

USD/JPY is approaching 61.8% Fibonacci retracement (plotted from 21 October 2022 high at 151.94 to 16 January 2023 low at 127.22) at 142.63 on a daily scale. The asset has refreshed its six-month high at 141.50.

Upward-sloping 20-period Exponential Moving Average (EMA) at 139.38 is providing a cushion to the US Dollar bulls.

The Relative Strength Index (RSI) (14) has shifted into the bullish range of 60.00-80.00, which indicates that the bullish momentum is active.

Going forward, an upside move above a six-month high at 141.50 will drive the asset toward a 61.8% Fibo retracement at 142.58 and 04 October 2022 low at 143.89.

On the flip side, a confident break below June 06 low at 139.09 will drag the asset toward March 08 high at 137.92 followed by March 02 high at 137.10.

USD/JPY daily chart

Foreign trade and import prices – April 2023

Foreign trade and import prices – April 2023

Foreign trade and import prices – April 2023

In April 2023 seasonally-adjusted data, compared to March 2023, decreased by -1.7% for exports and increased by +5.3% for imports. Exports towards EU countries decreased by -1,5% and declined -2,0% for non-EU countries. Imports increased for non-EU countries (+13.9%) and decreased slightly for EU countries (-0.6%).

Over the last three months, seasonally-adjusted data, compared to the previous three months, dropped both for exports (-2.2%) and for imports (-6.5%).

In April 2023, compared with the same month of the previous year, exports decreased by -5.4% and imports dropped by -12.3%. Outgoing flows decreased by -5.7% for EU countries and by -4.9% for non-EU countries. Incoming flows decreased by -5.6% for EU area and dropped by -19.4% for non-EU area.

In April 2023, trade balance registered a surplus of +318 million Euros (-921 million Euros deficit for EU countries and +1,239 million Euros surplus for non-EU countries). Excluding energy, trade balance surplus reached +6,047 million Euros.

In April 2023, import prices decrease by 1.0% on monthly basis (-0.3% for the euro zone, -1.6% for the non-euro zone). Over the last three months, compared to the previous three months, import prices decreased by 5.6% (-0.5% for the euro zone, -10.1% for the non-euro zone).

Import prices, compared to the same month a year ago, decrease by 6.2% in April 2023 (+1.3% for the euro zone and -12.3% for the non-euro zone).