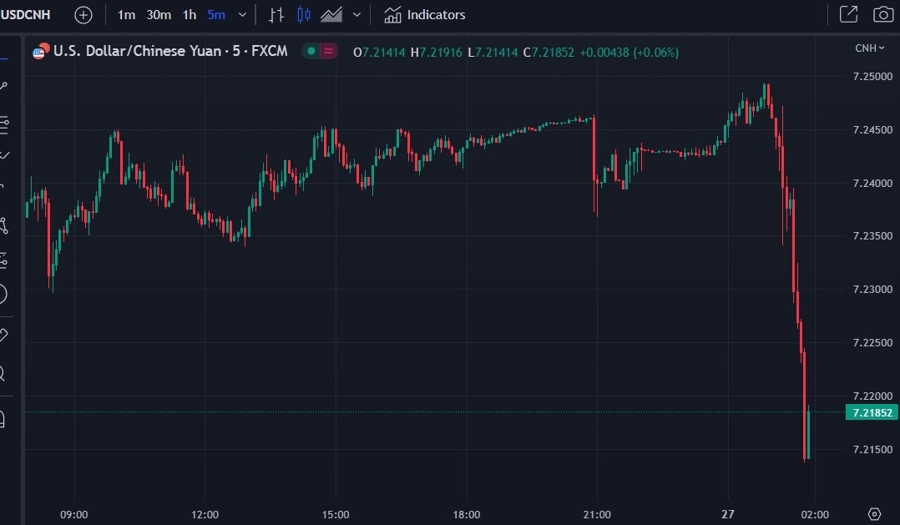
China’s major state-owned banks were seen selling dollars in the offshore spot foreign exchange market on Tuesday, four sources with knowledge of the matter said, suggesting authorities’ wanted to slow the pace of the yuan’s recent slide. Such state bank dollar selling appeared as the offshore yuan weakened towards the psychologically important 7.25 per dollar level, two of the sources said.
High-ranking China official visits Italy, hails Belt and Road memorandum
A high-ranking Chinese Communist Party official has visited Italy amid media reports saying that the European nation is considering a withdrawal from Beijing’s Belt and Road economic zone initiative.
The Communist Party said Liu Jianchao, the head of the International Department of the party’s Central Committee, attended a meeting with businesspeople in Milan on Sunday.
Italy is the only Group of Seven country to have signed a memorandum of understanding on the Belt and Road initiative.
In the meeting, Liu hailed Italy’s signing of the memorandum, saying the country made the right decision, keeping in mind not only the current situation but also the future.
Liu also said the deal would make the two countries more confident in bilateral cooperation and set a good precedent for other countries to follow in building a global network of partnership.
The party said Italian business people expressed their resolute support for continued cooperation between the two countries.
Media in the US and elsewhere have reported that the government of Italian Prime Minister Giorgia Meloni, who took office last year, is weighing a withdrawal from the Belt and Road initiative.
Liu’s visit to Milan came amid growing wariness of China among EU countries. The trip was seen as an attempt by Beijing to keep Italy in the initiative.
FedNow Is Coming in July. What Is It, and What Does It Do?
On March 15, the Federal Reserve announced that the FedNow Service will launch in July 2023. FedNow will “facilitate nationwide reach of instant payment services by financial institutions—regardless of size or geographic location—around the clock, every day of the year.” But what exactly is the FedNow Service, and what does it do? In this article, we describe FedNow at a high level, offer answers to common and anticipated questions about the service, and explain how it will support the provision of instant payment services in the United States.
Chinese Premier Li: Will Roll Out More Practical, Effective Measures To Open Up – Expects China Q2 Growth To Be Faster Than Q1
Chinese Premier Li: Will Roll Out More Practical, Effective Measures To Open Up
– Expects China Q2 Growth To Be Faster Than Q1
– Likely To Achieve Annual Growth Goal Of Around 5%— LiveSquawk (@LiveSquawk) June 27, 2023
PBOC set the onshore yuan stronger than expected, USD/CNH tumbling
- Yuan has had a one-way ticket to weakness. The PBOC have been supportive of the devaluation, a lower yuan is a form of stimulus for the export sector. The rapid pace of the fall is expected to result in the PBOC moving to slow the descent.
Which is what we have today. While the CNY is weaker, its been set not nearly as weak as was expected:
USD/CNH has dropped (CNH is the offshore yuan, its gained from its earlier lows on the back of the PBOC CNY reference rate today)
EUR/USD holds gains above 1.0900 ahead of ECB-speak, US data
EUR/USD is holding ground above 1.0900, as bulls look to a bunch of ECB policymakers and the US data to defend the previous rebound in Tuesday’s Asian session. The pair is on the front foot, as the US Dollar struggles amid a risk-on market mood.
The EUR/USD rose marginally on a quiet Monday across financial markets. The last week of the month will witness key inflation data releases, and market participants will hear from many central bankers. The US dollar weakened moderately on Monday amid a slide in US yields and a rebound in commodity prices.
After PMI data on Friday triggered some pessimism about the health of the economy, data released on Monday showed a decline in the German Ifo. The haedline in June dropped from 91.5 to 88.5, below the market expectation of 90.7, while the Expectation Index tumbled from 88.3 to 83.6, and the Current Assessment fell from 94.8 to 93.7.
The European Central Bank’s forum on central banking in Sintra has started, with many central bank officials from around the world in attendance. ECB President Lagarde will speak several times, as will other ECB policymakers, starting on Tuesday. If the ECB wants to send a message to the market this week, it has an opportunity. The most likely scenario is to stick to the current “data-dependent” mantra, signaling another rate hike in July.
At the Sintra forum, Fed Chair Powell will speak on Wednesday, but surprises are unlikely. Following central bankers’ talks, the focus will turn to inflation data, starting with Eurozone figures and then on Friday in the US with the Core Personal Consumption Expenditures. Those numbers will influence monetary policy expectations.
ECB’s Enria: Most Banks Exploring Russia Exit Strategies
– ECB Recently Urged Banks To Speed Up Russia Exit Strategies— LiveSquawk (@LiveSquawk) June 27, 2023
Lacklustre start to the final week of June: Copper, Nikkei 225, EUR/GBP
Market Recap
Wall Street added to recent losses overnight (DJIA -0.04%; S&P 500 -0.45%; Nasdaq -1.16%), as the moderation from previous overbought technical conditions and extreme bullish sentiments continues. Amid the relatively quiet US economic calendar to start the week, a series of downgrades in the technology space such as Alphabet and Tesla seem to take on much focus, triggering some profit-taking from its recent stellar outperformance. Market participants rotated into value sectors, with strength in real estate (+2.2%) and energy sector (+1.7%). The VIX is also up 6% as a sign of increased hedging activities on renewed caution.
The day ahead will leave comments from European Central Bank (ECB) President Christine Lagarde on watch. Recession talks are amplified yesterday with a lower-than-expected read in Germany IFO business climate index (88.5 versus 90.7 forecast) and its second straight month of decline, but she is likely to join the hawkish chorus from central bankers in terms of monetary policies. Canada’s inflation data is lined up on the economic calendar, with expectations for further progress to be made in its inflation fight. US durable goods orders and consumer confidence data will also be in focus tonight to provide further clues on soft-landing chatters.
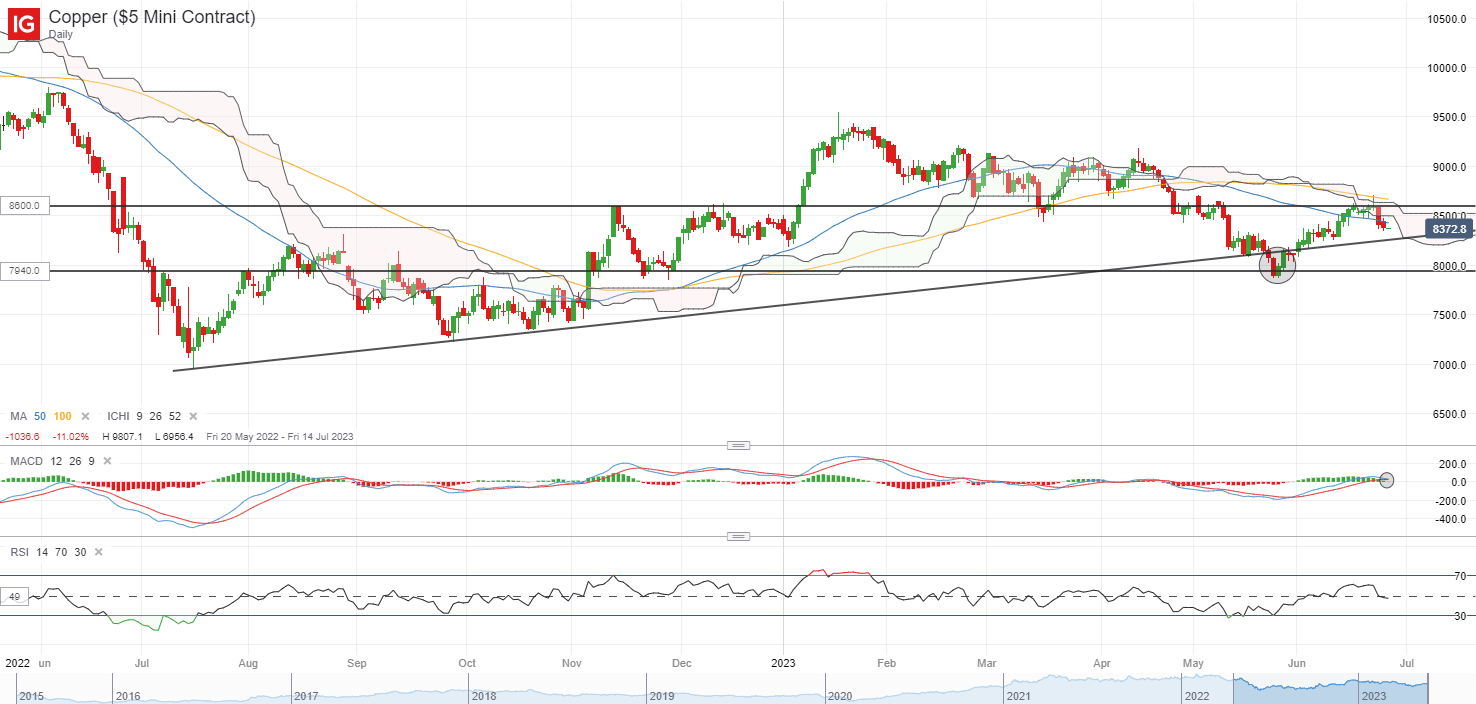
Following a 10% rebound over the past month, copper prices are facing strong resistance at the US$8,600/tonne level, where a previous support-turned-resistance stands in line with the upper edge of the Ichimoku cloud on the daily chart. A bearish crossover on moving average convergence/divergence (MACD) points to a reversal in momentum as the relative strength index (RSI) flirts with the key 50 level. China’s Purchasing Managers’ Index (PMI) data will be released this week, and given that any positive impact from recent round of monetary easing measures may come with some lag, another set of lacklustre readings in its June PMI remains on the table.
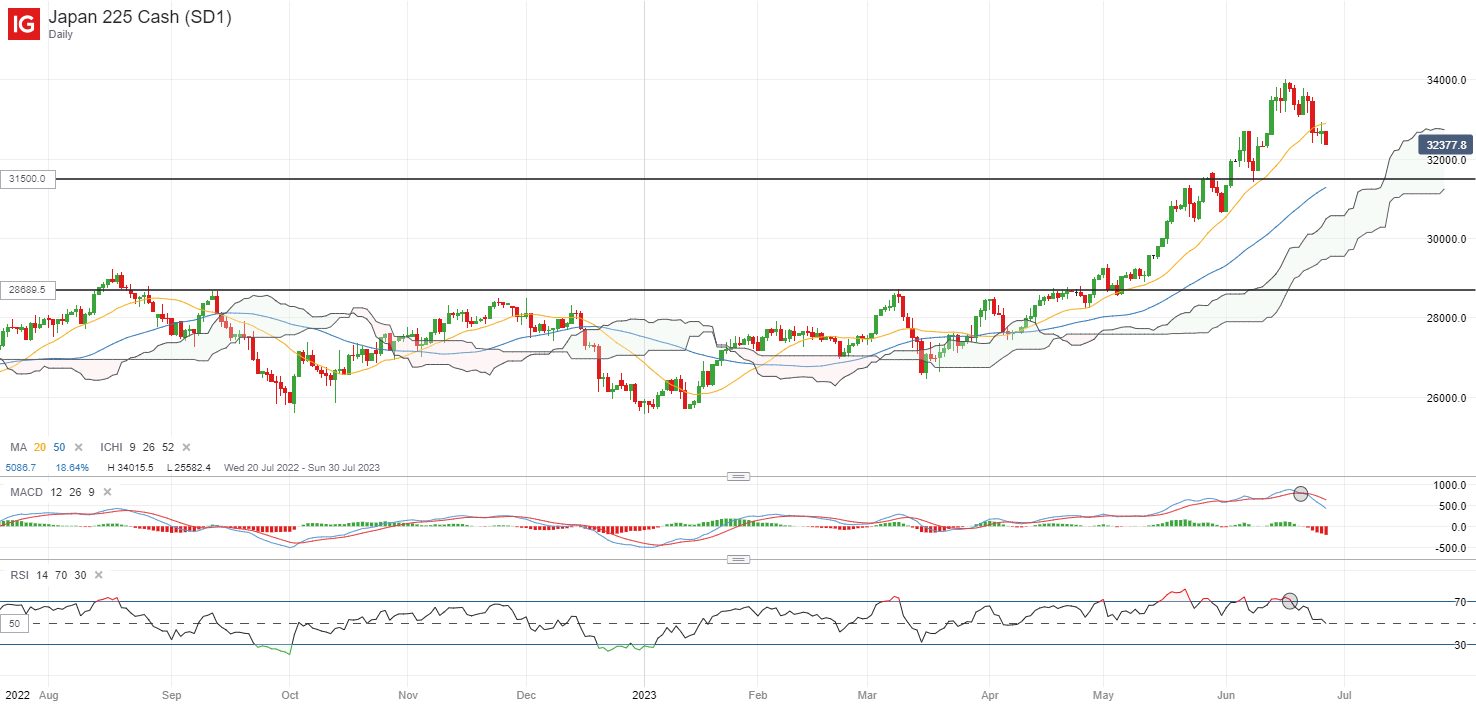
Asian stocks look set for a mixed open, with Nikkei -0.54%, ASX +0.39% and KOSPI -0.34% at the time of writing. Chinese equities saw some slight resilience overnight, with the Nasdaq Golden Dragon China Index eking out a 0.2% gain despite the downbeat Wall Street performance. For the Nikkei, the 20-day moving average (MA) has given way, which is a key MA line supporting the index on at least four occasions over the past two months. As the index continues to moderate from overbought technical conditions, further downside may leave the 31,500 level on watch next, where previous dip-buying efforts were sighted in early-June.
Closer to home, Singapore’s industrial production painted a gloomy growth outlook, with its eight straight month of contraction. The degree of underperformance is significant as well, with production down 10.8% year-on-year versus an expected 7.4% contraction, tracking a similar decline in its non-oil domestic exports. The electronics segment continued to be a drag on growth, contracting 23% from a year ago and accounting for 45% of the overall manufacturing sector. Being highly sensitive to external demand, a low-for-longer growth outlook for Singapore seems to be the takeaway, with a dimmer economic outlook and a global tech downcycle at play.
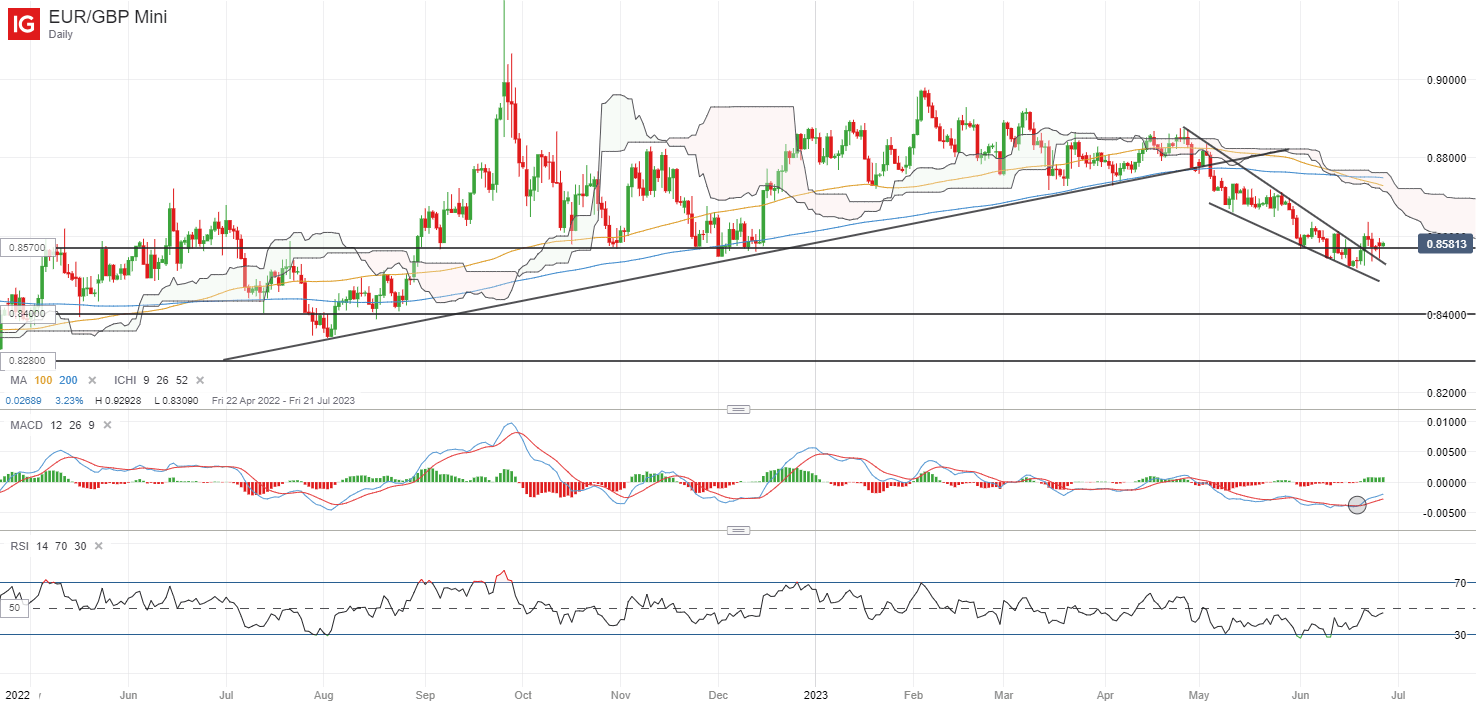
Having broken above a near-term descending wedge on the daily chart last week, buyers are now attempting to defend a key support at the 0.857 level, as revealed in the formation of a bullish long-legged doji overnight. That said, more clarity awaits, with its RSI still trending below the key 50 level while its 20-day MA is standing in the way as immediate resistance. Policy divergence remains the key driving force for the pair, as UK inflation not moderating as quickly as the Eurozone suggests that more hawkishness is being priced for the BoE as compared to the ECB. Comments from ECB President Christine Lagarde will be on the radar later today. Failure to defend the 0.857 level over the coming days may point to some exhaustion, which may pave the way to retest the 0.840 level next.
Euro Technical Outlook – Ranges Against Trends. Is EUR/USD Trapped?
EUR/USD TECHNICAL ANALYSIS
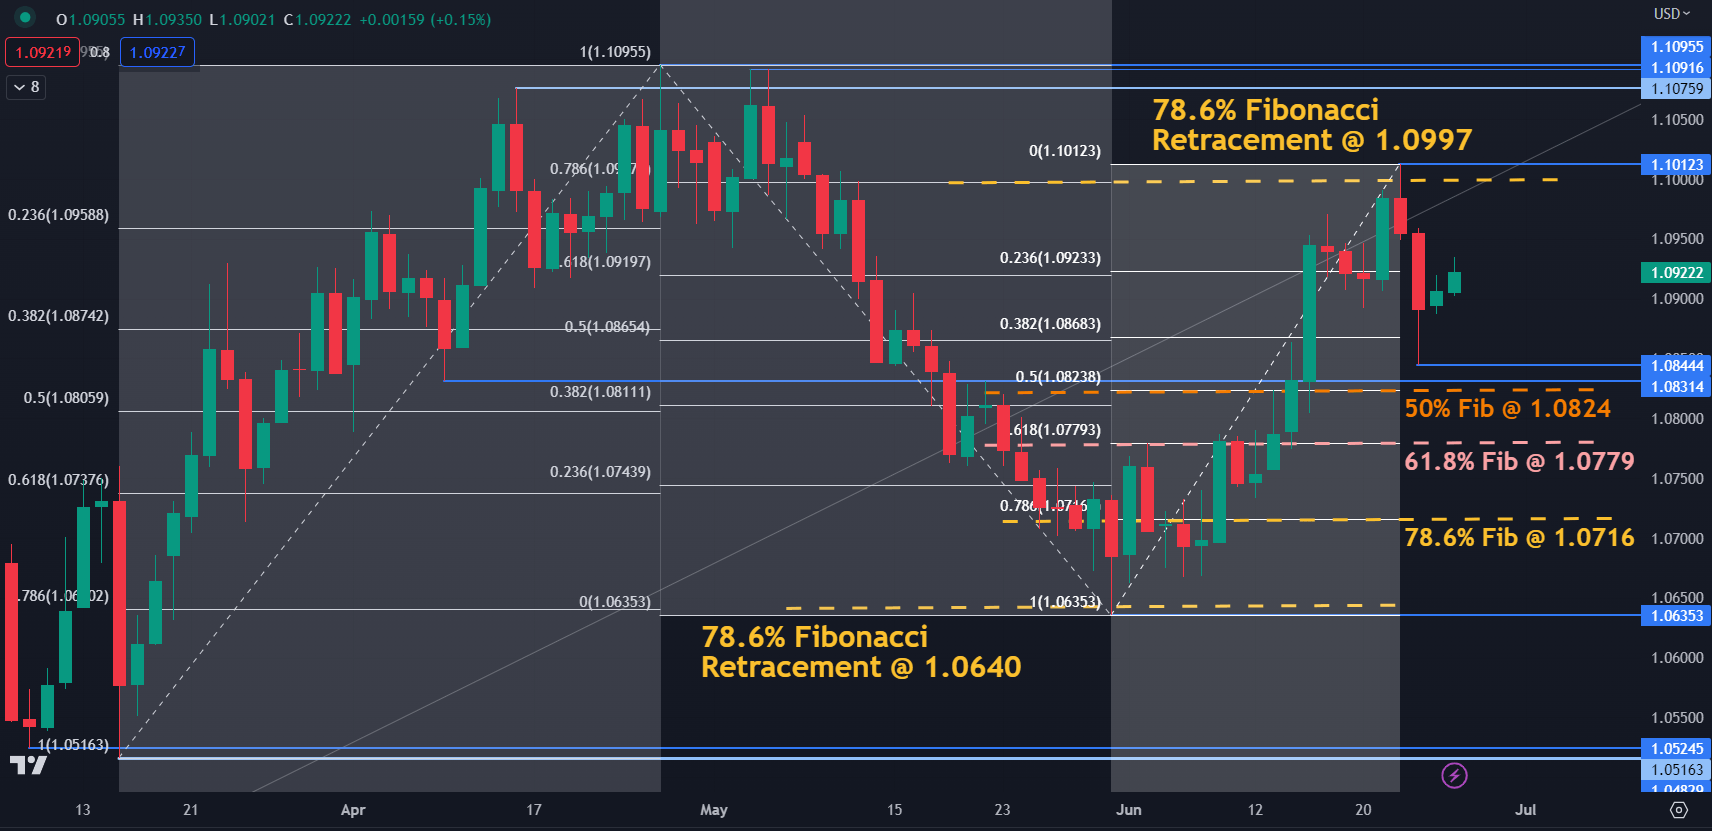
EUR/USD remains in the six-week range of 1.0516 – 1.1096 after failing to meaningfully challenge the topside last week.
The run higher barely eclipsed the 78.6% Fibonacci Retracement of the move from 1.1096 down to 1.0635 at 1.0997 when it peaked at 1.1012. Those levels may continue to offer resistance ahead of a series of potential resistance levels in the 1.1076 – 1.1096 area.
Nearby support could be at the recent low of 1.0844, which is just above the breakpoint of 1.0831.
Further to the downside, there are a series of Fibonacci Retracement levels of the move from 1.0635 up to 1.1012 that might provide support. The 50% Retracement level is at 1.0824, the 61.8% at 1.0779 and 78.6% is at 1.0716.
The late May low of 1.0635 was only a fraction below the 78.6% Fibonacci Retracement of the move from 1.0516 to 1.1096 at 1.0640. This could make the 1.0635-40 area a possible support zone ahead of the prior lows at 1.0525, 1.0516, 1.0483 and 1.0443.
EUR/USD DAILY CHART OVER THE LAST 3 MONTHS
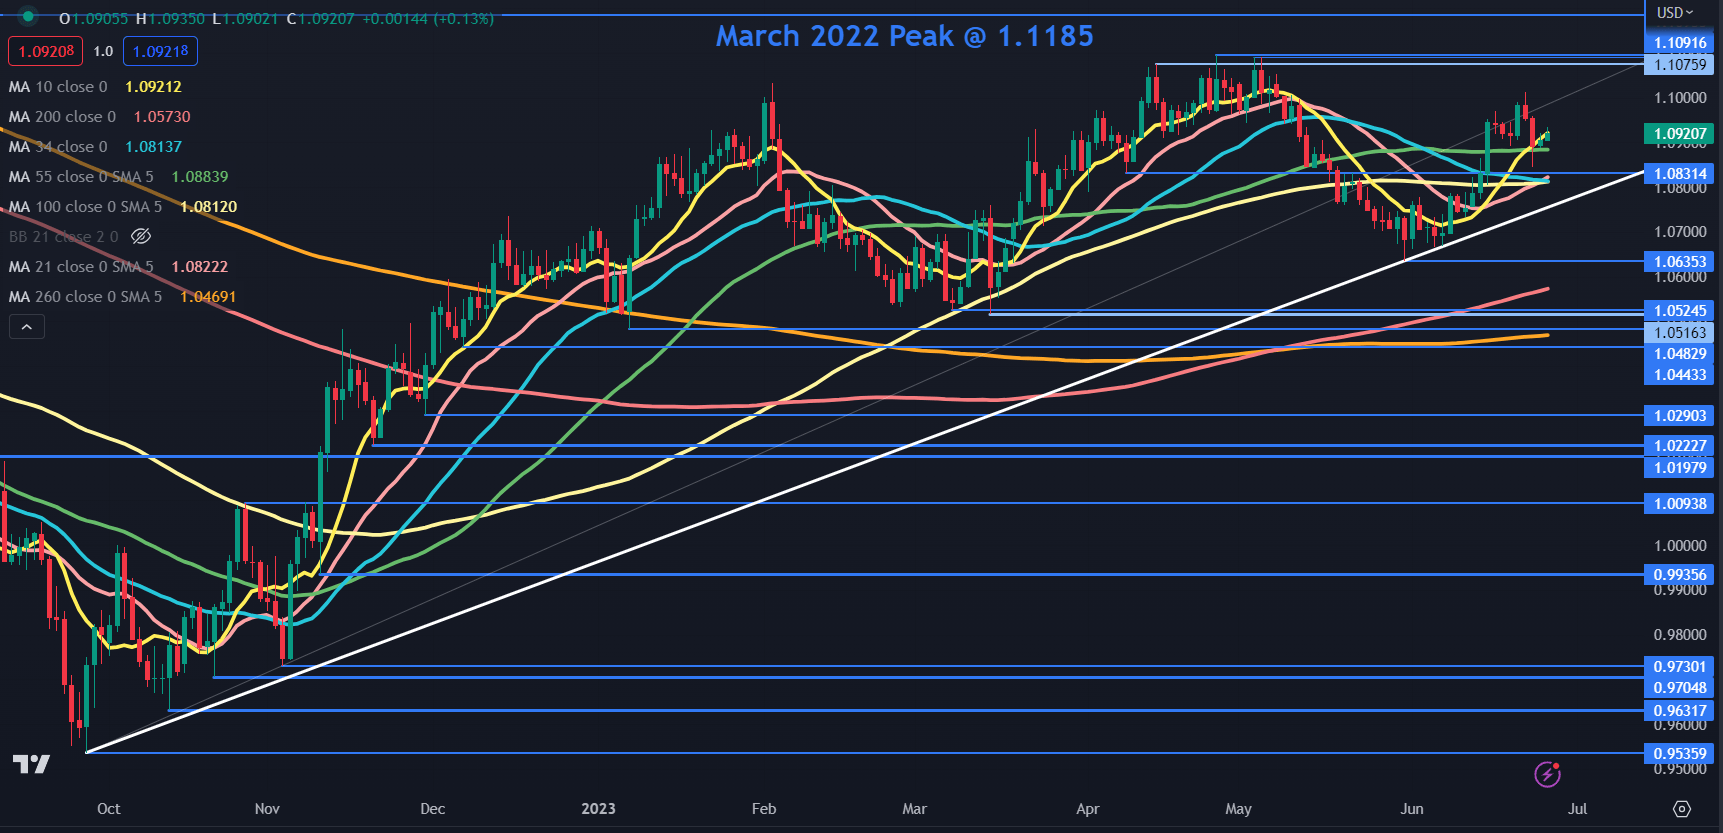
While the chart above highlights the range trading nature for EUR/USD of late, if we zoom out on the timeframe, the currency pair remains in an ascending trend.
However, the price might be at a somewhat critical juncture over the coming weeks. A failure to take out the March 2022 peak of 1.1185 may infer that a longer-term Double Top could be in play.
A clean break above 1.1185 might imply that the ascending trend is intact and could see further bullishness evolve.
On the downside, a break below the ascending trend line could confirm the Double Top. Such a move may see bearishness unfold.
The price is above the 21-, 34-, 55-, 100-, 200- and 260-day simple moving averages (SMA) but is oscillating around the 10-day SMA. A reacceleration above the 10-day SMA might suggest that bullish momentum could evolve further.
EUR/USD DAILY CHART OVER THE LAST 8 MONTHS
Australian Dollar Boosted by Soft US Dollar and Rosy China Outlook. Higher AUD/USD?
The Australian Dollar found firmer footing on Tuesday with regional sentiment seemingly buoyed despite a soft lead from Wall Street.
The Dow Jones, S&P 500 and Nasdaq all finished their cash session lower by 0.04%, 0.45% and 1.16% respectively.
US interest rate markets pushed back the timeline on rate cuts from the Federal Reserve, with the first such move now being priced in for early 2024.
Treasury yields are generally slightly higher along the curve today with the notable exception being the 2-year note that has dipped below 4.70%.
The US Dollar is generally weaker across the board so far with the high beta Aussie and Kiwi Dollars being the main beneficiaries.
Washington announced that Treasury Secretary Janet Yellen will be visiting Beijing in July in further signs that the sometimes-frosty Sino-US relations might be thawing.
In a speech today, Chinese Premier Li Qiang hinted toward more measures to boost the world’s second-largest economy.
The People’s Bank of China set the Yuan stronger than anticipated at the fixing and this seemed to help sentiment in the region.
The mainland CSI 300 and Hong Kong’s Hang Seng Index (HSI) got a lift and it appeared to underpin Australia’s ASX 200. Japanese and South Korean indices are trading in the red.
USD/JPY continues to trade near its 7-month peak despite the reappointment last week of Masato Kanda as Vice Finance Minister for International Affairs.
The role oversees the FX market and in particular, if and when intervention will take place. Under his watch in late 2022, USD/JPY turned from its high above 150 in the aftermath of Japanese intervention.
The bank is yet to physically intervene in 2023 although some jawboning has begun as the price inched through the 140s.
In other geopolitical news overnight, Russian President Vladimir Putin referred to the Wagner group as traitors. The Russian situation does not appear to have impacted markets too dramatically so far.
Energy commodities are mostly relatively contained so far this week. Crude oil is steady with the WTI futures contract near US$ 70 bbl while the Brent contract is a touch above US$ 74.50 bbl. Gold is trading at just under US$ 1,940.
Looking ahead, the US will see durable goods orders and Canada will get a CPI print for May.
AUD/USD TECHNICAL ANALYSIS – WEEKLY CHART
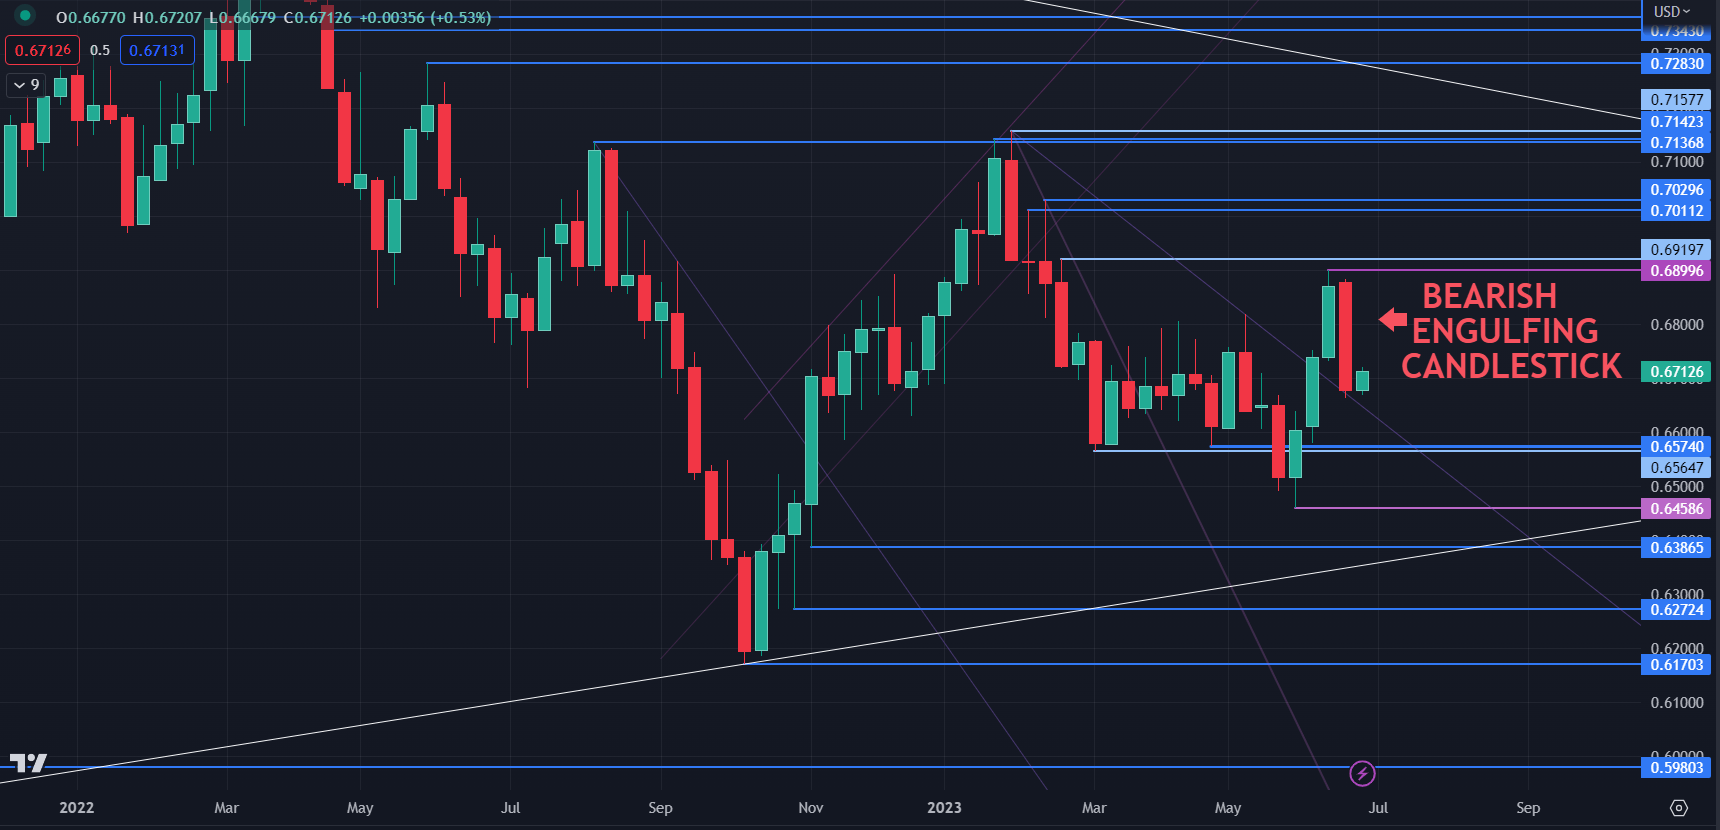
The weekly chart reveals that a Bearish Engulfing Candlestick formation was created by the price action at the end of last week. It could suggest that a reversal might be unfolding and bearish momentum may evolve.
Potential resistance could be in the 0.6800 – 0.6820 area ahead of the previous peaks of 0.7011 and 0.7030 and of a cluster zone of possible resistance in the 0.0.7137 – 0.7157 area.
Support could be at the breakpoints of 0.6574 and 0.6565 or the late May low of 0.6458.