Forex Today: ECB’s annual Forum on Central Banking kicks off

Forex Today: ECB’s annual Forum on Central Banking kicks off

Markets remain relatively quiet to start the week as investors turn their attention to the European Central Bank’s annual Forum on Central Banking in Sintra that will kick off with ECB President Christine Lagarde’s speech at 1730 GMT. The US economic docket will feature the Federal Reserve Bank of Dallas’ Texas Manufacturing Survey. Germany’s IFO Institute will also release business sentiment data for June.

Over the weekend, tensions between the Wagner mercenary group and Russian President Vladimir Putin eased after the sides reached an agreement late Saturday. Meanwhile, “China needs to step up measures as soon as possible to bolster a faltering post-COVID recovery in the world’s second-largest economy,” said Ning Jizhe, deputy head of the economic committee of the Chinese People’s Political Consultative Conference (CPPCC). Nevertheless, S&P Global announced that it lowered its forecast for China’s Gross Domestic Product (GDP) growth to 5.2% from 5.5% this year. Following these developments, investors seem to have adopted a cautious stance early Monday, with US stock index futures trading modestly lower on the day.

The ECB’s forum is entitled “Macroeconomic stabilisation in a volatile inflation environment.” Many prominent central bankers, including FOMC Chairman Jerome Powell and Bank of England President Andrew Bailey, will be speaking at this event later in the week.

The US Dollar Index, which snapped a three-week losing streak on the back of a strong rebound seen in the second half of the week, stays in a consolidation phase below 103.00 and the 10-year US Treasury bond yield is down more than 1% below 3.7% in the European morning.

EUR/USD holds steady at around 1.0900 early Monday after having registered small losses last week.

GBP/USD came within a touching distance of 1.2700 during the Asian trading hours on Monday but managed to stage a rebound toward 1.2750.

The Summary of Opinions of Bank of Japan’s (BoJ) June policy meeting showed that policymakers thought that the BoJ must consider reviewing the Yield Curve Control strategy at an early stage, while maintaining easy monetary policy. USD/JPY stays under modest bearish pressure early Monday and trades in negative territory at around 143.00.

Gold price benefits from retreating US yields and rises toward $1,930 in the European session after having lost nearly 2% last week.

Bitcoin edged lower over the weekend but managed to hold comfortably above $30,000. Ethereum stays in a consolidation phase near $1,900 on Monday following last week’s rally that saw ETH/USD gain more than 10%.

AUD/USD seems vulnerable around 0.6670 ahead of US Durable Goods Orders

AUD/USD seems vulnerable around 0.6670 ahead of US Durable Goods Orders

The AUD/USD pair is consolidating above 0.6670 in the European session. The Aussie asset is expected to resume its downside journey as the US Dollar Index (DXY) has stabilized after a corrective move to near 102.70.

S&P500 futures have generated some losses on Monday, carry-forwarded negative cues witnessed on Friday. The overall market mood is indicating that the risk-aversion theme is getting strengthened further as fears of global recession are accelerating due to higher interest rates by the central banks. Also, the upcoming quarterly reason has kept investors on their toes.

The US Dollar Index has shown a corrective move from a weekly high of 103.17 as investors have started digesting fears of more interest rate hikes from the Federal Reserve (Fed). Fed chair Jerome Powell has already confirmed that the central bank will continue tightening rates at a ‘careful pace.

Analysts at Rabobank expect the Fed to hike in July but also forecast a more moderate pace of rate hikes which would imply skipping September, with November being the meeting for a potential second hike.

Going forward, US Durable Goods Orders data will be keenly watched. As per the consensus, May’s data is expected to contract by 1.0%, against an expansion of 1.1% reported earlier.

On the Australian Dollar front, investors are awaiting the release of the monthly Consumer Price Index (CPI) data (May). Australian inflation turned out hotter in April and landed at 6.8% as labor market conditions remained upbeat. The expectations for more rate hikes from the Reserve Bank of Australia (RBA) are higher as risks of upside inflation are elevated.

EUR/USD is hovering around 1.0900 at the start of the new trading week on Monday.

EUR/USD is hovering around 1.0900 at the start of the new trading week on Monday.

EUR/USD is hovering around 1.0900 at the start of the new trading week on Monday. The pair is holding last week’s corrective downside, allowing traders to take a sigh of relief amid a broad US Dollar retreat. Focus shifts to Germany’s IFO survey for fresh trading impetus.

EUR/USD broke below the lower limit of the ascending regression channel and the Relative Strength Index (RSI) indicator on the four-hour chart fell below 40, reflecting a buildup of bearish momentum.

EUR/USD was last seen trading near 1.0870, where the Fibonacci 38.2% retracement of the latest uptrend is located. If the pair starts using that level as resistance, it could stretch lower to 1.0820/30 (100-period Simple Moving Average (SMA), 200-period SMA, Fibonacci 50% retracement) and 1.0780 (Fibonacci 61.8% retracement).

On the upside, 1.0900 (psychological level) aligns as interim resistance ahead of 1.0920 (Fibonacci 23.6% retracement) and 1.0940 (lower-limit of the ascending channel, 20-period SMA).

Following Thursday’s slide, EUR/USD came under renewed bearish pressure early Friday and broke below 1.0900. In case buyers fail to defend 1.0870, the pair could suffer additional losses ahead of the weekend.

FOMC Chairman Jerome Powell’s hawkish rhetoric on the second day of his congressional testimony and the risk-averse market atmosphere helped the US Dollar (USD) outperform its rivals on Thursday. Following a quiet Asian session, the pair turned south once again on growing fears of a recession in the Euro area, touching its lowest level in a week near 1.0850.

The data from Germany and the Eurozone showed that the business activity in the manufacturing sector continued to contract at an accelerating pace in early June, with HCOB Manufacturing PMI dropped to 41 and 43.6, respectively. Although HCOB Services PMIs held in the expansion territory above 50, they retreated sharply from May levels.

Assessing the findings of the PMI reports, “after Eurozone GDP fell for the second time in a row in the first quarter, the probability has increased somewhat that the GDP change will again carry a negative sign in the current quarter, due in part to weak services activity in France,” said Dr. Cyrus de la Rubia, Chief Economist at Hamburg Commercial Bank.

According to Reuters calculations, the 15% probability of a 4.25% European Central Bank (ECB) terminal rate declined to virtually 0% after PMI readings.

Ahead of the weekend, S&P Global will release Manufacturing and Services PMI data for the US. In case there is an unexpected rebound in the Services PMI, the USD is likely to preserve its strength. On the flip side, a significant decline should have the opposite effect on the USD’s valuation.

Market participants will also pay close attention to risk perception. US stock index futures are down between 0.3% and 0.5%. Even if disappointing PMIs weigh on the USD, a bearish reaction in Wall Street’s main indexes could make it difficult for EUR/USD to stage a rebound.

Markets Week Ahead: Nasdaq, Gold, USD, Powell, US PCE, Germany Ifo, China PMI, Australia Retail Sales

Markets Week Ahead: Nasdaq, Gold, USD, Powell, US PCE, Germany Ifo, China PMI, Australia Retail Sales

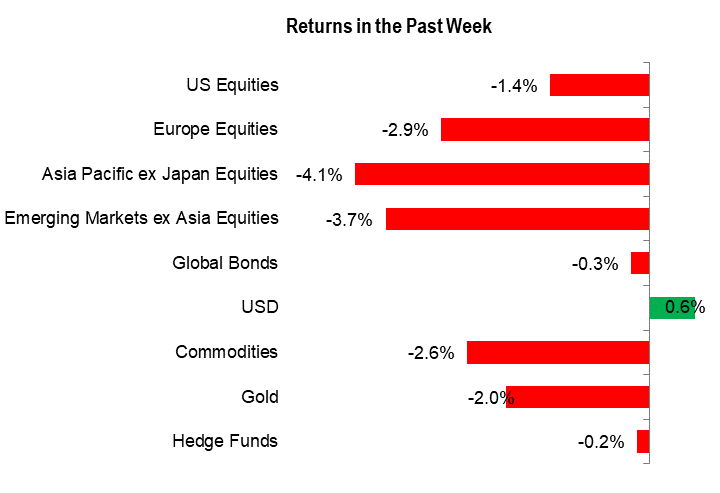
Global equity markets tumbled while the US dollar rose as risk appetite took a back seat following aggressive tightening by global central banks in an attempt to rein in stubbornly high inflation.

The MSCI All Country World index declined 2.2%, the S&P 500 index fell 1.4%, and the Nasdaq 100 index dropped 1.3%. The German DAX 40 tumbled 3.2% and the UK FTSE 100 fell 2.4%. In Asia, the Hang Seng index plunged 5.7%, while Japan’s Nikkei 225 fell 2.7%. Risk-sensitive currencies, including the Australian dollar and the New Zealand dollar, were down 2.9% and 1.5% respectively over the week.

Past week market performance

image1.png

Source Data: Bloomberg; chart prepared in excel.

Note: Global Bonds proxy used is Bloomberg Global Aggregate Total Return Index UnhedgedUSD; Commodities proxy used is BBG Commodity Total Return; Hedge Funds proxy used is HFRX Global Hedge Fund Index.

The Bank of England surprisingly raised interest rates by 50 basis points, compared with expectations of a 25-basis-point move. Norway’s central bank unexpectedly hiked interest rates by 50 basis points and said it projected another hike in August. Swiss National Bank increased its policy rate by 25 basis points last week. In the previous week, the European Central Bank raised interest rates and indicated more hikes, while the Bank of Canada and the Reserve Bank of Australia surprisingly raised interest rates earlier this month.

This month, the US Federal Reserve was an exception as it left interest rates unchanged. However, Fed chair Powell reiterated last week the central bank’s hawkish stance saying more rate hikes may be needed, adding that interest rates would move at a “careful pace” from here. Powell said “the point” of holding rates steady was precisely to slow the speed with which the Fed was raising borrowing costs

The renewed hawkishness of global central banks comes as inflation, while moderated, still remains above the central banks’ target. So far, the global economy has been resilient, but the concern is further aggressive tightening could push the global economy into a recession.

The coming week begins with three days of ECB Forum on Central Banking, and Germany’s Ifo Business Climate on Monday; ECB President Lagarde’s speech, Canada inflation for May, US durable goods orders for May, and US consumer confidence for June are scheduled for Tuesday. Germany GfK Consumer Confidence for July, ECB President Lagarde’s and Fed Chair Powell’s speech on Wednesday. Australia retail sales for May are due on Thursday along with US Fed Chair Powell’s speech, Euro area consumer confidence, Germany inflation data for June, and US Q1 GDP. China NBS manufacturing PMI, UK Q1 GDP, Germany retail sales for May, Euro area inflation data for June, and US PCE price index data are due on Friday.

Forecasts:

Euro Outlook: EUR/USD Veers Off Bullish Path after Rejection at 1.1000. Now What?

EUR/USD fails to hold above 1.1000 and turns lower heading into the weekend, dropping below the 1.0900 handle and challenging a key trendline support. Will the bears be rebuffed?

British Pound (GBP) Week Ahead: A Bruising Week For Sterling

The British Pound is ending the week in the red despite the Bank of England hiking rates by 50bps. Fears of an impending recession are stalking the Pound.

Australian Dollar Outlook: US Dollar in Play as Local Bond Yields Invert

The Australian Dollar capitulated last week as the US Dollar regained the upper hand with the Fed talking up more hikes while Aussie bond markets see clouds ahead. Lower AUD/USD?

USD/JPY Price Forecast: More Misery to Come for Japanese Yen?

The Japanese Yen heads into a US data filled week on the backfoot as the Fed and BoJ look to be diverging once more.

US Dollar Week Ahead: USD Looks for Cues from PCE Data

The US dollar could remain in a range ahead of the key US PCE price index data due Friday. Will the Fed’s preferred inflation gauge could move the needle for markets, which are not convinced that the Fed can hike twice more this year?

S&P 500, Nasdaq Forecast: Fed Testimony Gets Markets Back Onside

Fed Chair Jerome Powell reiterated the Feds hawkish stance on rates during his two-day testimony before congress. Finally, markets listened

Gold Weekly Forecast: Bearish Breakout May be Limited as Recession Fears Grow

Gold staged an attempted recovery on Friday as recessionary fears were reignited. Is the current selloff a precursor for the next bullish rally?

US Crude Oil Weekly Forecast: Prices Will Struggle With Demand Uncertainty, Rising Rates

Energy markets still face the toxic mix of plentiful supply and depressed demand.

Asia Day Ahead: Subdued Start to the Week Amid Light Calendar in the Region

Asia Day Ahead: Subdued Start to the Week Amid Light Calendar in the Region

Market Recap

Last Friday brought another downbeat session in Wall Street, with the S&P 500 adding to recent losses to close 1.4% lower for the week but nevertheless, the index is still up 4% for the month. On the economic calendar, areas of weaknesses in the global economy continue to be presented with a series of lower-than-expected flash Purchasing Managers’ Index (PMI) readings from major economies. Notably in the US, flash manufacturing PMI remains in contractionary territory (46.3 versus previous 48.4) while the services sector saw a moderation in growth (54.1 versus previous 54.9) for the first time in six months.

Ahead, market participants may be keeping an eye on any further developments around the mercenaries’ uprising in Russia but having chosen to stand down, the mercenaries have already given up their initial advantage of the surprise element in a rebellion, which reduces the chances of further escalation. The potential risks to watch may be on any renewed opposition from the Russian public to Putin’s leadership, especially with the Ukraine war being the agenda for the movement which has not been well-received by the public previously.

The week ahead will bring focus to China’s PMI readings as well, with market participants hoping to seek for any pockets of resilience in the China’s recovery story. The US core PCE price index will also be in focus. Three months of no-progress may explain the +0.3% upward revision in the Fed’s 2023 core PCE projections (3.9% versus 3.6% in March) at the latest FOMC meeting, therefore a softer inflation read will be looked upon to provide room for the Fed to deliver a prolonged pause in July.

The US dollar has been attempting to stay above its Ichimoku cloud on the daily chart but a move back above the 103.12 level may be warranted to provide greater conviction for the bulls. For now, its Relative Strength Index (RSI) still hangs below the 50 level while a flat-lining MACD points to a near-term consolidation. The recent CFTC data revealed that the dollar’s aggregate positioning against G10 currencies has seen a renewed build-up in net-short positioning last week, following four weeks of unwinding. On the downside, the 100.50 level, which marks multiple bottoms year-to-date, may be on watch.

image1.png

Source: IG charts

Asia Open

Asian stocks look set for a mixed open, with Nikkei -0.16%, ASX -0.37% and KOSPI +0.19% at the time of writing. Chinese equities remain under pressure lately, with the Hang Seng Index unwinding all of its past two weeks’ gains upon a retest of the upper edge of an Ichimoku cloud resistance on the weekly chart, which may reveal its significance as a key level for sellers.

The economic calendar is relatively quiet in the region, with Thailand’s trade data and Singapore’s industrial production. Having seen an 8th straight month of contraction in Singapore’s exports, production may track the overall weakness with expectations for a deeper year-on-year contraction to -7.4% from previous -6.9%.

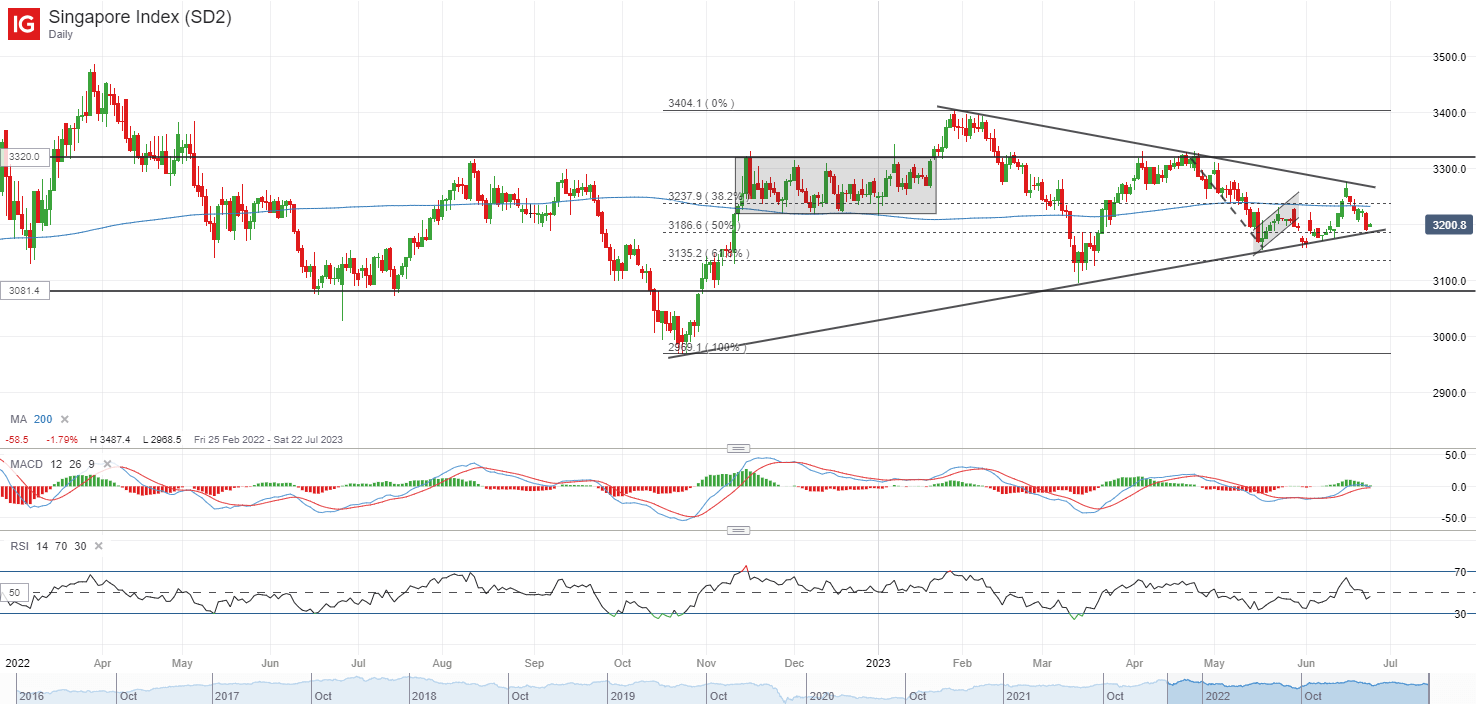
The Straits Times Index continues to trade within a symmetrical triangle pattern, with the index heading back to retest the lower trendline for the fourth occasion since the start of the year. Any breakdown of the lower triangle trendline could leave the March 2023 bottom on watch at the 3,100 level.

image2.png

Source: IG charts

On the watchlist: More signs of life in natural gas prices with push to three-month high

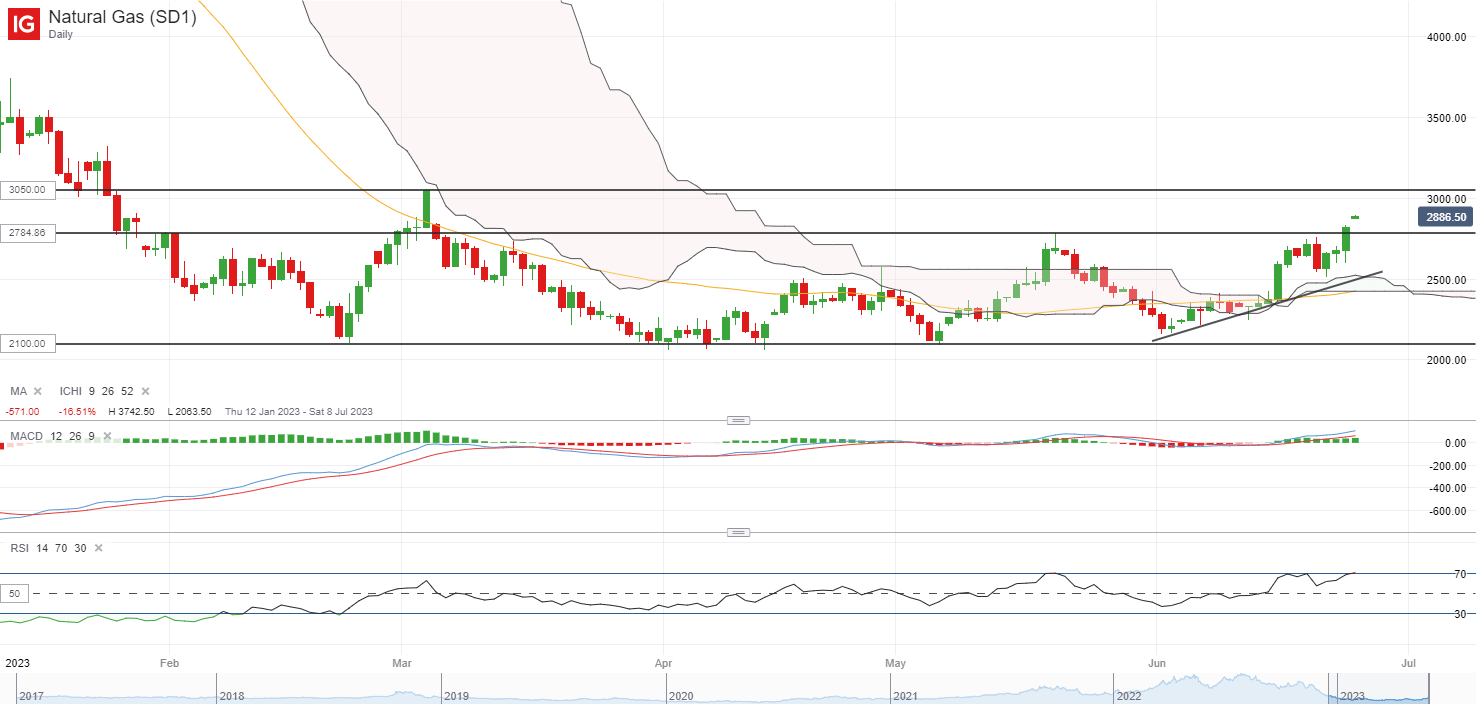
After plunging as much as 78% since August 2022, natural gas prices have been largely forming a base over the past months, which suggests that selling pressure may be exhausted for now. Hotter-than-usual global temperatures increasing electric use and lower-than-planned supply in Norway’s gas output have been on the radar, with natural gas prices heading to its three-month high to end last week.

On the technical front, the RSI maintains above its key 50 level, with the recent formation of higher highs and higher lows supporting a near-term upward bias. The 3.05 level may be on watch next, with any move above this level suggesting a break of its ranging pattern and provides further validation of buyers taking control after a months-long period of indecision. On the downside, a series of support lines will be on watch, which includes its Ichimoku cloud support and its 50-day MA.

image3.png

Source: IG charts

Japanese Yen on Intervention Watch: USD/JPY, EUR/JPY, GBP/JPY Price Setups

Japanese Yen on Intervention Watch: USD/JPY, EUR/JPY, GBP/JPY Price Setups

The Japanese yen gained a bit after Japan’s top diplomat said authorities will respond to excessive moves in the currency market, and after a Bank of Japan board governor was quoted as saying the central bank should discuss revising its yield curve control policy at an early stage.

When asked about the chance of currency intervention, Japan’s top currency diplomat Masato Kanda said on Monday he would not rule out any options. USD/JPY is nearing levels which prompted intervention last year. Separately, the central bank should debate tweaking YCC to improve market function and mitigate its “high cost”, the BOJ summary of opinions at the June policy meeting released on Monday showed.

USD/JPY 240-minute Chart

image1.png

Chart Created by Manish Jaradi Using TradingView; Refer to notes at the bottom of the page.

BOJ left its ultra-loose policy settings unchanged earlier this month, especially the closely-watched yield curve control (YCC) policy, in a bid to support the nascent economic recovery and sustainably achieve its inflation goal. However, there is a growing perception that the YCC could be tweaked as soon as July given the market distortions on the yield curve. BOJ Governor Kazuo Ueda has said the central bank would ‘patiently’ maintain the current policy as there is still some way to stably and sustainably achieve its 2% inflation target.

USD/JPY Daily Chart

image2.png

Chart Created by Manish Jaradi Using TradingView

USD/JPY:No sign of reversal

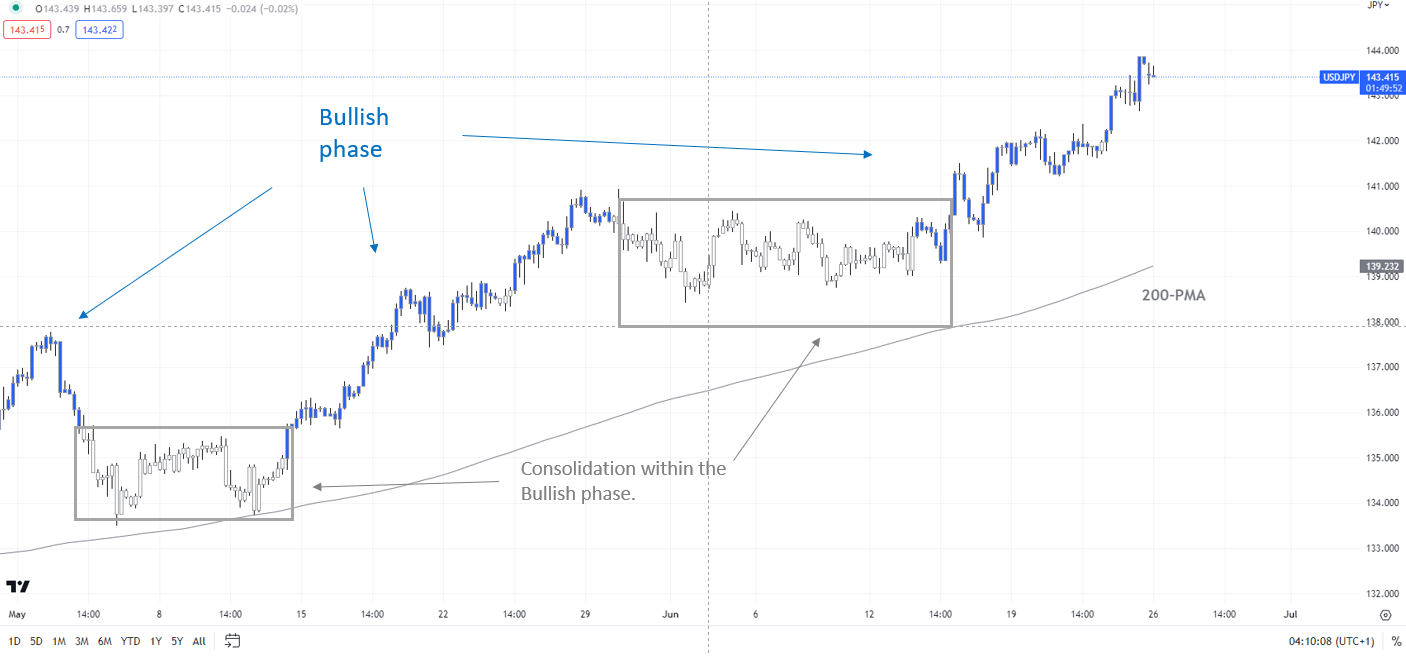
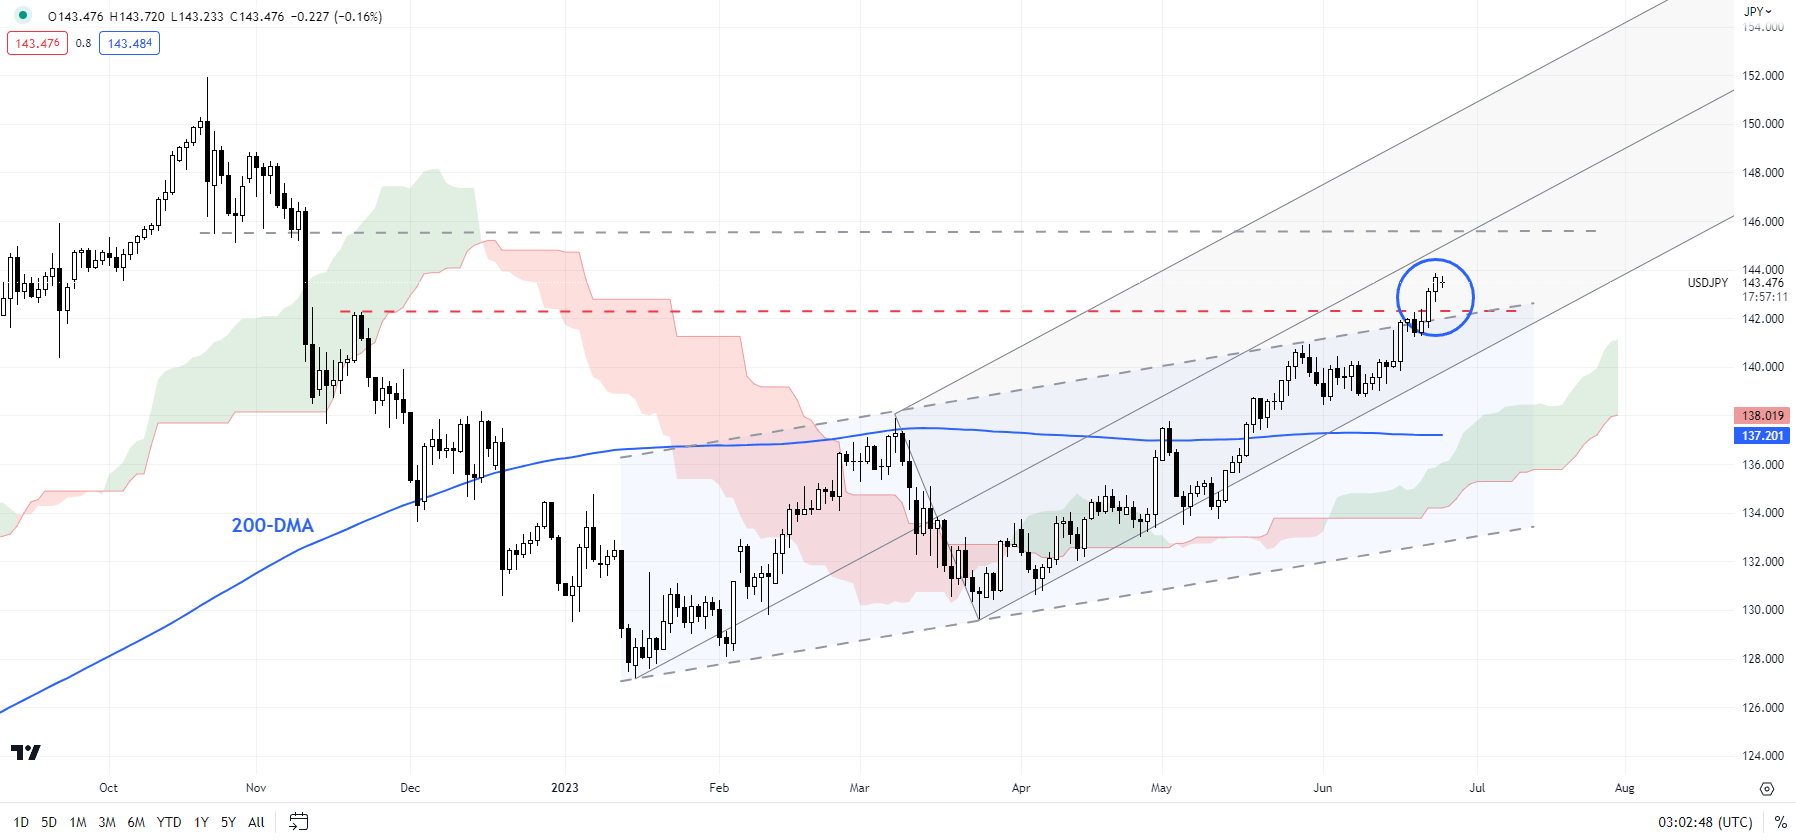
Meanwhile, USD/JPY has risen above a stiff converged resistance: the upper edge of a rising channel from early 2023, coinciding with the end-2022 high of 142.25, and is now approaching the median line of a pitchfork channel from January (at about 143.75). Some signs of loss of steam are emerging, but there is no sign of reversal yet – the colour-coded candlestick charts suggest the pair remains in a bullish phase. USD/JPY would need to fall below a key cushion at the end-May low of 141.00 for the immediate upward pressure to fade.

EUR/JPY Monthly Chart

image3.png

Chart Created by Manish Jaradi Using TradingView

EUR/JPY: Is it breaking above resistance?

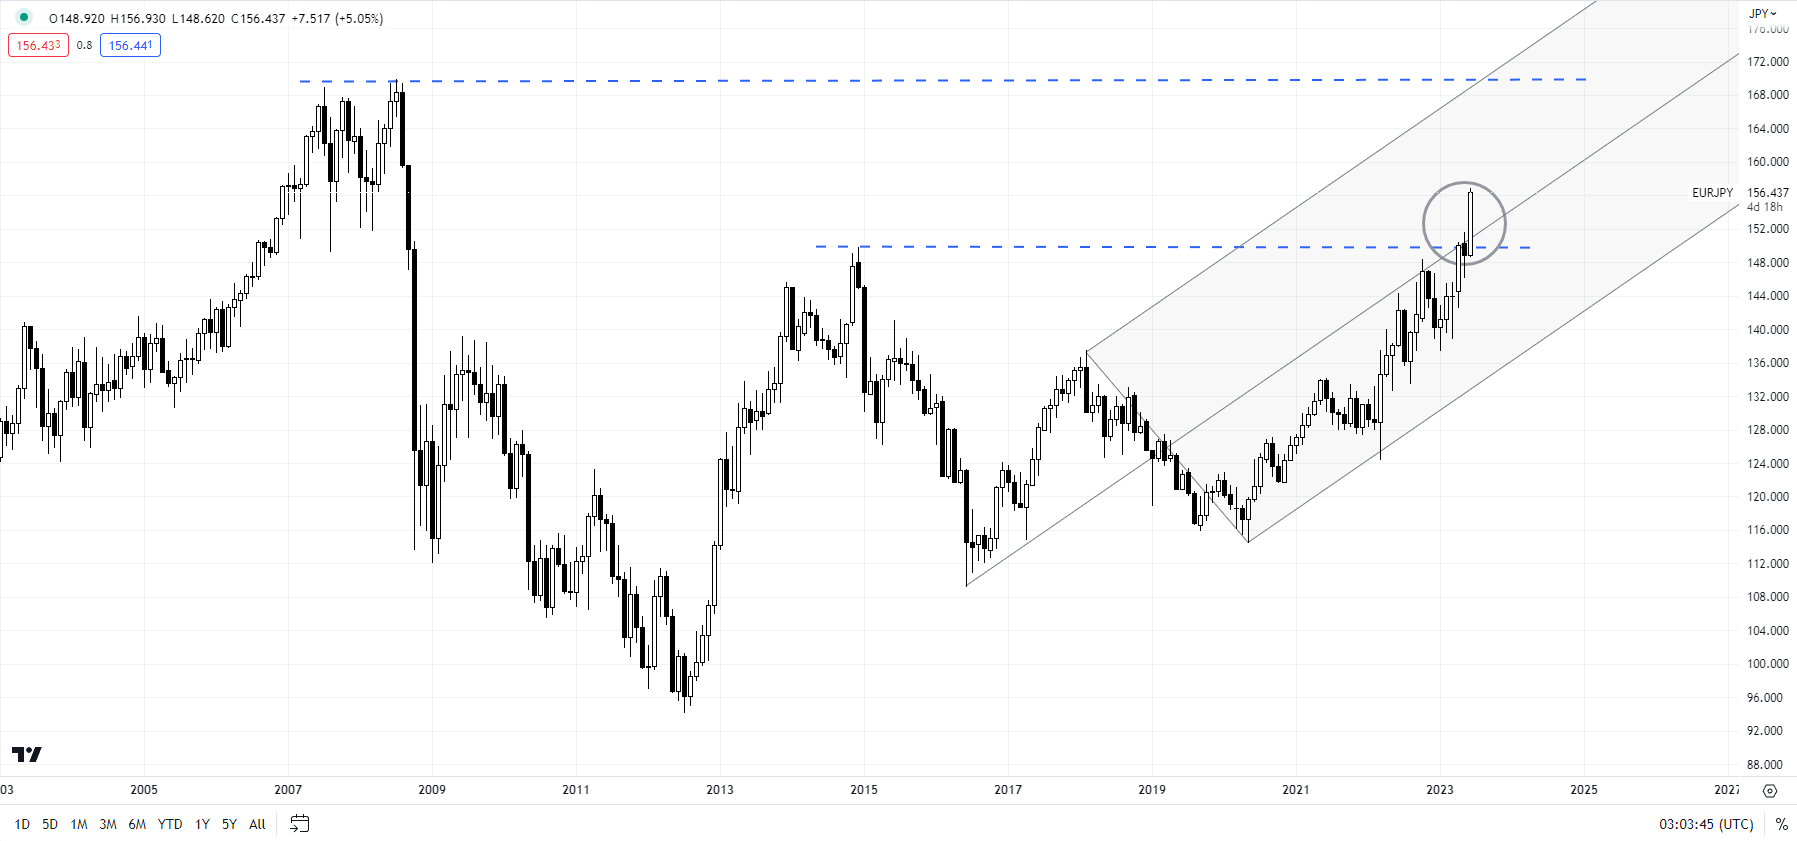
EUR/JPY has risen above a vital converged barrier at the 2014 high of 149.75, coinciding with the median line of a pitchfork channel from 2016. A decisive break (two monthly closes) above could open the door toward the 2008 high of 170.00. If the cross manages to close this month above the resistance, it would raise such odds. However, a poor close (e.g. if the crosses retraces a large part of this month’s gains) would raise the odds of a false break higher.

GBP/JPY Monthly Chart

image4.png

Chart Created by Manish Jaradi Using TradingView

GBP/JPY: Strong upward momentum

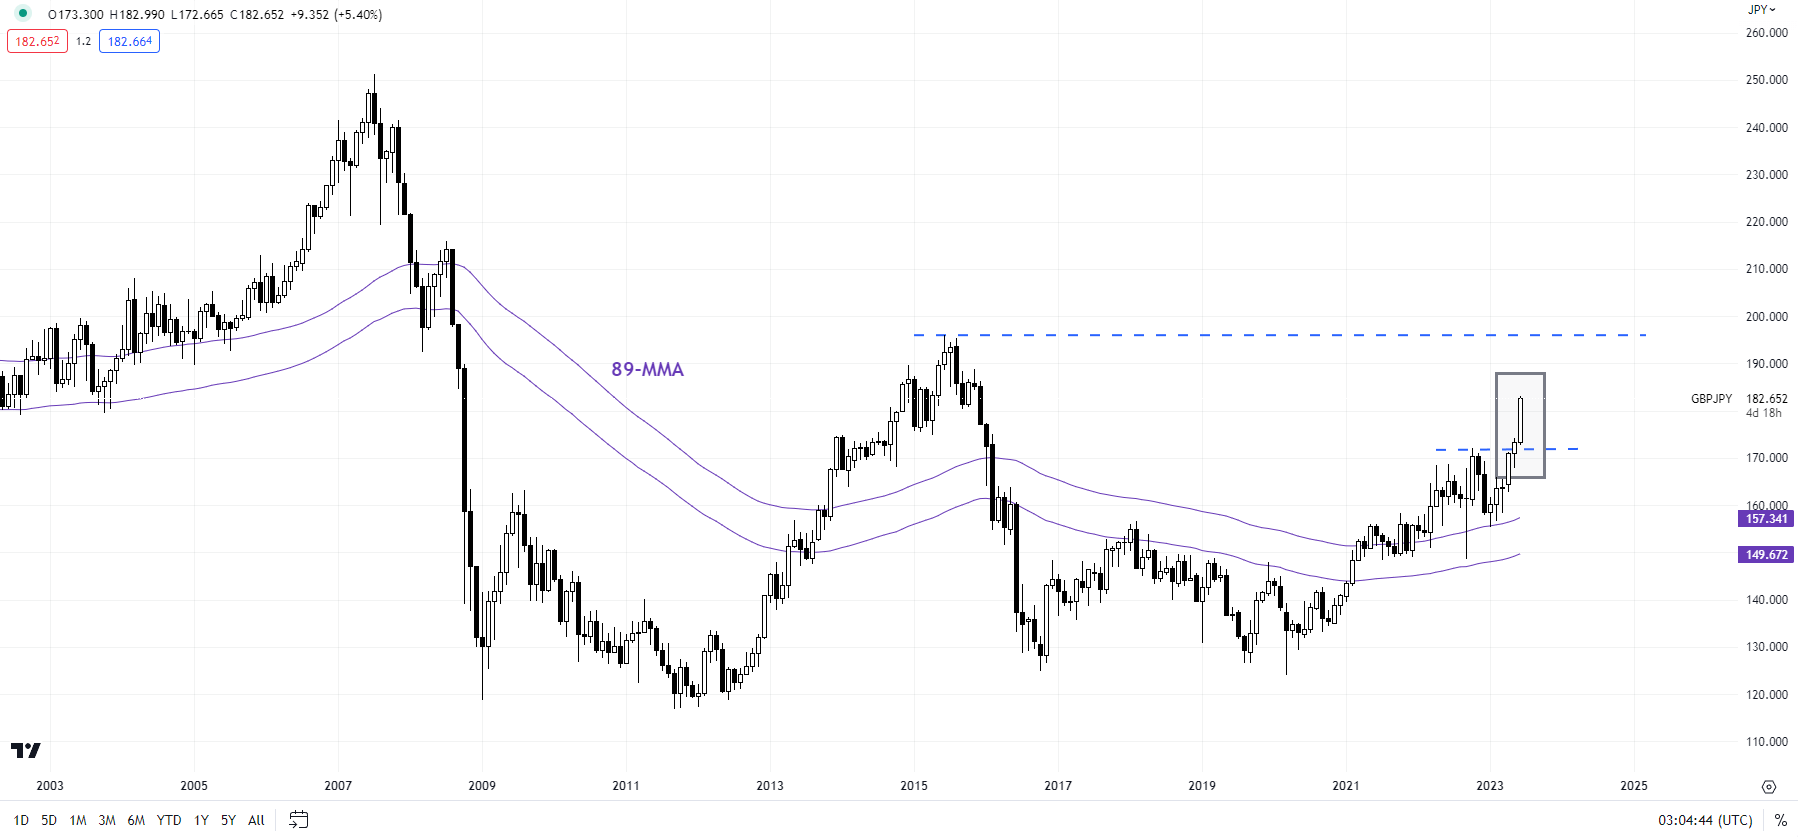
GBP/JPY appears to be headed toward the 2022 high of 172.15 following the break above the median line of a pitchfork channel since February. For more discussion see “Japanese Yen Drops After FOMC: Price Setups in USD/JPY, AUD/JPY, GBP/JPY”, published June 15.

Note: The above colour-coded chart(s) is(are) based on trending/momentum indicators to minimize subjective biases in trend identification. It is an attempt to segregate bullish Vs bearish phases, and consolidation within a trend Vs reversal of a trend. Blue candles represent a Bullish phase. Red candles represent a Bearish phase. Grey candles serve as Consolidation phases (within a Bullish or a Bearish phase), but sometimes they tend to form at the end of a trend. Candle colors are not predictive – they merely state what the current trend is. Indeed, the candle color can change in the next bar. False patterns can occur around the 200-period moving average, or around a support/resistance and/or in sideways/choppy market. The author does not guarantee the accuracy of the information. Past performance is not indicative of future performance. Users of the information do so at their own risk.

Trade

USD/JPY and Sub-141 Hinged on US Jobless Claims and the Fed

USD/JPY and Sub-141 Hinged on US Jobless Claims and the Fed

It is a relatively quiet Wednesday for the USD/JPY. There are no economic indicators from Japan for investors to consider this morning. However, the Bank of Japan will be in the spotlight, with BoJ Board Member Noguchi speaking this morning.

After the Bank of Japan left on monetary policy and assurances of ultra-loose, a shift in rhetoric would move the dial.

Trading Derivatives carries a high level of risk to your capital and you should only trade with money you can afford to lose. Trading Derivatives may not be suitable for all investors, so please ensure that you fully understand the risks involved, and seek independent advice if necessary. A Product Disclosure Statement (PDS) can be obtained either from this website or on request from our offices and should be considered before entering into a transaction with us. Raw Spread accounts offer spreads from 0.0 pips with a commission charge of USD $3.50 per 100k traded. Standard account offer spreads from 1 pips with no additional commission charges. Spreads on CFD indices start at 0.4 points. The information on this site is not directed at residents in any country or jurisdiction where such distribution or use would be contrary to local law or regulation.

USD/JPY Price Action

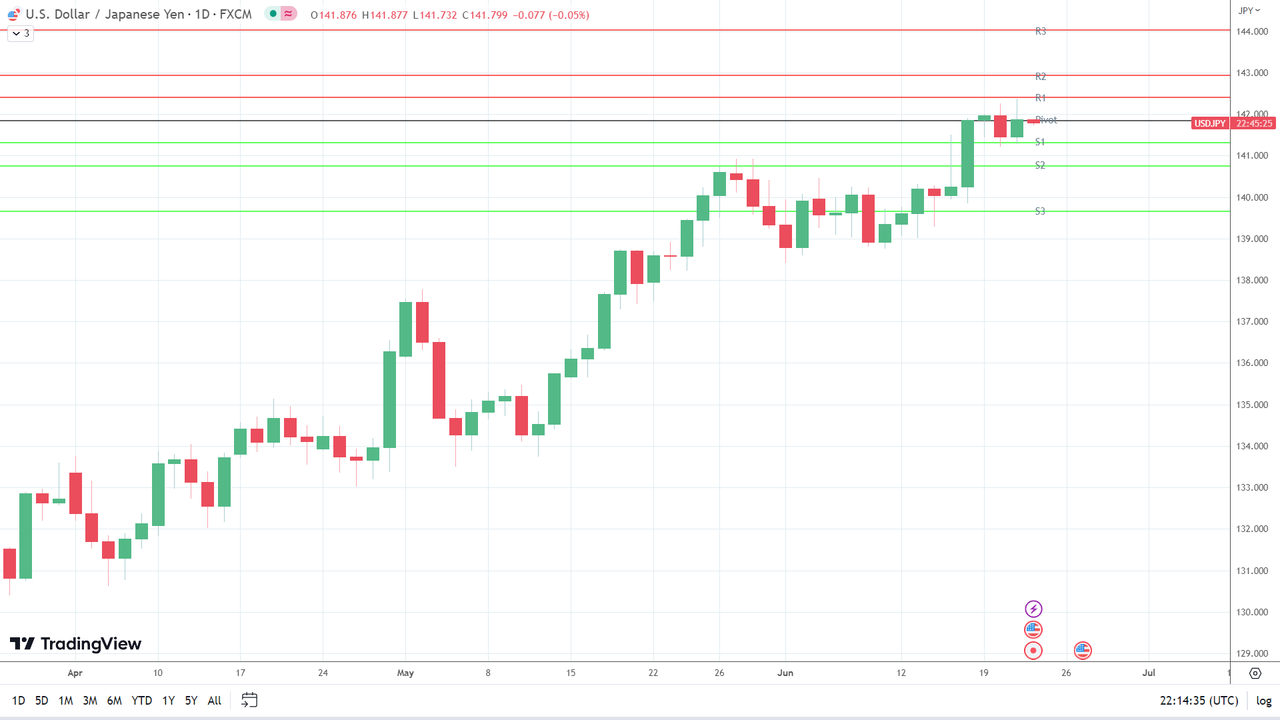
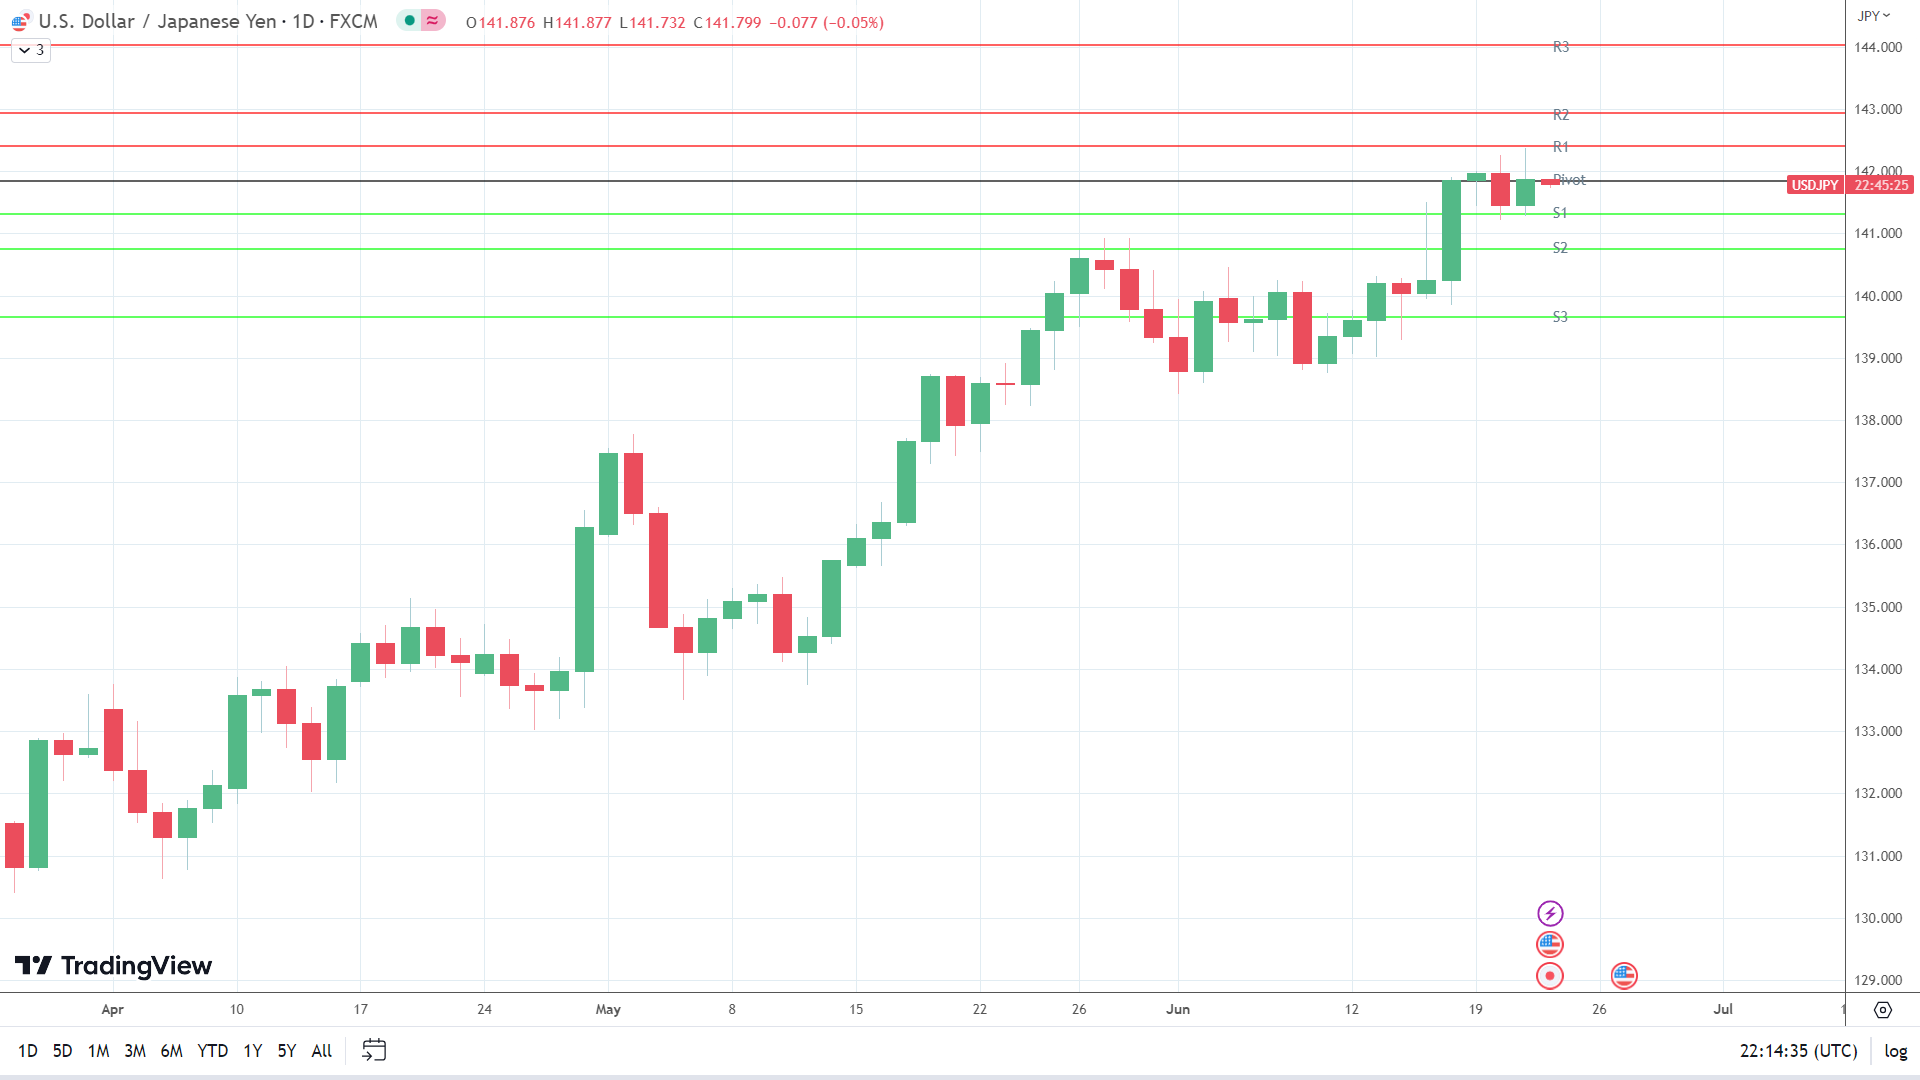
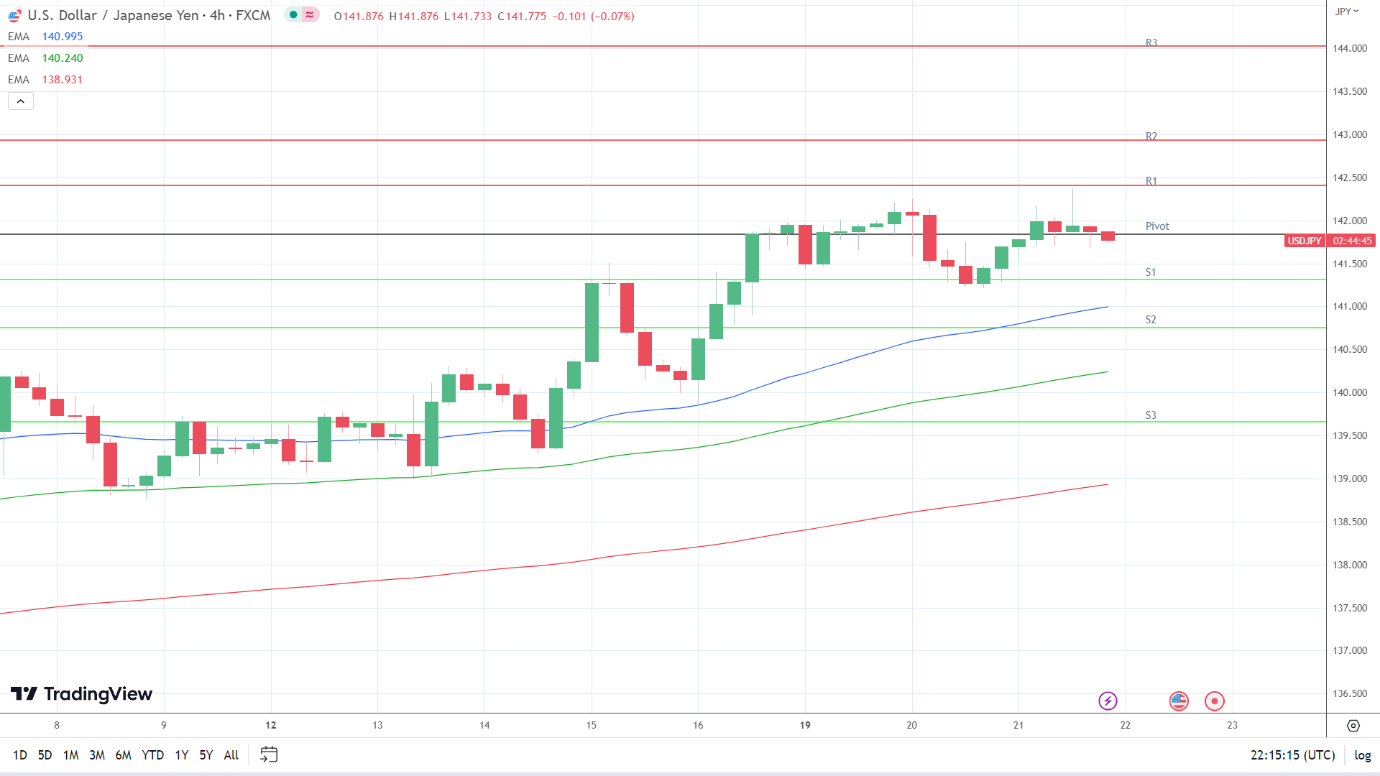
This morning, the USD/JPY was down 0.05% to 141.799. A bearish start to the day saw the USD/JPY fall from an opening price of 141.876 to a low of 141.733.

USD/JPY sees early red.

Technical Indicators

Looking at the EMAs and the 4-hourly chart, the EMAs sent bullish signals. The USD/JPY sat above the 50-day EMA (140.995). The 50-day pulled away from the 100-day EMA, with the 100-day EMA widening from the 200-day EMA, delivering bullish signals.

A USD/JPY hold above S1 (141.314) and the 50-day EMA (140.995) would support a breakout from R1 (142.404) to target R2 (142.933). However, a fall through S1 (141.314) and the 50-day EMA (140.995) would bring S2 (140.753) into view. A slide through the 50-day EMA would send a bearish signal.

EMAs are bullish.
USDJPY 220623 4 Hourly ChartResistance & Support Levels

R1 – ¥ 142.404 S1 – ¥ 141.314
R2 – ¥ 142.933 S2 – ¥ 140.753
R3 – ¥ 144.023 S3 – ¥ 139.663

The US Session

Looking ahead to the US session, it is a busier day on the US economic calendar. US jobless claims and existing home sale numbers will be in focus.

The jobless claims will have more influence, with the US labor market a consideration for the Fed. An unexpected jump in jobless claims would support the Fed doves and an extended pause on monetary policy moves.

While the numbers will draw interest, we expect Fed chatter to have more influence. Fed Chair Powell will give the second day of testimony on Capitol Hill. However, barring a deviation from the Wednesday script, FOMC member commentary will likely garner more interest.

FOMC members Waller, Bowman, and Mester are on the calendar to speak today.

After Fed Chair Powell’s first day of testimony and mixed signals from FOMC members, bets on a July rate hike eased, albeit marginally.

According to the CME FedWatch Tool, the probability of a 25-basis point July rate hike stood at 71.9% on Wednesday versus 76.9% on Monday. The chances of the Fed lifting the Fed Funds Rate to 5.75% in September decreased from 12.3% to 10.1%.

Inflation Shocker in the UK: Core CPI Spikes to 30-Year High, Driven by Spike in Services, even as Motor Fuel Prices Plunge

Inflation Shocker in the UK: Core CPI Spikes to 30-Year High, Driven by Spike in Services, even as Motor Fuel Prices Plunge

Inflation is infamous for its head-fakes and has a tendency to dish out one nasty surprise after another – at least for observers that keep expecting that inflation will somehow go down on its own. Today, the inflation shocker occurred in the UK. And this is a warning for all economies: inflation has gotten solidly entrenched in services, and is getting even worse.

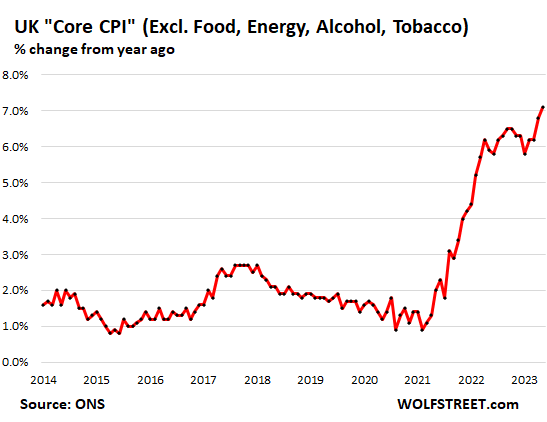
Core CPI spiked month-to-month by a scary 0.8% in May, which translates into an annualized spike of 10%, according to data from the UK Office of National Statistics (ONS) today.

Year-over-year, core CPI spiked by 7.1%, the worst since March 1992. Core CPI excludes energy, food, alcohol, and tobacco. It has now left in the dust the false-hope declines that started in November.

Major Components, Core CPI MoM YoY
Clothing, footwear 1.3% 7.0%
Housing, household services 0.3% 7.3%
Furniture and household goods 1.1% 7.5%
Health 0.6% 8.5%
Transport 0.3% 1.3%
Communication 0.9% 9.0%
Recreation and culture 0.7% 6.8%
Education 0.0% 3.2%
Restaurants and hotels 1.0% 10.3%
New and used vehicles 0.5% 4.2%
Miscellaneous goods & services 0.6% 6.7%

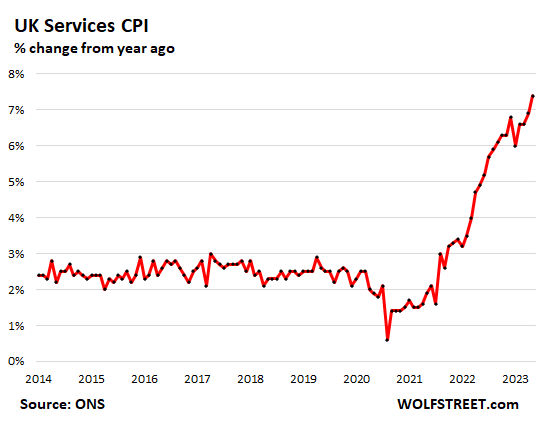
Services CPI spiked by 0.8% in May from April (10% annualized) powered by the spikes in routine maintenance +1.2%, transportation services +3.3%, including air fares +20%, recreational and cultural services +1.1%, insurance +1.1%.

Housing and household services rose “only” 0.3% for the month (but was up 7.3% year-over-year).

Year-over-year, the service CPI spiked by 7.4% in May. Inflation in services is notoriously hard to stamp out. And it’s where all heck has now broken loose – in what is a global phenomenon.

Food inflation rages at a slightly less horrible pace. The CPI for food and non-alcoholic beverages spiked by 0.9% in May from April (11% annualized), which is terrible, but it’s less terrible than in prior months. Bread and cereal: +0.8%; fish +1.8%; oils and fats +0.9%; vegetables +2.1%; sugar, jam, syrups, chocolate, and confectionary +1.7%; mineral water 1.1%.

But coffee, tea, and cocoa fell 1.6% month-to-month; fruit and meat rose “only” 0.4%; and milk, cheese, and eggs rose “only” 0.5% (that’s still 6.2% annualized).

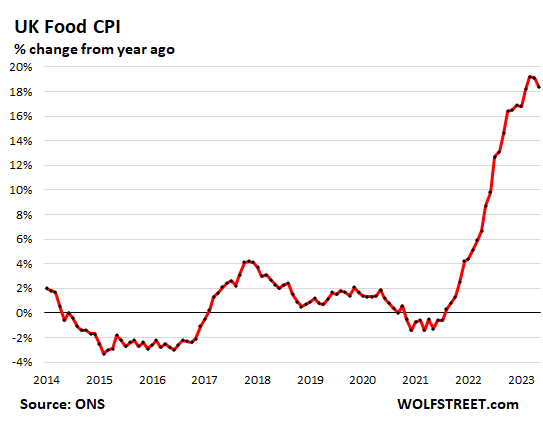
Year-over-year, the CPI for food soared by 18.4% in May, and while horrible, it was down from 19.1% in April and from 19.2% in March, the worst since 1977, according to the ONS’s “indicative modelled estimates” (its actual CPI data don’t go back that far).

But don’t blame Brexit for food inflation: there are countries in Europe with worse food inflation, including 34% in Hungary. In Germany, which didn’t have a Dexit or whatever, food inflation was 14.9% in May.

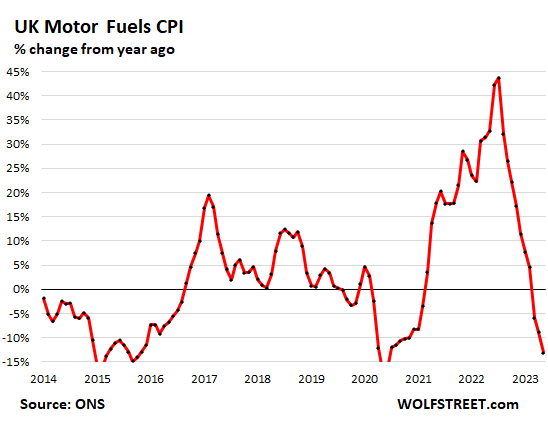
But motor fuel prices plunged by 13.1% year-over-year, after having spiked by as much as 44% last summer.

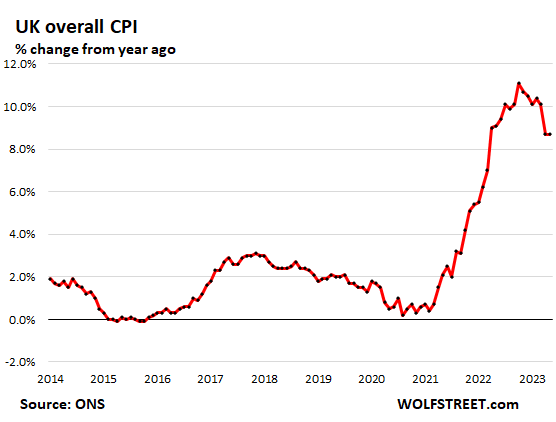
Overall CPI jumped 8.7% in May year-over-year, same as in April, and by 0.7% month-over-month (8.7% annualized), despite the plunge in motor fuels. Overall inflation had peaked at 11.1% in October.

This is the case everywhere globally: Plunging energy costs have pulled down overall inflation indices, even as the indices for underlying inflation, such as core CPI and services CPI, continue to rage near or at multi-decade worst levels. This scenario is now playing out wonderfully in the US and in the Eurozone:

But don’t blame Brexit for inflation in the UK: there are 10 countries in continental Europe with worse overall CPI inflation:

Austria 8.8%
Romania 9.6%
Lithuania 10.7%
Serbia 10.7%
Estonia 11.2%
Latvia 12.3%
Slovakia 12.3%
Czechia 12.5%
Poland 12.5%
Hungary 21.9%

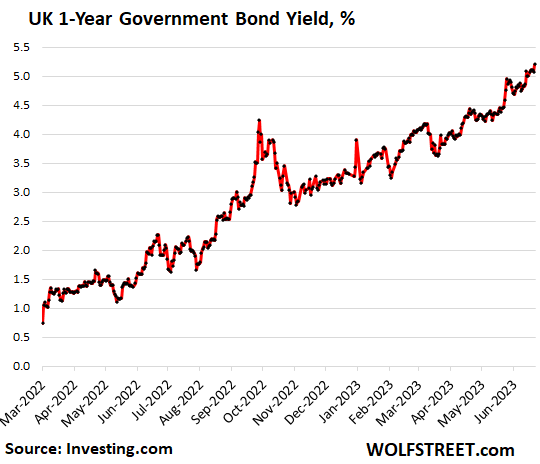
The one-year UK government bond yield, in reaction to the inflation news, rose by 12 basis points to 5.20%, the highest since 2008, as it begins to price in higher BOE policy rates than previously expected:

Enjoy reading WOLF STREET and want to support it? You can donate. I appreciate it immensely. Click on the beer and iced-tea mug to find out how: