The SNB is tightening its monetary policy further and is raising the SNB policy rate by 0.25 percentage points to 1.75%. In doing so, it is countering inflationary pressure, which has increased again over the medium term. It cannot be ruled out that additional rises in the SNB policy rate will be necessary to ensure price stability over the medium term. To provide appropriate monetary conditions, the SNB also remains willing to be active in the foreign exchange market as necessary. In the current environment, the focus is on selling foreign currency. The SNB policy rate change applies from tomorrow, 23 June 2023
GBP/USD stays on the back foot near 1.2750 ahead of BoE policy decision
GBP/USD is trading in a narrow range near 1.2750 ahead of the key BoE decision on Thursday. Pound Sterling ignores rising bets for a 50 bps BoE lift-off, following hot UK inflation data. A modest US Dollar bounce weighs on the pair.
GBP/USD fell below 1.2700 on Wednesday but erased its daily gains in the second half of the day. Early Thursday, the pair stays relatively calm at around 1.2750 as investors wait for the Bank of England (BoE) to announce the monetary policy decisions.
The BoE is widely expected to raise its policy rate by 25 basis points (bps) to 4.75%. Since there won’t be a post-meeting press conference, market participants will scrutinize the policy statement for fresh clues on the policy outlook.
Although it is unlikely, a 50 bps rate hike would be seen as a significant hawkish surprise and provide a boost to GBP/USD. In May, two policymakers voted to keep the policy rate unchanged. In case these policymakers turn hawkish and the BoE raises the rate via a unanimous vote, Pound Sterling could stay resilient against its rivals. In that scenario, comments on inflation developments could impact the currency’s valuation.
Inflation and wage inflation in the UK proved to be uncomfortably high since the last policy meeting and the BoE’s forecasts about inflation dropping sharply from April turned out to be inaccurate to say the least. An acknowledgement of stubbornly high inflation and the need for further tightening could help Pound Sterling find demand.
On the other hand, GBP/USD could turn south if the BoE downplays latest inflation readings and refrains from committing to additional rate hikes.
It’s worth mentioning that GBP/USD closed the previous three weeks in positive territory and gained nearly 4% during that period. Strong wage inflation data from the UK and the broad-based US Dollar weakness on the Federal Reserve’s decision to pause rate hikes fuelled the pair’s rally. Markets seem to have already priced in a hawkish BoE outcome and they will look for more than just a 25 bps hike to commit to another leg higher in GBP/USD.
Canadian Dollar Outlook: USD/CAD in Freefall after Double Top Confirmation Signal
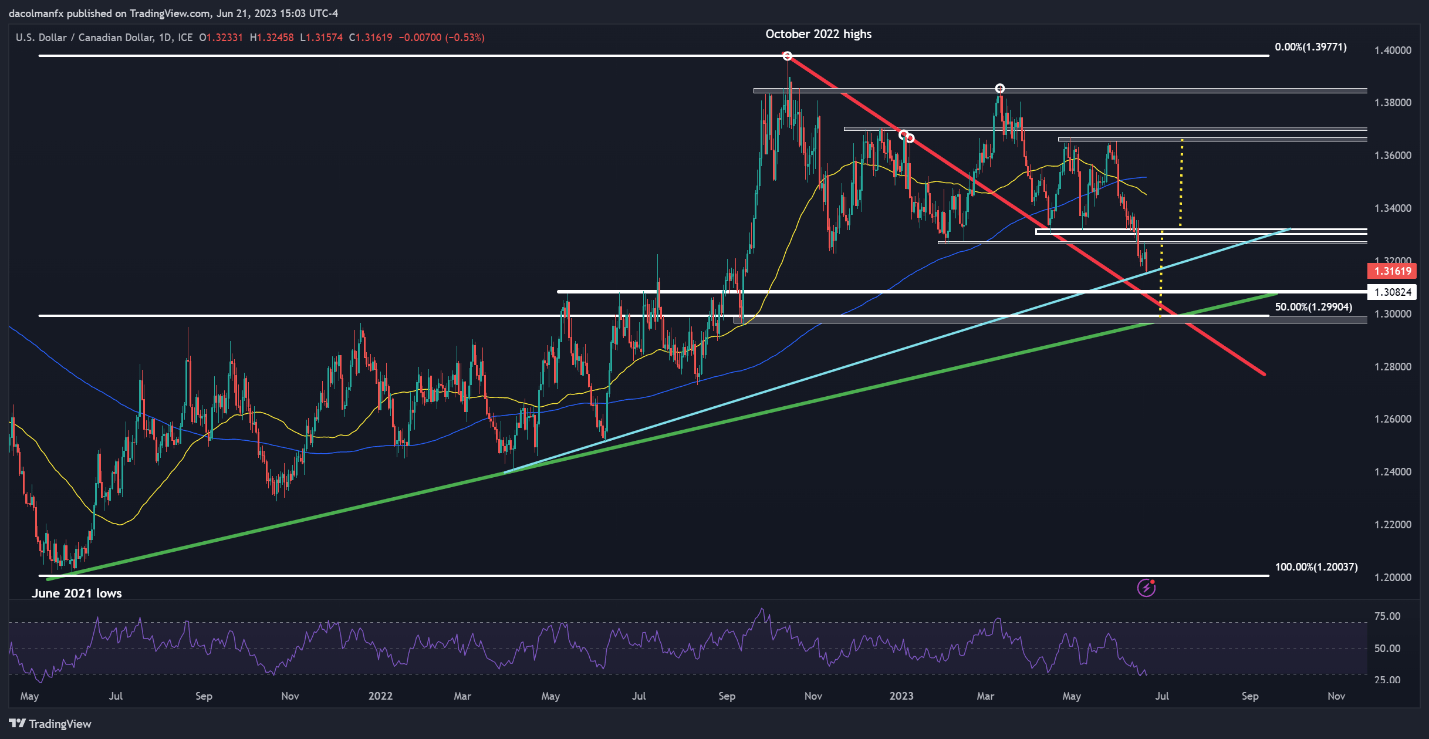
USD/CAD broke below the 1.3300 level decisively last Thursday, confirming a double top pattern, a technical setup with negative implications for the underlying asset once validated. Immediately following the breakdown, the pair plunged into freefall, pausing briefly earlier this week, but continuing its descent today, with the exchange rate currently sitting at its lowest point since September 2022.
After the latest pullback, USD/CAD is probing a dynamic support zone near 1.3150 created by an ascending trend line extended from last year’s April lows. For guidance about the near-term outlook, traders should closely watch how prices react around current levels in the coming sessions, but there are two possible scenarios worth highlighting.
Scenario 1: Breakdown
If USD/CAD breaches trendline support at 1.3150 in a clean and clear break on daily closing basis, sellers are likely to take undisputable control of the market, setting the stage for the next leg lower of the double top bearish projection (see chart). This could imply a move toward 1.3080 ahead of a possible retest of 1.2990, the 50% Fibonacci retracement of the June 2021/October 2022 rally.
Scenario 2: Rejection
If bulls fend off the current bearish assault and spark a market turnaround, initial resistance appears at 1.3270. If this barrier is taken out, buyers may regain the upper hand, paving the way for a climb toward 1.3300. Further gains may be in store for USD/CAD on a push above the 1.3300 handle, with bulls possibly eyeing the 50-day simple moving average near 1.3450 in the event of a breakout.
USD/CAD TECHNICAL CHART
Asia Day Ahead: Fed Chair Took the Stage with Hawkish Comments
Federal Reserve (Fed) Chair Jerome Powell took the stage yesterday with a series of hawkish comments and while the Fed funds futures did not see much of a change in terms of rate expectations, US equities seem to be taking his words more seriously (DJIA -0.30%; S&P 500 -0.52%; Nasdaq -1.21%).
The Fed Chair maintained his stance that the inflation fight ‘has a long way to go’ and that most central bank officials expect rates to rise further, but nevertheless, a significant degree of data-dependence is still in place. That injects less commitment and more wait-and-see in the central bank’s guidance, with the Fed Chair even labelling further hikes (50 basis-point) as ‘a pretty good guess’.
With that, the US dollar failed to move higher overnight (-0.45%) as Treasury yields pared initial gains to close largely flat to slightly higher. Gold prices managed to find some dip-buying, although the formation of a new lower low on the daily chart still points towards some exhaustion. With tight labour market conditions continuing to be highlighted by the Fed Chair as a justification for further hawkishness, much focus will be on the US jobless claims today.
Following a close to 10% surge since the start of the month, a minor head-and-shoulder formation seems to be in place as the index failed to overcome the 1,900 level of resistance. It could still be a consolidation phase for another leg higher, but for now, the bearish crossover on Moving Average Convergence/Divergence (MACD) points to some near-term exhaustion. Any breakdown of the neckline below the 1,850 level could potentially pave the way to the 1,810 level next, where a confluence of support will be on watch to underpin a higher low.
Asia Open
Asian stocks look set for a mixed open, with Nikkei -0.04%, ASX -0.80% and KOSPI +0.36% at the time of writing. Despite the general correlation with the US, the Nikkei has showed some resilience this morning despite the downbeat handover from Wall Street. On the other hand, the ASX 200 seems on track for its second straight day of losses, having unwound close to half of its last two weeks’ gains.
Markets in Hong Kong and mainland China are closed today for the Dragon Boat Festival holiday, so that offers some break for Chinese equities from the renewed tensions in the US-China relationship. China has taken offence with the US President’s remark of President Xi as a ‘dictator’, pushing back against the idea that US-China relationship could be warming with Secretary of State Antony Blinken’s visit.
The day ahead will bring focus to interest rate decision from Philippines and Indonesia, with expectations for both central banks to keep rates on hold. The action could be on the Bank of England (BoE) rate decision instead, which is widely expected to push on with further tightening.
For the Straits Times Index, it continues to trade within a symmetrical triangle pattern, which denotes some market indecision. With the index heading closer to the triangle apex, one to watch will be a potential breakout on either sides to denote buyers or sellers gaining greater control. Any breakdown of the lower triangle trendline could leave the March 2023 bottom on watch at the 3,100 level.
On the watchlist: GBP/USD on hold ahead of BoE meeting
Another round of upside surprises in UK May inflation has not provided the BoE any slack ahead of its meeting today, with the central bank likely to retain its hawkish tone that the tightening cycle is far from over. Initial reaction for the GBP/USD to the inflation data was mixed however, as much hawkishness has previously been priced while another 150 bp worth of tightening will come with higher trade-off for growth conditions and makes a UK recession more likely than not.
With a 25 bp hike being a done deal at the upcoming meeting, along with expectations for a terminal rate at 6%, the pair seems to be largely on hold for further validation from the central bank. The higher highs and higher lows since September last year continue to put an upward trend in place, with a series of support lines (200-day MA, downward trendline support, Ichimoku) on watch to provide a higher low in the event of a retracement. Any upside may leave resistance at the 1.300 level.
Gold Price Action: XAU/USD Vulnerable After Powell’s Remarks
Gold has softened a bit after hawkish remarks from US Federal Reserve Chair Jerome Powell and is beginning to look vulnerable to a break below key support.
Gold has been largely holding above key support – the previous update highlighted that gold may not be ripe for a break below support – see “Gold Price Setup: Can Stretched Long Positioning in XAU/USD Trump Technicals?” published June 8. However, Powell’s testimony to the House Financial Services Committee may have just lowered the bar for the yellow metal to soften further.
XAU/USD 240-minute Chart
Powell maintained the hawkish stance, saying further rate increases are “a pretty good guess” and that the June pause didn’t imply a pause in the hiking cycle while reiterating the outlook for two more rate hikes before the end of the year.
Meanwhile, Atlanta Fed President Raphael Bostic said the Fed would need to wait at least past its July meeting to decide on further rate increases. While on balance Bostic’s comments were a touch dovish, it probably has implications for the path, and not the trajectory of rate hikes, keeping the yellow metal under pressure.
XAU/USD Daily Chart
Chart Created by Manish Jaradi Using TradingView
The reversal in the slope of the 89-period and the 200-period moving averages on the 240-minute charts from up to down speaks about the evolving trend even though XAU/USD has barely moved in recent weeks. The yellow metal has failed to cross above the two moving averages, and lower lows raise the odds of a move lower in the short term.
XAU/USD Weekly Chart
Chart Created by Manish Jaradi Using TradingView
On the daily chart, gold is so far holding above quite a strong cushion around 1930, including the end-May low, the 89-day moving average, and the lower edge of the Ichimoku cloud. Any break below 1930 could open the door toward the 200-day moving average (now at about 1850). On the upside, gold would need to rise above 1970-1985 for the immediate downward pressure to reverse.
A large part of the current weakness seems to be a spillover effect of what’s happening on higher timeframe charts, as highlighted in recent months. See “Gold Could Find It Tough to Crack $2000”,published March 28, and “Gold Weekly Forecast: Is it Time to Turn Cautious on XAU/USD?” published April 16. Subsequent updates can be found here:April 24,May 10,May 17, andMay 31.
AUD/USD Price Forecast: US Influences Shaping Aussie
AUSTRALIAN DOLLAR FUNDAMENTAL BACKDROP
The Australian dollar remains on the backfoot this Thursday morning after Fed Chair Jerome Powell’s hawkish first day Testimony before Congress. That being said, the Fed’s Bostic pushed for rates to remain on hold for the rest of 2023 and may be on of the two doves revealed in the revised 2023 Dot Plot revision chart. The recent divergence between the two central banks with the Reserve Bank of Australia (RBA) minutes slightly more dovish than the Fed, may be contributing to AUD weakness. In addition, there is still a disconnect between the Fed’s guidance and money market pricing in terms of rate hike expectations and upcoming economic data next week should provide some valuable input as a gauge to determine how rates may unfold.
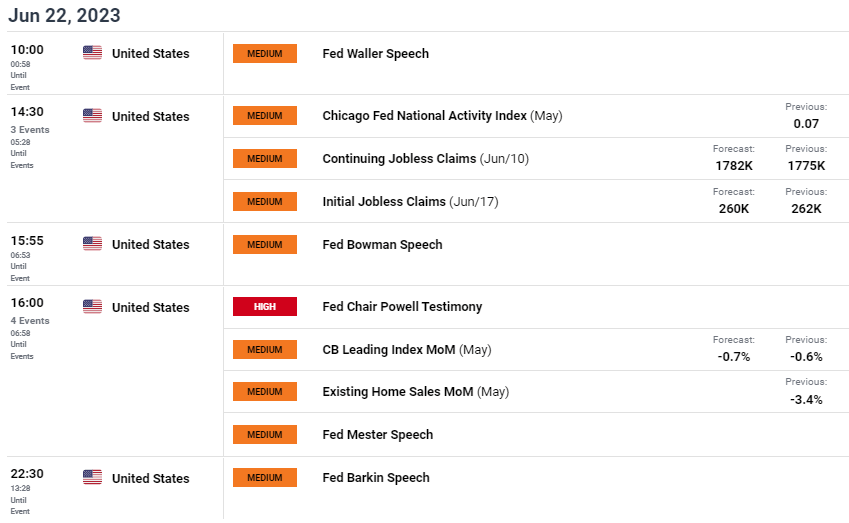
Today’s schedule is centered firmly around the US dollar with initial jobless claims, Fed speak and Fed Chair Powell’s second day of Testimony.
AUD/USD ECONOMIC CALENDAR (GMT +02:00)
TECHNICAL ANALYSIS
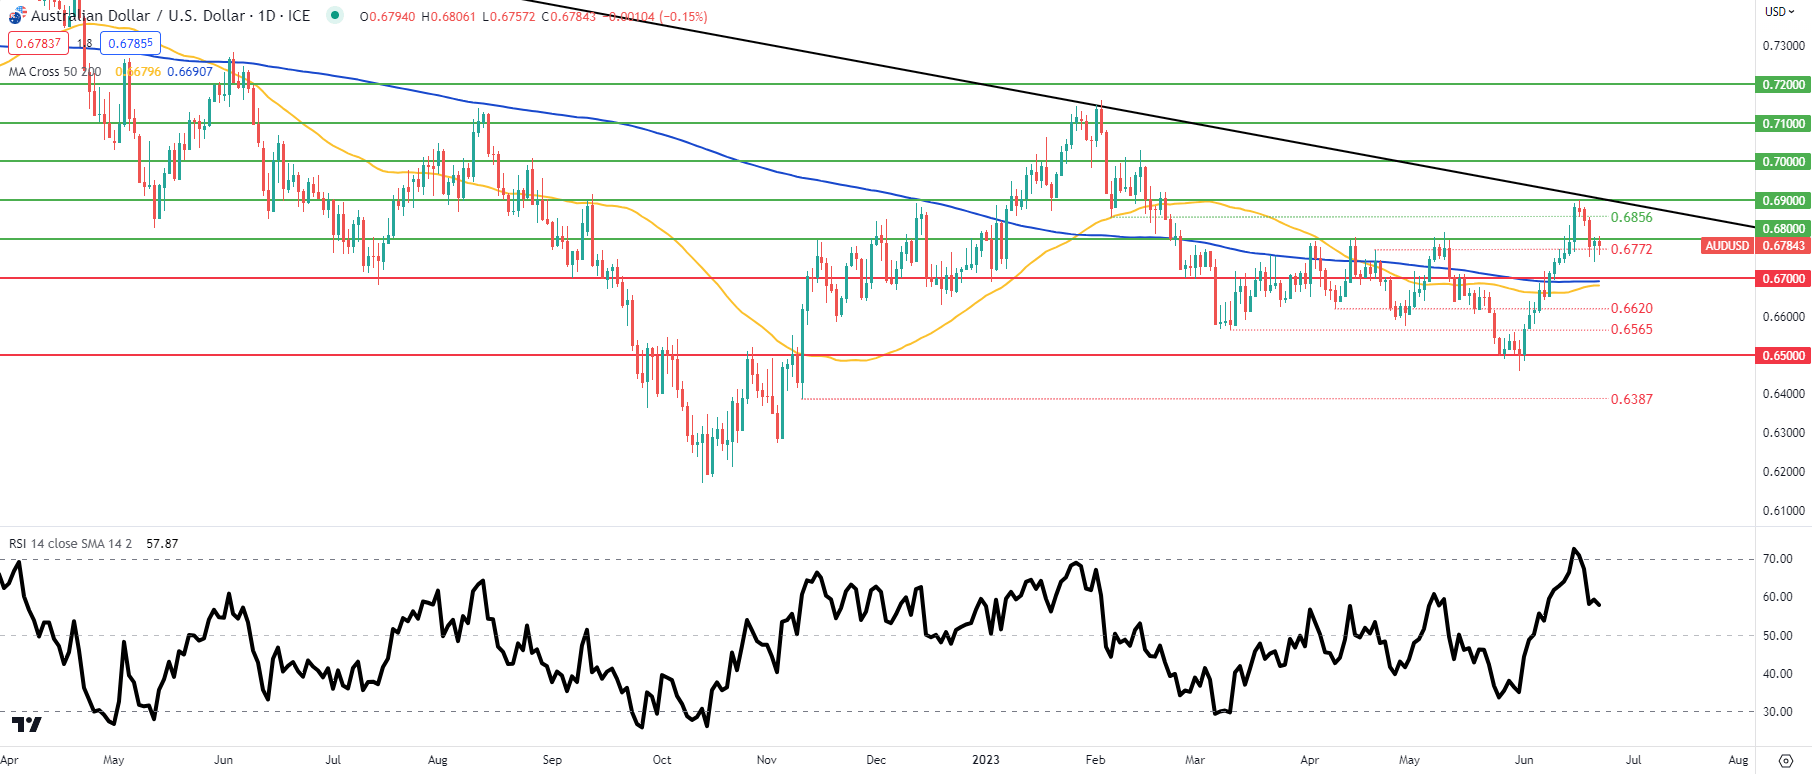
AUD/USD DAILY CHART
Daily AUD/USD price action continue on the short-term downtrend after Aussie bulls failed to break above the long-term trendline (black) for the second time coinciding with an overbought signal via the Relative Strength Index (RSI). There is unlikely to be too much volatility prior to Mr. Powell’s Testimony but the golden cross potential is still very much in play and could result in another AUD rally.
Japanese Yen Outlook: Fed-BoJ policy divergence remains the key driving force
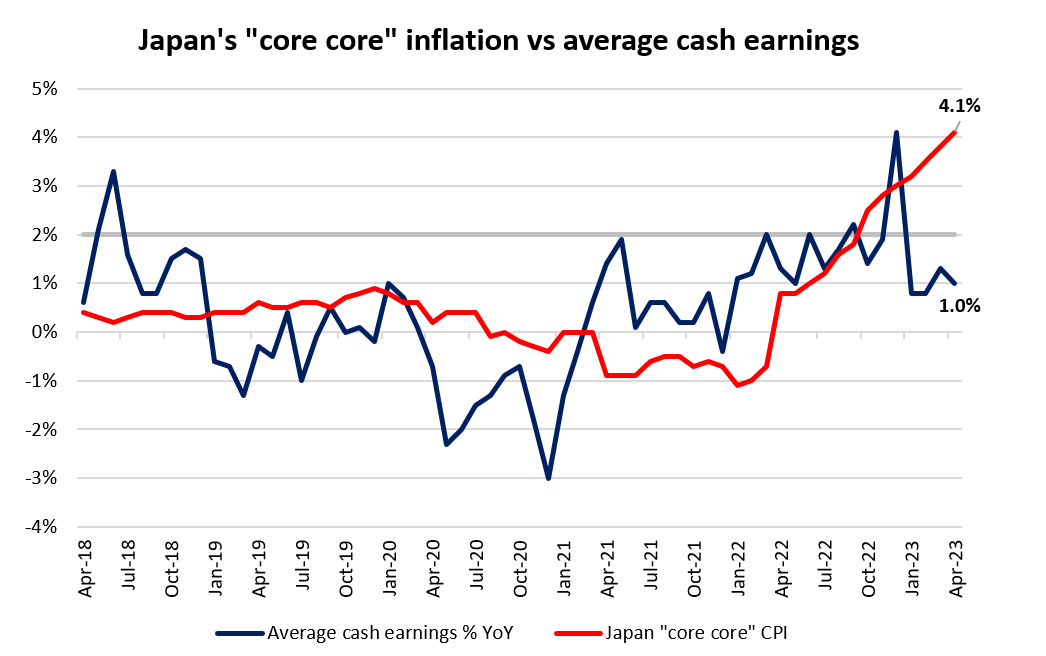
While the Federal Reserve (Fed) has largely retained its hawkish tone at the latest meeting, speculations for a quicker policy shift from the Bank of Japan (BoJ) have not been receiving much validation by policymakers thus far. The persistent rise in Japan’s “core core” inflation to more than two-fold the central bank’s target (4.1% versus 2% target) has been an argument from the hawks but considering that improving wage dynamics has not been broad-based, that has provided some basis for the BoJ to continue defending their stance of inflation being ‘transitory’.
Current interest rate futures remain well-anchored for the BoJ to leave interest rate unchanged at least over the next two policy meetings. Perhaps the greater focus will be on whether the central bank will exercise further tweaks to its yield curve control (YCC) policy, as markets have been highly sensitive to any slightest signs of policy normalisation from the central bank.
That said, the BoJ has not been the best at communications. One may recall how the central bank threw markets off guard back in December 2022 with a surprise widening of its 10-year bond yield cap, dragging the USD/JPY down by 4.3% in a single day. With the still-ambiguous outlook on how the BoJ may normalise policies eventually, any tweaks will continue to come with an element of surprise. At least for now, the tone from the central bank seems to be pointing to more wait-and-see, which provides some runway for the Fed-BoJ policy divergence story to continue.
How did past BoJ’s intervention play out?
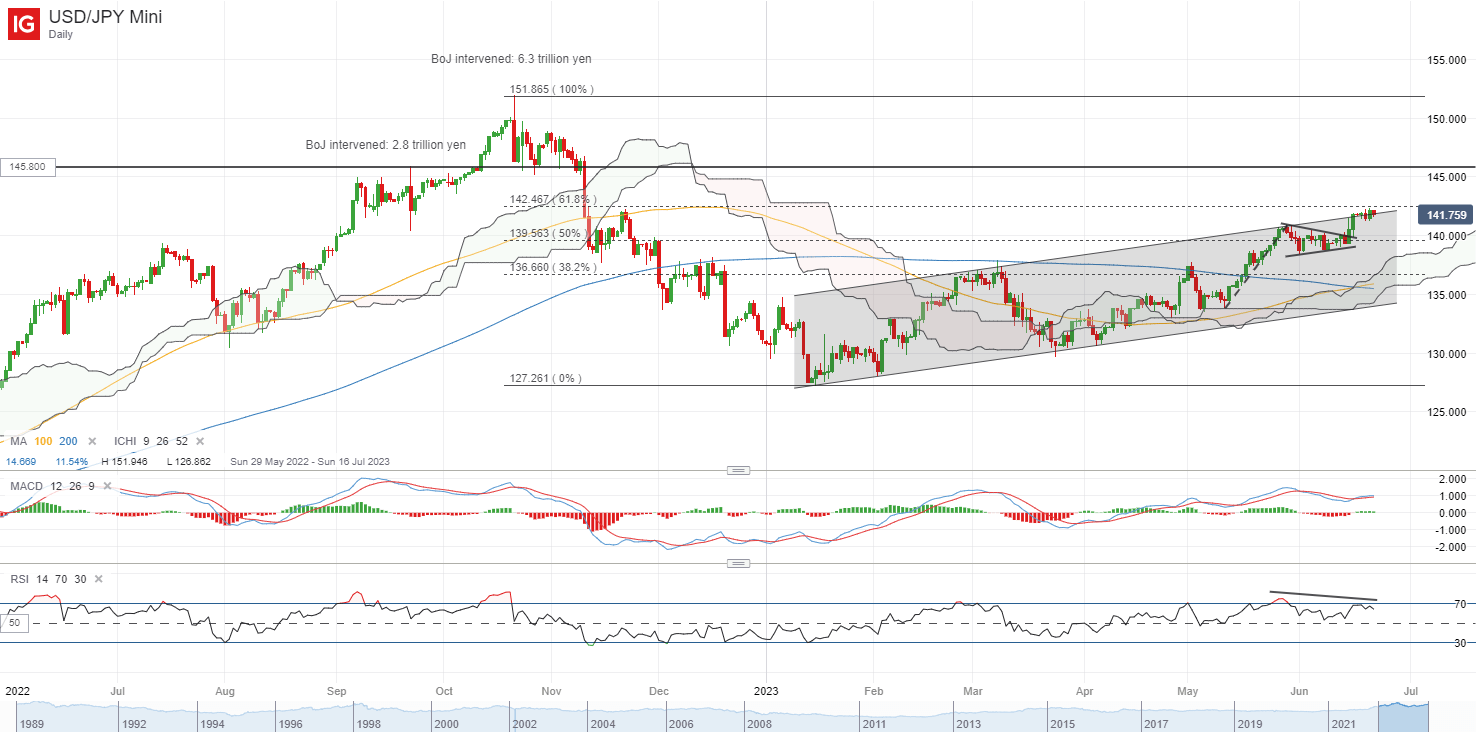
The BoJ has intervened in the currency market thrice last year, once in September 2022 by buying 2.8 trillion yen while selling the US dollar. The second and third occasions are on 21 and 24 October 2022, with an overall 6.3 trillion yen amount. While the October intervention has allowed the USD/JPY to find a top, recent resurgences in the pair seems to suggest that as long as the policy divergence remains, any impact from interventions could be temporary and unsustainable over the longer run.
Thus far, policymakers’ concerns on the weaker yen have not been as prominent as it was last year. Recent comments from the BOJ Governor Kazuo Ueda also highlighted that focus is on the pace and timing of decline as compared to an absolute level, which may point to some acceptance for now.
Technical analysis: USD/JPY closing in on BoJ intervention level back in September 2022
On the daily chart, the USD/JPY has been trading within a rising channel pattern since the start of the year, with a bullish crossover formed between its 100-day and 200-day moving average (MA). Despite the recent lacklustre performance in the US dollar, the pair has managed to hold up well, as the Fed-BoJ policy divergence remains the key driver. A bullish pennant has been presented lately, although in the near term, some indecision seems to be in place with a bearish divergence on the relative strength index (RSI).
While the series of higher highs and higher lows continue to put an upward trend in place, immediate resistance may stand at the upper channel trendline, in coincidence with a 61.8% Fibonacci retracement level. Any upward break above the channel pattern may then leave the 145.80 level on watch next. To recall, the BoJ has intervened in the currency market at this level back in 22 September 2022, which could trigger concerns that the BoJ may step in once more.
Indices stay under pressure as UK inflation remains sticky
FTSE 100 drops on higher-then-expected CPI
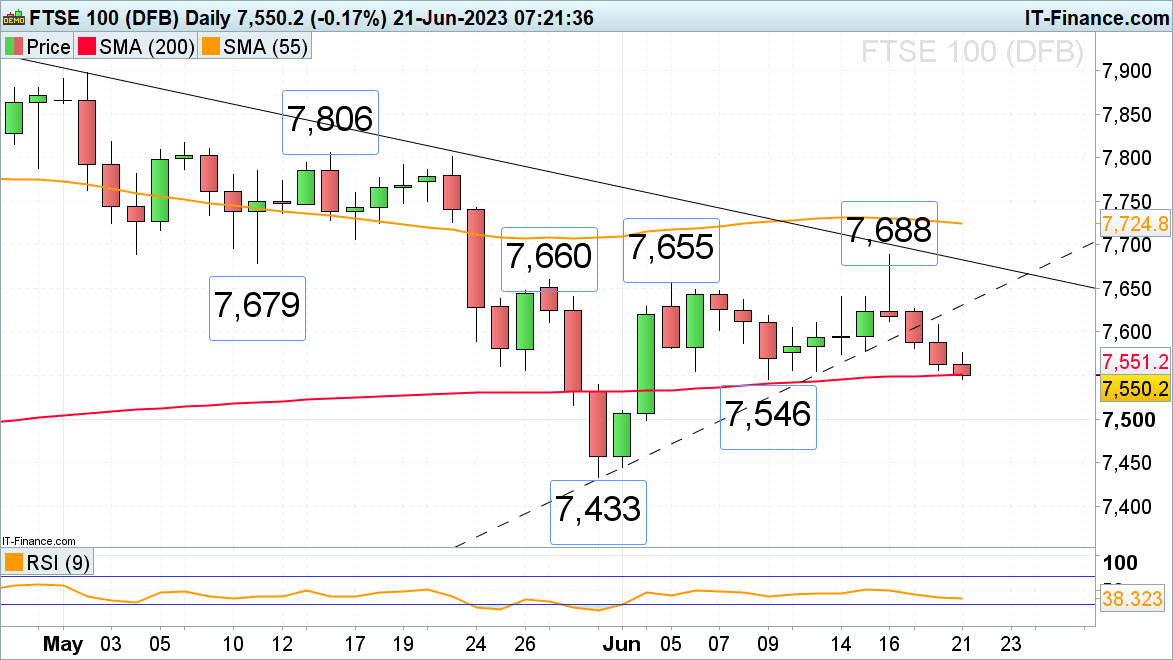
The FTSE 100 has been declining since Friday’s five-week high and is being pushed lower as UK CPI comes in higher-than-expected ahead of Thursday’s Bank of England monetary policy meeting at which the central bank is expected to hike its rates for a thirteenth time, probably to 4.75%.
The index is now pressing on the 200-day simple moving average (SMA) at 7,551 and the early June low at 7,546, a fall through which would open the way for the 1 June high at 7,510 to be reached ahead of the May trough at 7,433. Downside pressure should retain the upper hand while Monday’s low at 7,581 isn’t bettered. Further resistance can be seen along the breached May-to-June uptrend line at 7,630 which, because of inverse polarity, could act as resistance.
FTSE 100 Daily Price Chart – June 21, 2023
DAX 40 sees two consecutive days of lower prices
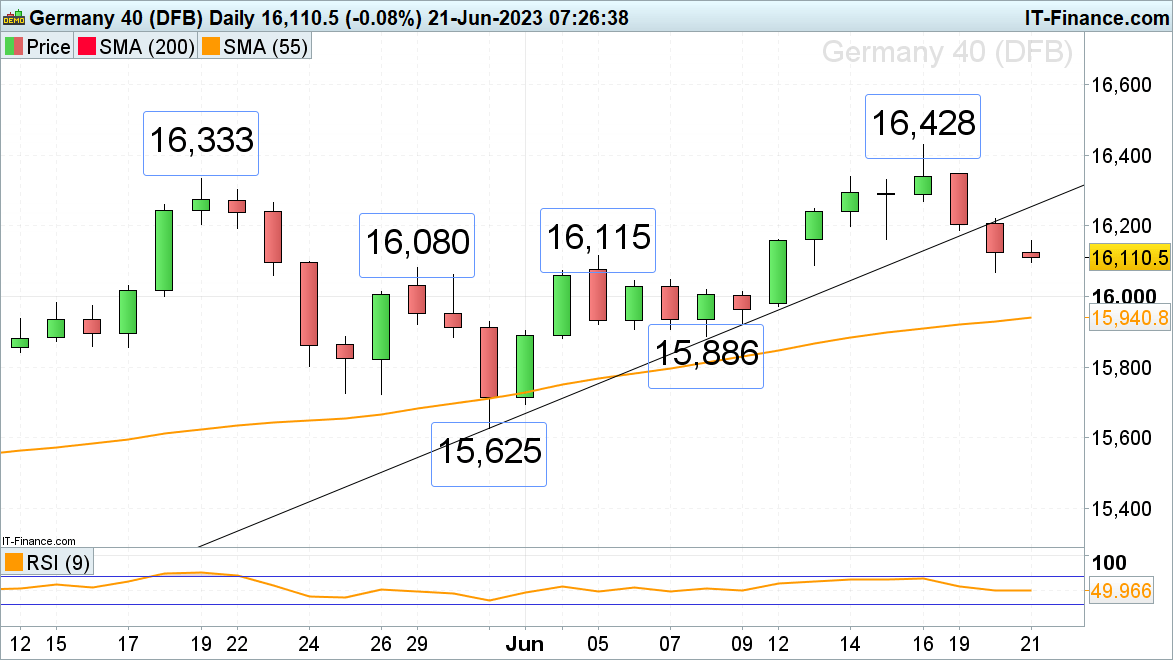
The DAX 40 has come off Friday’s new all-time record high as investors re-assess the economic outlook and future central bank policy.
A slip through Tuesday’s low at 16,067 would put the minor psychological 16,000 level back on the cards, together with the 55-day simple moving average (SMA) at 15,941. Minor resistance above last Thursday’s low at 16,160 sits at Monday’s low at 16,187 with further resistance seen along the breached May-to-June uptrend line at 16,252.
DAX 40 Daily Price Chart – June 21, 2023


S&P 500 subdued ahead of Powell testimony
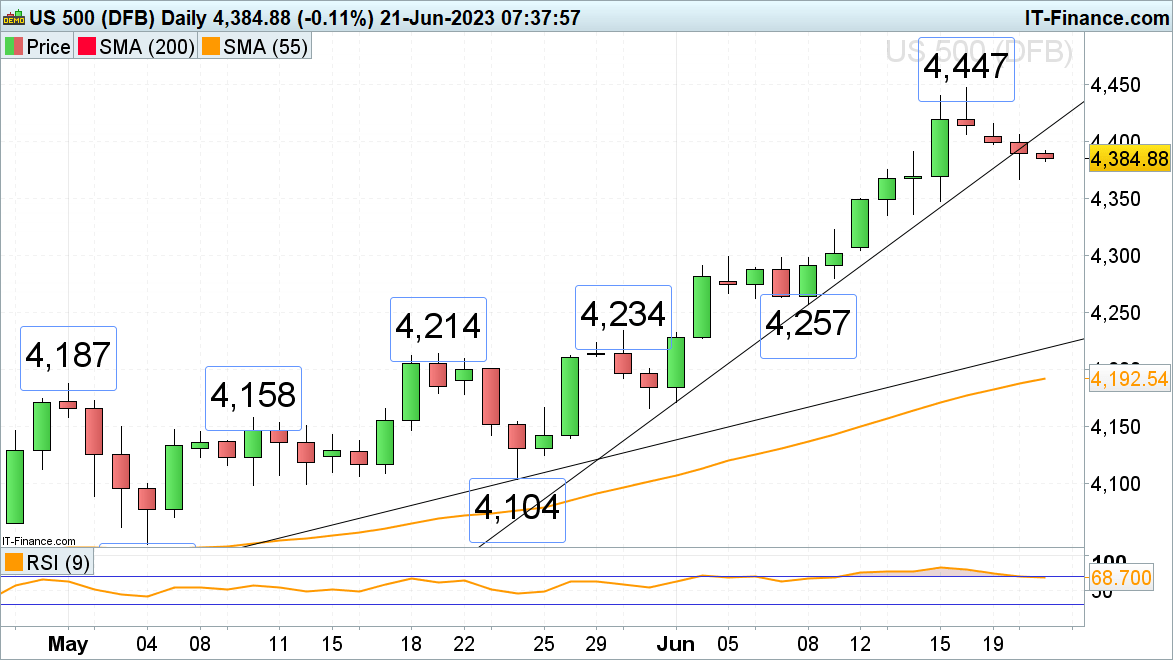
The S&P 500 is seen coming off its 14-month high at 4,447 ahead of Jerome Powell’s US Senate banking committee testimony on Wednesday and Thursday which is likely to re-iterate the Federal Reserve’s (Fed) hawkish stance. With the index having slid through its June uptrend line at 4,410, a short-term downside bias is in place. Failure at Tuesday’s low of 4,367 would put last Thursday’s low at 4,348 on the map.
Minor resistance is to be found around the minor psychological 4,400 mark and at Tuesday’s high at 4,405.
S&P 500 Daily Price Chart – June 21, 2023
DailyFX provides forex news and technical analysis on the trends that influence the global currency markets.
Japan’s PM Kishida: To mobilize all policy steps to ensure wage growth
Japanese Prime Minister Fumio Kishida is sounding upbeat on the nation’s economic outlook, in his speech on Wednesday.
Key quotes
We can’t miss chance to increase wages.
To mobilize all policy steps to ensure wage growth.
Positive moves are appearing in Japan’s economy.
Will create new investment package for areas including semiconductors and energy.
Aiming for a V-shaped recovery in inbound tourists by 2025.
GBP/USD climbs toward 1.2800 on hot UK inflation
GBP/USD gained traction and advanced toward 1.2800 with the initial reaction to the UK inflation data, which showed that the Consumer Price Index (CPI) rose 8.7% on a yearly basis in May, matching April’s increase and surpassing the market expectation of 8.4%.
GBP/USD fluctuates in a narrow channel slightly below 1.2800 in the European morning on Tuesday as investors refrain from taking large positions ahead of the UK inflation data on Wednesday. The negative shift seen in risk mood could cause the pair to extend its downward correction in the second half of the day.
The People’s Bank of China (PBoC) announced early Tuesday that it lowered the benchmark Loan Prime Rates (LPRs) by 10 basis points (bps) as expected. This decision revived concerns over a slowdown in global economic activity, making it difficult for risk-sensitive Pound Sterling to find demand.
Meanwhile, market researcher Kantar said that grocery inflation in the UK continued to soften in June, falling from 17.2% to 16.5% in the four weeks to June 11. “This is the lowest rate of grocery price inflation we’ve seen in 2023, which will be a relief to shoppers and retailers,” said Fraser McKevitt, head of retail and consumer insight at Kantar.
On Wednesday, the UK’s Office for National Statistics (ONS) will release the Consumer Price Index (CPI) data for May. Following Kantar’s report, investors are unlikely to prematurely bet on the potential positive impact of a hot inflation reading on Pound Sterling.
Reflecting the risk-averse market atmosphere, US stock index futures are down between 0.4% and 0.6%, while the UK’s FTSE 100 Index trades flat following a positive opening. A sharp decline in Wall Street’s main indexes after the opening bell should support the US Dollar (USD) and weigh on the pair.
St. Louis Federal Reserve (Fed) President James Bullard and NY Fed President John Williams are scheduled to speak later in the day as well. Unless Fed policymakers adopt a dovish tone, the market mood should continue to drive GBP/USD’s action.