US Dollar Technical Outlook: EUR/USD, GBP/USD, NZD/USD Price Setups

US Dollar Technical Outlook: EUR/USD, GBP/USD, NZD/USD Price Setups

EUR/USD Surrendered Last Week’s Gains as Policy Divergence Extends

Earlier this week the ECB President Christine Lagarde mentioned that she is “really confident” that euro zone inflation is under control. The sentiment presented is in stark contrast to that revealed in the Fed minutes last night where the overall message was that the committee’s confidence in getting inflation back to 2% has been negatively affected and it will take longer to regain it. The minutes were recorded before the most recent, lower US CPI print but emphasises that it is going to take more than one decent print to get the Fed seriously considering interest rate cuts.

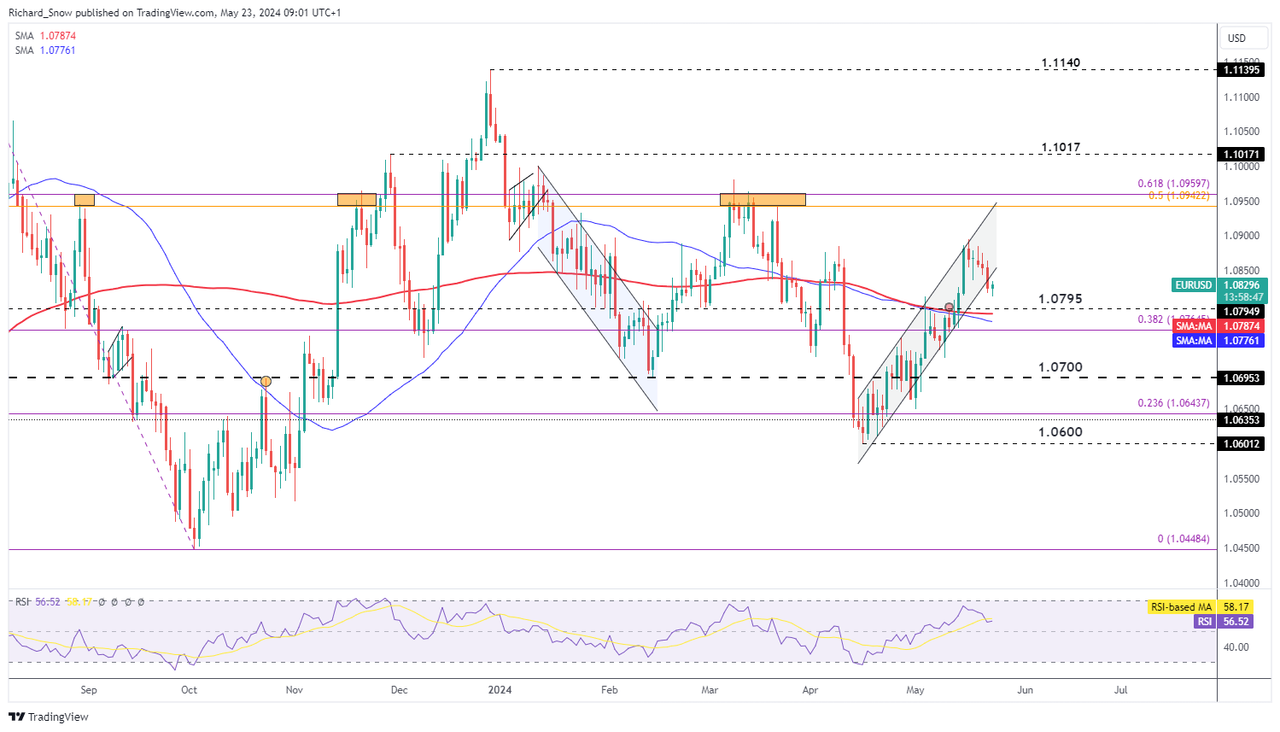
EUR/USD was expected to surrender last week’s gains as a quieter week on the economic calendar provided an opportunity for the FX market to prioritise higher yielding currencies like the US dollar, Pound Sterling and the Kiwi dollar. EUR/USD continued to trade lower and has broken out of the ascending channel, but trades slightly higher in the London AM session after improved European flash PMI data for May. German manufacturing data – which has been terribly weak for many months now – headed closer to the neutral 50 mark and was accompanied by a marginal improved sentiment in the services sector too.

Channel support, now resistance, serves as the nearest challenge to dollar strength heading into the end of the week. 1.0800 and the 200-day simple moving average (SMA) present downside levels of interest.

EUR/USD Daily Chart

image1.png

GBP/USD Holds Firm Despite Hawkish FOMC Minutes

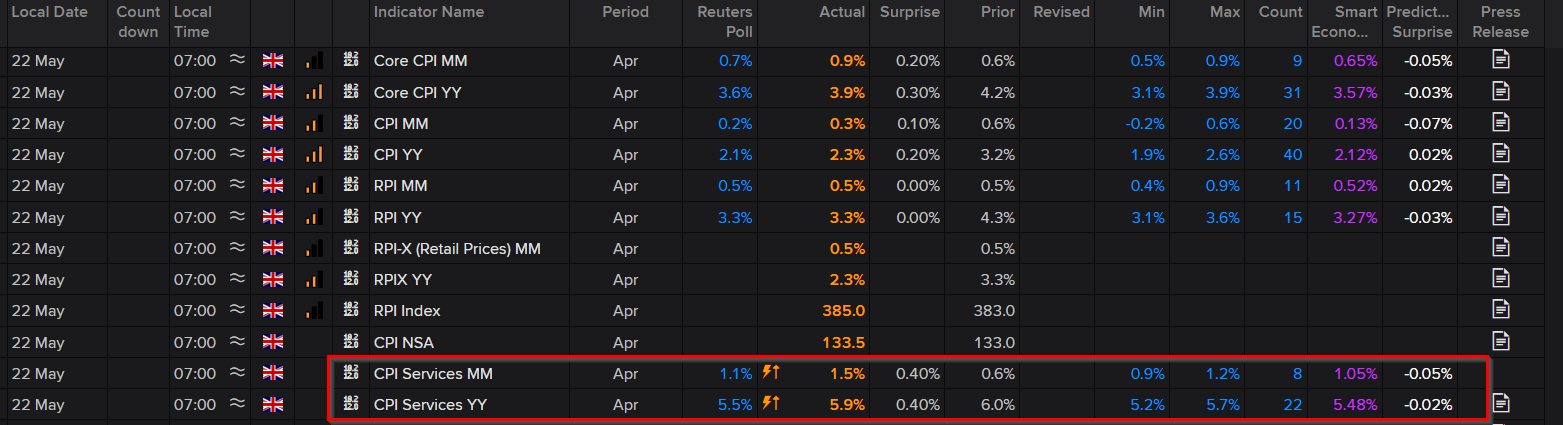
Yesterday, UK inflation data revealed that consumer inflation slowed in April but not as much as expected. One sticking point was that services inflation – a very specific measure of inflation which has been stubbornly elevated – rose above the maximum anticipated level estimated by analysts and economists polled by Reuters.

The upside surprise led to an unravelling of UK rate but bets with markets delaying a potential rate cut from August to November with just one full rate cut priced in for this year. The pound and Gilt yields rose as a result, with GBP/USD following suit.

GBP/USD shot above 1.2736 only for the hawkish FOMC minutes to bring it back down to end the day marginally higher. At the start of today’s session cable trades higher once again, proving its resiliency around that 1.2736 mark. With both the BoE and Fed leaning more hawkish, it may be difficult to get a strong directional move in the absence of another catalyst – which may appear at the end of next week with US PCE data. For now, sterling pushes higher.

GBP/USD Daily Chart

image2.png

Looking for actionable trading ideas? Download our top trading opportunities guide packed with insightful tips for the second quarter!

Hawkish RBNZ Meeting Buoys NZD/USD

The Reserve Bank of New Zealand (RBNZ) issued a clear warning around the troubling nature of domestic inflation which remains too high for comfort despite the bank maintaining one of the highest interest rates among major central banks.

The committee discussed raising interest rates and expressed that the economy has little capacity left to absorb higher interest rates, a tricky situation to be in. Markets have therefore delayed expectations of a rate cut to November.

NZD/USD has been rising since April and has continued to do so after breaking above the longer-term trendline resistance. The Kiwi dollar heads back toward the overbought conditions which may stifle further upside but there is still room in the shorter-term to add to existing gains.

0.6200 appears as the next significant upside level of resistance but first a test of yesterday’s high of 0.6152 is required. A pullback from here could see prices nestle around the 0.6050 level which coincides with the 200 SMA.

NZD/USD Daily Chart

image3.png


Trading Earnings Season: 3 Steps for Using Earnings Reports

Trading Earnings Season: 3 Steps for Using Earnings Reports

3 Steps for Using Earnings Reports in Your Trading

Preparing for earnings season involves choosing the companies to focus on and undertaking thorough research on the market before executing the trade.

1) Choose Companies to Focus On

The first step is to select the stocks to trade during the period. It is advisable for traders to go for a small number of companies, perhaps stocks with which they are familiar or trade already and find out the dates on which their earnings will be released. Large bellwether stocks are worth investigating, whether one is trading them or not, as their results can impact wider industries.

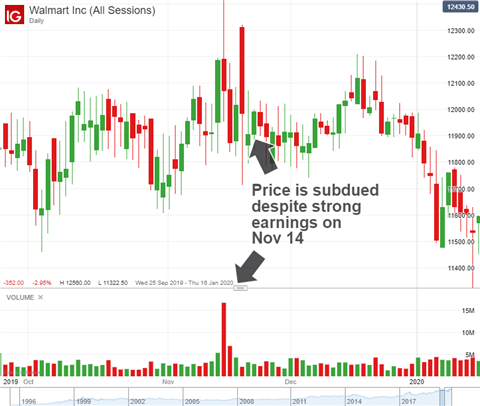
When deciding on the stocks to go for, traders should understand that the relationship between an earnings result and subsequent price reaction is not always straightforward. Although better-than-expected earnings are generally bullish, they do not always translate to immediate price gains and the opposite holds true as well. An example of this can be seen below, with Walmart’s strong earnings in Q3 2018 failing to excite market participants.

Chart to show unpredictable link between earnings and price

While encouraging, a quarterly report is more than last quarter’s results compared to expectations. Indeed, analysts are often much more concerned with the future expectations of the firm as price is a forward-looking metric, with future earnings being calculated in current prices.

With that in mind, it becomes more reasonable when investors shy away from a stock with strong results for the past quarter, but an abysmal outlook for the future. A weaker outlook can seriously undercut a stock’s current valuation, regardless of past performance, a fact that is realized all too often during earnings season.

Read our guide on How to Pick Stocks to choose the right companies for your stocks portfolio.

2) Do Your Research

Doing your stock research properly will involve looking at estimated earnings for your chosen stock and how they compare with analysts’ expectations. Also, traders should make sure they look at historical figures to get a feel for how the market has responded to releases in the past.

While earnings season is typically thought of in terms what the results mean for a single stock, the season as a whole can also offer important takeaways.

Information is offered on a company-specific basis, but common themes can ring true throughout. Headwinds like coronavirus, geopolitical tension, regulatory uncertainty or cyclicality can combine to form a wave of worries across a sector if cited often enough.

Traders should investigate how such headwinds impact one sector or stock compared to others. For example, while a great many industries suffered during the coronavirus outbreak, March 2020 saw Greece-based tanker vessel operator Top Ships Inc (TOPS) experience a surge in product demand in areas such as cleaning supplies and paper products leading to increased shipping requirements. This in turn created higher trading volume and volatility.

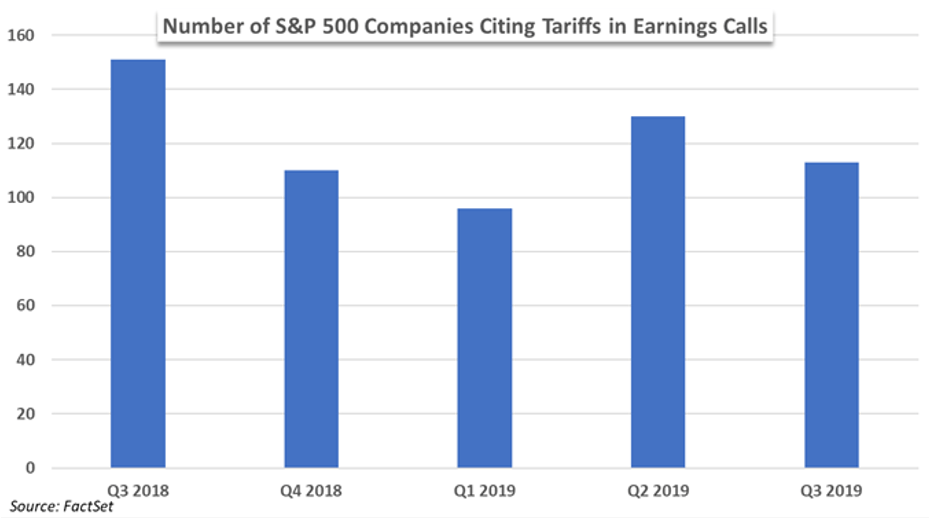
Chart to show S&P 500 companies citing tariffs in earnings calls

The effect of headwinds has also been witnessed, for example, with Brexit as companies delay capital expenditures until a post-Brexit order is established and the business environment is stable. Similarly, frequent mentions of trade-related headwinds have worked to undermine a variety of sectors from semiconductors to consumer staples in the US amid the US-China trade war, evidenced in the chart above by the surging mentions of ‘tariff’ in earnings reports for companies in the S&P 500.

While these issues may not doom a stock to negative returns singlehandedly (as the TOPS example demonstrates), their appearance across an entire market can hint at their pervasiveness and the broader downward pressure they can exert on outlooks and valuations. Consequently, traders should monitor common complaints among corporations as it may help inform their broader macroeconomic strategy as anecdotal evidence builds to form a tangible threat to the broader index.

3. Formulate a Trading Strategy – and Follow It

Formulating a trading strategy for earnings season should include methodology for entry and exits, profit goals, time spent trading and a risk management plan. Trading earnings reports is difficult and risky. For some, trading around the event may not suit their risk profile. As such, any position taken should be adequately hedged and include a stop. That said, volatility can create unique circumstances, ripe with opportunity for a few specific strategies.

When formulating a strategy for earnings season, traders should be aware that quarterly earnings are capable of seriously uprooting an ongoing price trend due to their relative infrequency and importance. This causes traders to position for severe price swings – evidenced by heightened implied volatility.

Since it is exceedingly difficult for the average investor to correctly forecast how the company will perform – never mind the eventual impact on its share price – the risk-reward of entering a position immediately prior to a report can be skewed. If an investment vehicle of choice is impacted by implied volatility, the effect on the position can be particularly acute because implied volatility remains high until the results are released but typically collapses quickly afterward resulting in what is known as ‘IV Crush’.

IV Crush is, as the name would suggest, when the implied volatility of a stock drops significantly, usually because the uncertainty has passed. The abrupt reversal in implied volatility is often accompanied by realized volatility, but not always.

The discrepancy between implied and realized volatility allows for some unique trading strategies like straddles and strangles which seek to capitalize on absolute volatility of option contracts or short straddles and strangles which aim to capitalize on IV crush.

Straddles

Straddles involve buying both the call (buy) and the put (sell) option simultaneously with the same strike price (the fixed price at which the holder of an option can buy or sell), and the same expiration date. When applied to earnings, traders might straddle before the release and can profit from either a rise or fall in the stock’s price, as long as the stock’s price deviates from the strike price by an amount more than the total cost of the premium. This could potentially make a straddle a viable choice if traders think absolute volatility will be high but aren’t sure of the direction the move will take.

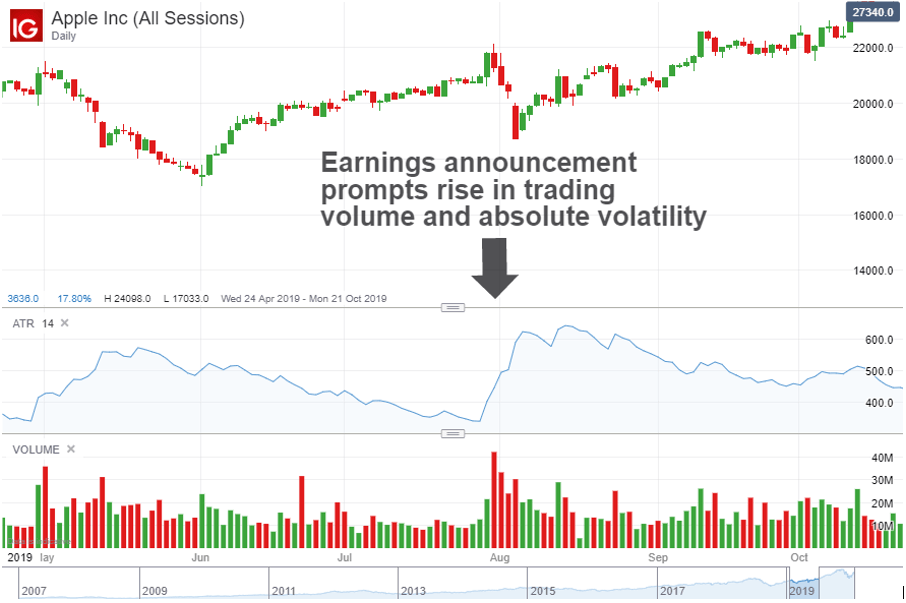
The chart below shows Apple’s August 2019 earnings release prompt more trading and higher absolute volatility, as shown by the Volume and Average True Range indicators respectively, representing an example of a potentially favorable outcome for a straddle.

Chart to show absolute volatility and trading volume spike during earnings

A short straddle involves selling both the call and put options with the same strike price and expiration date. This move is often suited to ‘IV crush’ instances when the trader believes the price will not move too much over the course of the options contract.

Strangles

Strangles are similar to straddles, and can likewise have a long and short route. But while straddles have the same strike price for the call and put options, strangles have different strike prices. Strangles may potentially be a viable choice if the trader believes a stock has more chance of moving in one direction than the other following an earnings report, but still seeks protection if the position takes a contrary swing.

Trading the London Session: Guide for Forex Traders

Trading the London Session: Guide for Forex Traders

Top 3 things to know about the London trading session

1. The London session is fast and active

The slower Tokyo market will lead into the London session, and as prices begin to move from liquidity providers based in the United Kingdom, traders can usually see increases in volatility.

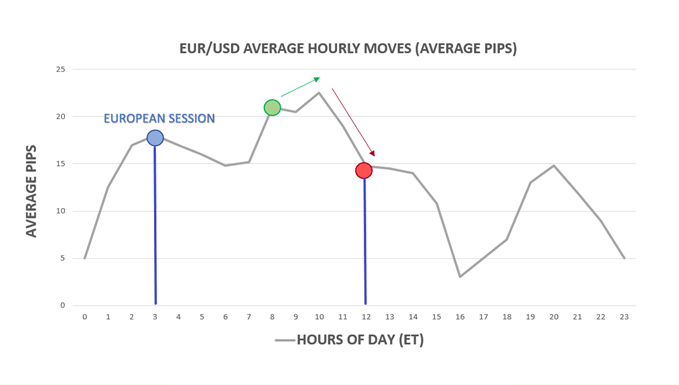
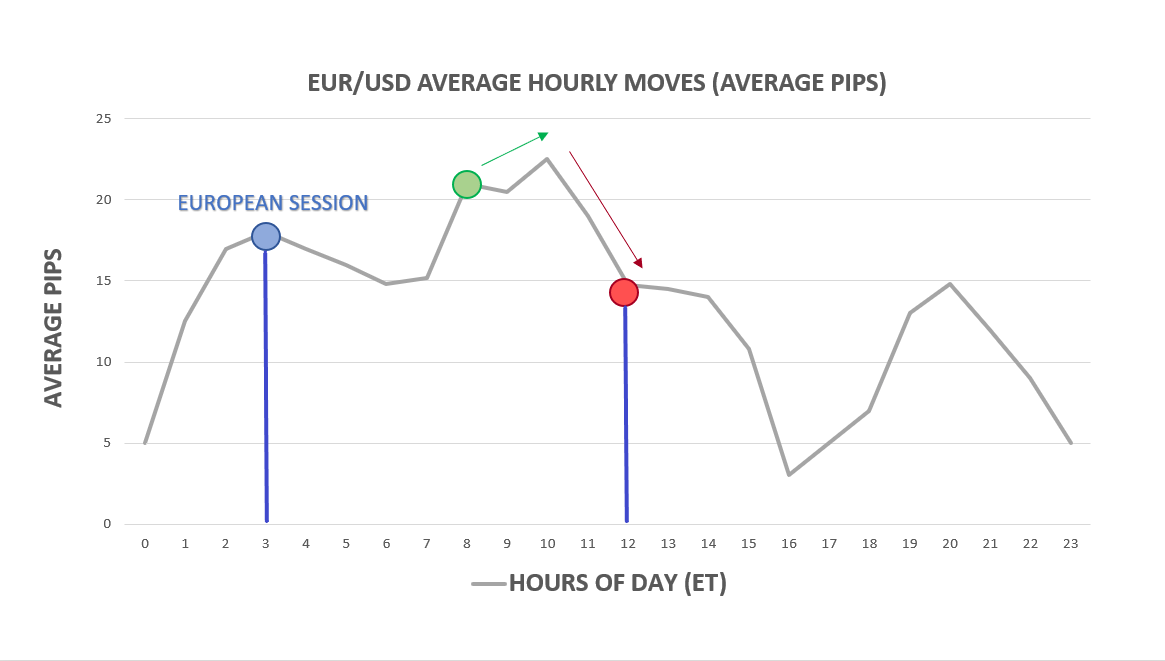
As prices begin to come in from London, the ‘average hourly move’ on many of the major currency pairs will often increase. Below is analysis on EUR/USD based on the time of day. Notice how much greater these moves are, on average, after the Asian session closes (Asia session closes at 3AM ET-blue dot):

Average hourly moves by hour of day in EUR/USD

Support and resistance may be broken much more easily than it would during the Asian session (when volatility is usually lower).

These concepts are central to the trader’s approach when speculating in the London Session, as traders can look to use this volatility to their advantage by trading breakouts. When trading breakouts, traders are looking for volatile moves that may continue for an extended period of time.

2. Look out for the overlap

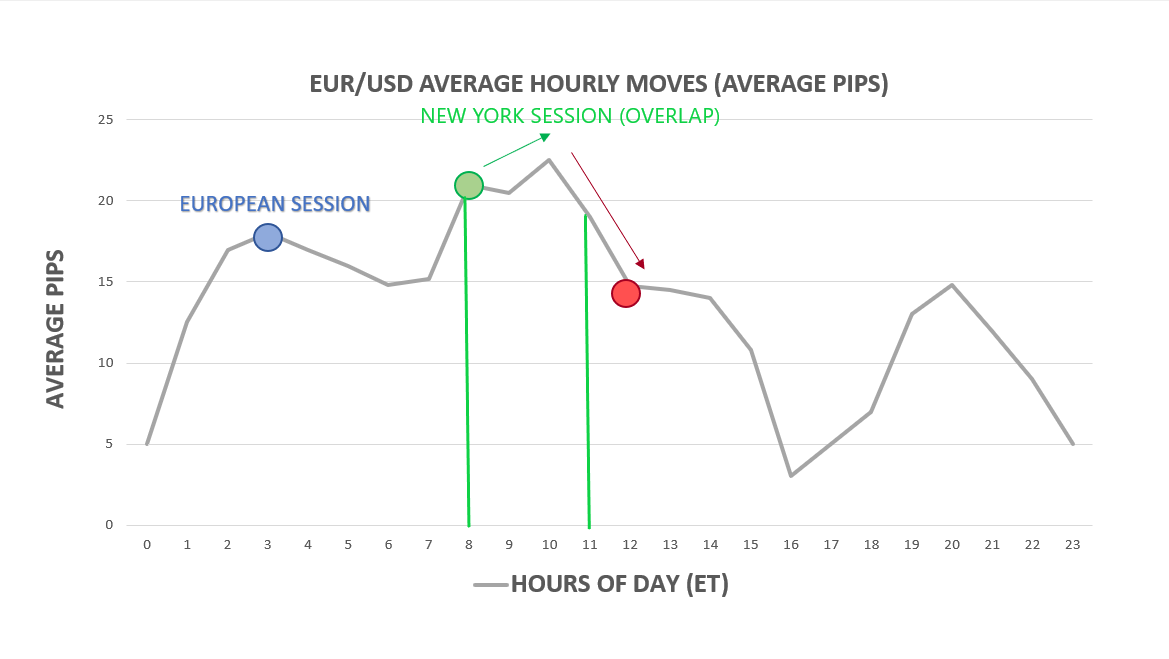
The ‘overlap’ is when the London and US sessions literally overlap each other (8AM ET to 12PM ET). These are the two largest market centers in the world, and during this four-hour period large and fast moves can be seen during the overlap as a large amount of liquidity enters the market.

When to trade the London-New York forex session overlap

As seen in the image above, the volatility increases to a maximum from 8:00 AM to 12:00 PM ET – when the London forex session overlaps with the New York forex session. To trade the overlap, traders can use a break-out strategy which takes advantage of the increased volatility seen during the overlap.

3. High liquidity

The London forex session is one of the most liquid trading sessions. Due to the high volume of buying and selling, major currency pairs can trade at extremely low spreads. Day traders looking to target short moves may be interested in finding trends and breakouts to trade so as to reduce the cost they pay in spread s.

What currency pairs are the best to trade during the London session?

There are no ‘best’ currency pairs to trade during London forex market hours, but there are currency pairs that will reduce in spread due to the high volume and allow traders cheaper spread costs.

These currencies include the major currency pairs like EUR/USD, USD/JPY, GBP/USD, and USD/CHF. The major currency pairs trade in extremely high volumes during the London forex session.

Currency pairs that are most affected by the overlap include the EUR/USD, USD/JPY, GBP/USD due to the inter-bank activities between the United States and Europe/London. If your trading strategy is better suited for volatility, then these are the trading pairs to watch because they will be flooded with liquidity and will move more on average during the overlap.

How to trade breakouts during the London Session

Trading breakouts during the London session using a London breakout strategy is much the same as trading breakouts during any other time of day, with the addition of the fact that traders may expect an onslaught of liquidity and volatility at the open.

When traders look to trade breakouts, they are often seeking firm support or resistance to plot their trades.

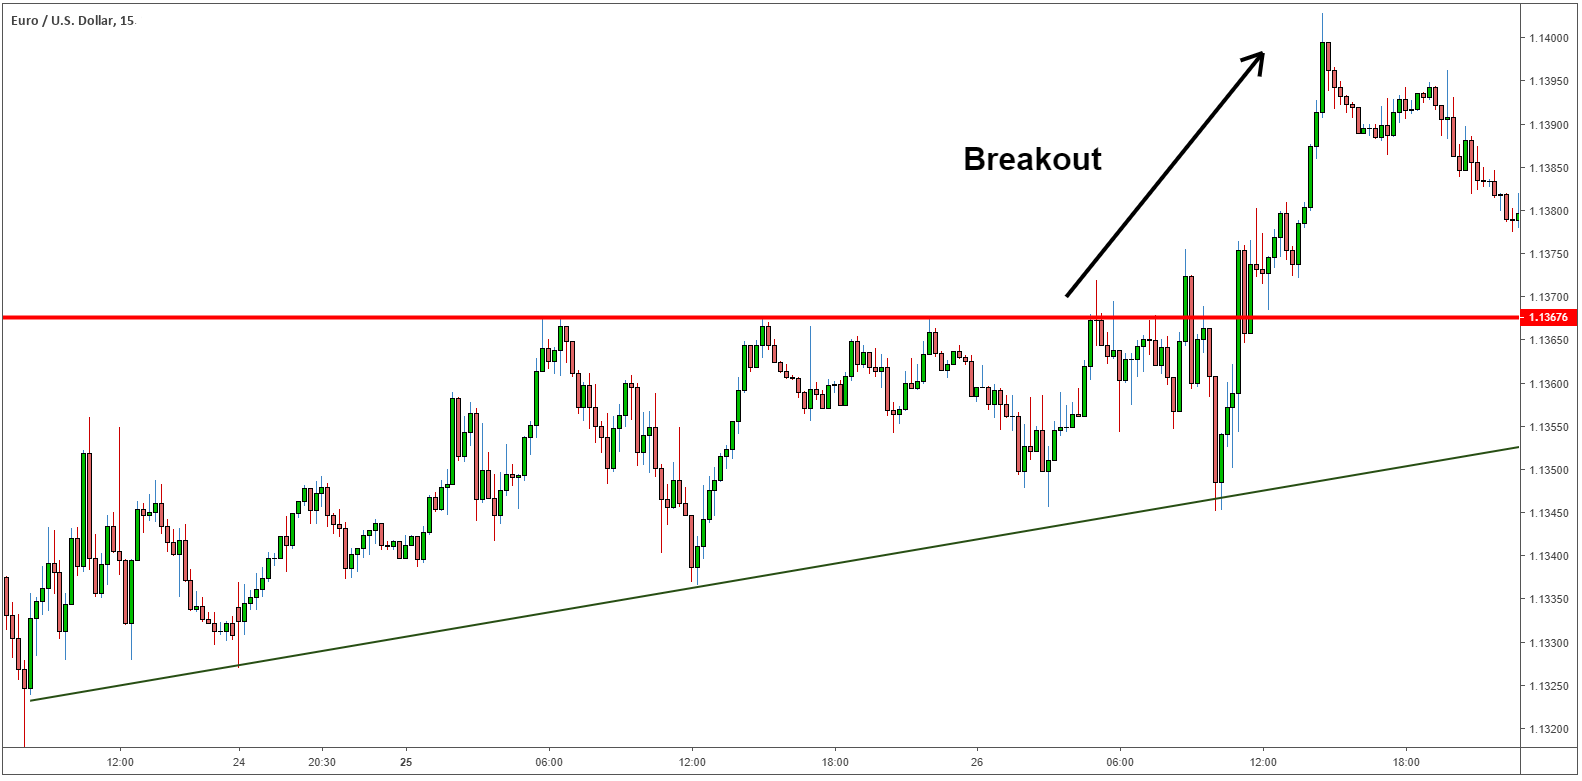
The chart below illustrates a rising wedge pattern, a trend line with a resistance level that is eventually broken- a breakout.

Rising wedge EUR/USD leading into a breakout during London session

The big benefit of this setup is risk management. Traders can keep stops relatively tight, with their stop-losses trailing close to the trend line. If the support/trend line does break, losses are limited, and if the strategy does prevail it could lead to a positive risk-reward ratio.

The increase in liquidity during the London session coupled with the increase in volatility makes potential breakouts much more likely.

London session trading strategies and tips

Remember, when trading the London open volatility and liquidity rises, so be wary and utilize the appropriate leverage when trading. If you’re new to forex trading, download our Forex for beginners trading guide to get to grips with the basics.

Like the London forex trading session, the New York session and Asian forex session also have unique characteristics that forex traders should be aware of.

Key tips:

  • Liquidity and volatility increase during the London session.
  • Breakouts could occur more frequently during the London session.
  • Remember to watch for the overlap between the London session and the New York session for increased volatility and liquidity.
3 Triangle Patterns Every Forex Trader Should Know

3 Triangle Patterns Every Forex Trader Should Know

What is a triangle pattern?

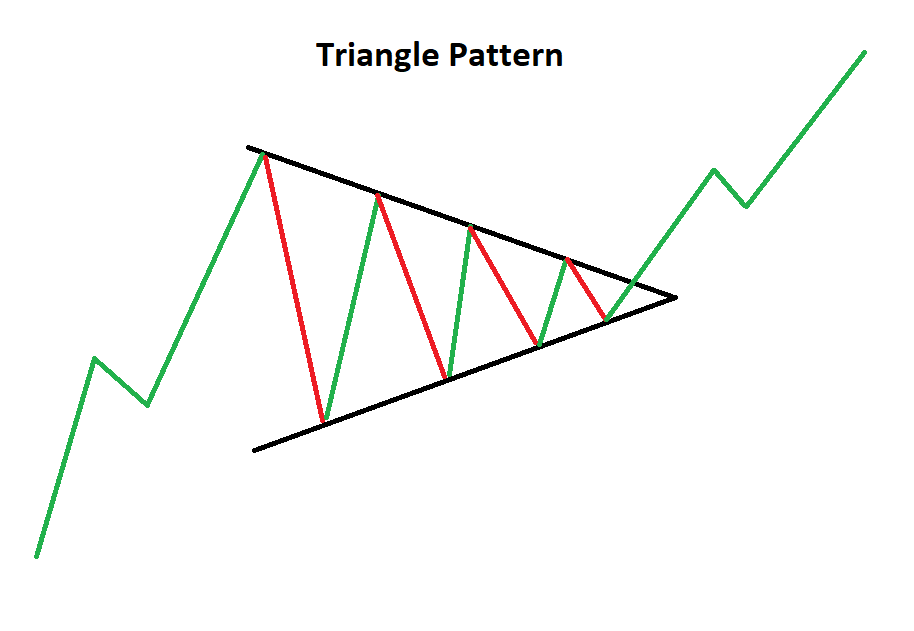
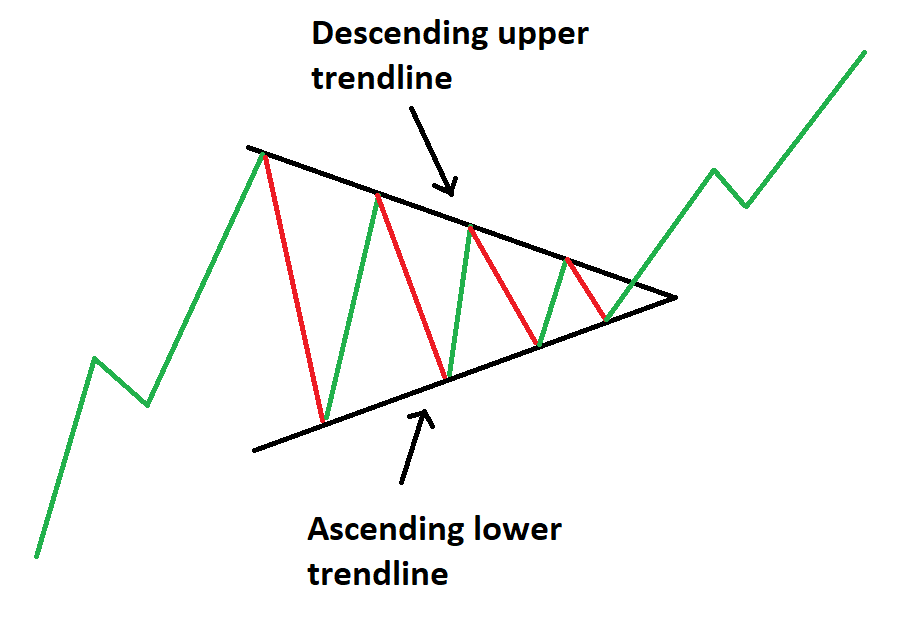
A forex triangle pattern is a consolidation pattern that occurs mid-trend and usually signals a continuation of the existing trend. The triangle chart pattern is formed by drawing two converging trendlines as price temporarily moves in a sideways direction. Traders often look for a subsequent breakout, in the direction of the preceding trend, as a signal to enter a trade.

Triangle chart pattern

This article makes use of line chart illustrations to present the three triangle chart patterns. Traders ought to familiarize themselves with the three technical analysis charts and figure out which one suits them best, although, most prefer using forex candlestick charts.

Symmetrical Triangles

The symmetrical triangle can be viewed as the starting point for all variations of the triangle pattern. As the name suggests, a triangle can be seen after drawing two converging trendlines on a chart.

The difference between the symmetrical and the other triangle patterns is that the symmetrical triangle is a neutral pattern and does not lean in any direction. While the triangle itself is neutral, it still favors the direction of the existing trend and traders look for breakouts in the direction of the trend.

Symmetrical triangle chart pattern

Symmetrical triangle trading strategy

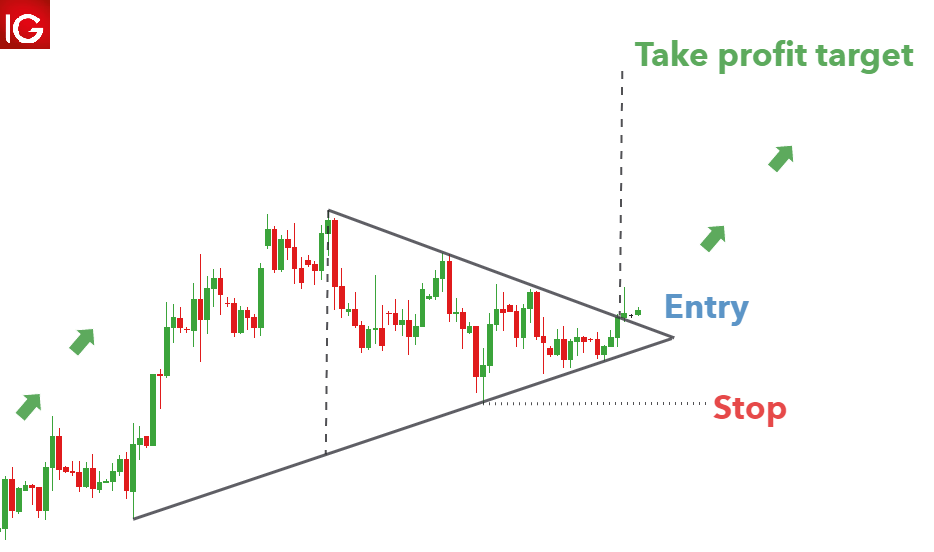
Triangles provide an effective measuring technique for trading the breakout, and this technique can be adapted and applied to the other variations as well.

The AUD/USD chart below shows the symmetrical triangle. The vertical distance between the upper and lower trendline can be measured and used to forecast the appropriate target once price has broken out of the symmetrical triangle.

Its important to note that finding the perfect symmetrical triangle is extremely rare and that traders should not be too hasty to invalidate imperfect patterns. Traders ought to understand that triangle analysis is less about finding the perfect pattern and more about understanding what the market is communicating, through price action.

Symmentrical triangle pattern on forex pair AUD/USD

Ascending Triangle Pattern

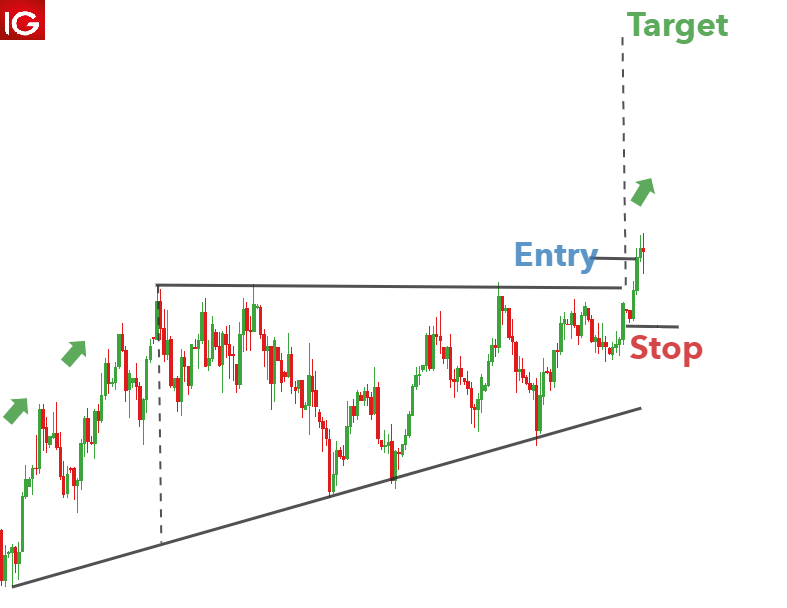
The ascending triangle pattern is similar to the symmetrical triangle except that the upper trendline is flat and the lower trendline is rising. This pattern indicates that buyers are more aggressive than sellers as price continues to make higher lows. Price approaches the flat upper trendline and with more instances of this, the more likely it is to eventually break through to the upside.

Ascending triangle chart pattern

Ascending triangle trading strategy

An ascending triangle can be seen in the US Dollar Index below. Leading on from the existing uptrend, there is a period of consolidation that forms the ascending triangle. Traders can once again measure the vertical distance at the beginning of the triangle formation and use it at the breakout to forecast the take profit level. In this example, a rather tight stop can be placed at the recent swing low to mitigate downside risk.

Ascending triangle US dollar basket

Descending Triangle Pattern

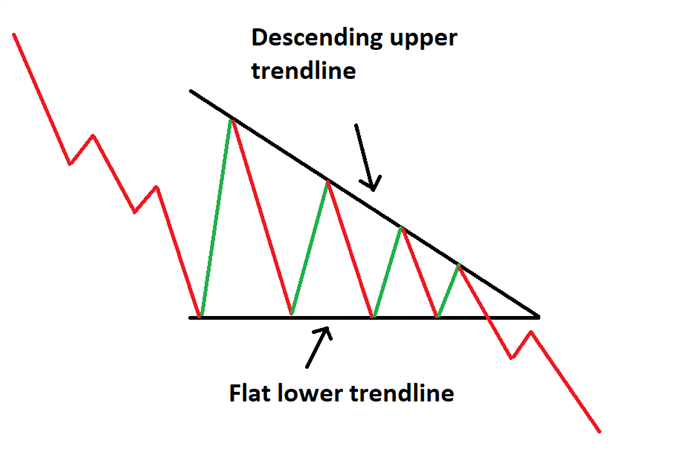
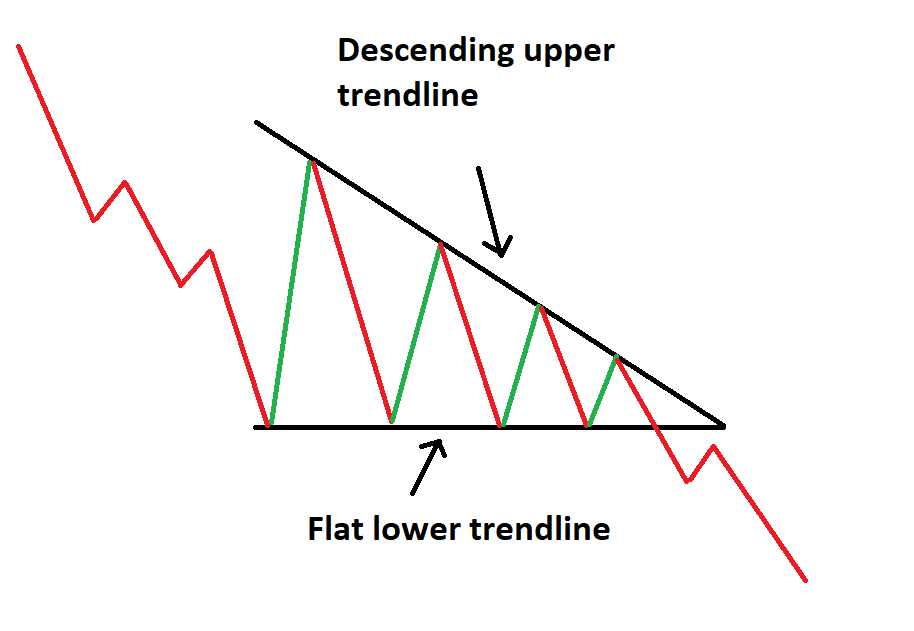
The descending triangle pattern on the other hand, is characterized by a descending upper trendline and a flat lower trendline. This pattern indicates that sellers are more aggressive than buyers as price continues to make lower highs.

Decending triangle chart pattern

Descending triangle trading strategy

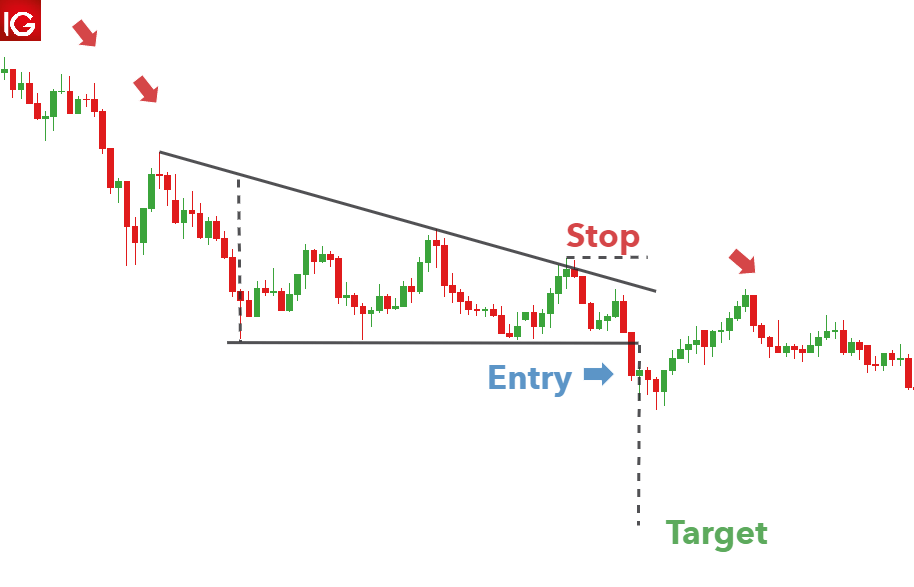
Below is a good example of the descending triangle pattern appearing on GBP/USD. A downtrend leads into the consolidation period where sellers outweigh buyers and slowly push price lower. A strong break of the lower trendline presents traders with an opportunity to go short. In this example, it doesn’t take long for the position to move in the opposite direction, highlighting the importance of setting an appropriate stop level.

The take profit level is set using the vertical distance measured at the beginning of the descending triangle formation.

Descending triangle pattern on GBP/USD

Crude Oil Trading Strategies and Tips

Crude Oil Trading Strategies and Tips

WHY TRADE CRUDE OIL AND HOW DOES CRUDE OIL TRADING WORK?

Crude oil is the world economy’s primary energy source, making it a very popular commodity to trade. A naturally occurring fossil fuel, it can be refined into various products like gasoline (petrol), diesel, lubricants, wax and other petrochemicals. It is highly demanded, traded in volume, and extremely liquid. Oil trading therefore involves tight spreads, frequent chart patterns, and high volatility.

Brent crude is the world’s benchmark for oil with almost two thirds of oil contracts traded being Brent oil. WTI is America’s benchmark oil, it is a slightly sweeter and lighter oil compared to Brent.

CRUDE OIL TRADING HOURS

WTI trades on CME Globex:

Sunday – Friday, 6:00 p.m. – 5:00 p.m. (with an hour break from 5:00 p.m. to 6:00 p.m. each day)

Brent trades on ICE:

Sunday – Friday – 7:00 p.m. – 5:00 p.m.

CRUDE OIL TRADING BASICS: UNDERSTANDING WHAT AFFECTS PRICE MOVEMENTS

When trading oil, the two major focal points are, as with many commodities, supply and demand. Whether there was an economic report like a news event or press release or tensions in the Middle East, the two factors that will be taken into consideration is how supply and demand is affected, because this will affect the price.

Supply Factors

  • Outages or maintenance in key refineries around the globe, whether it’s the Forties pipeline in the North Sea or the Port Arthur refinery in Texas, must be monitored because of the effect it can have on the supply of oil. War in the Middle East leads to concerns about supply. For example, when the Libyan Civil war began in 2011, prices had seen a 25% rise from in the space of a couple of months.
  • OPEC (Organization of the Petroleum Exporting Countries) production cuts or extensions lead to changes in the price of oil. For example, back in 2016 when the cartel had announced their decision to curb global supply by 1.9% (see chart below), the price of oil has risen from $44/bbl to as much as $80/bbl.

WTI and Brent Crude price reaction to OPEC supply cut:

WTI and Brent Crude price reaction to OPEC supply cut

  • Oil Suppliers: Similarly, with understanding the importance of OPEC, it is also worth knowing who the top global oil suppliers are, and this information can be fond from the EIA website.

Demand Factors

  • Seasonality: Hot summers can lead to increased activity and higher oil consumption. Cold winters cause people to consume more oil products to heat their houses.
  • Oil Consumers: The largest consumers of oil have typically been developed nations such as the U.S. and European countries. However, in recent times there has been a surge in oil consumption in Asian countries, namely China and Japan. As such, it is important for traders to pay attention to the level of demand from these nations, alongside their economic performance. Any slowdown could affect oil prices and demand may fall.
  • Correlation to Global Growth: The chart below shows the largely positive correlation between the price of crude oil and global growth. The Chinese and US economies being the two largest in the world are a great barometer for global growth. The chart includes their respective major stock indices which move in line with crude oil prices – when the equity indices fall, the price of crude oil tends to fall and vice versa.

WTI and Brent Crude positive correlation with FTSE China A50 and S&P 500 chart representation:

WTI and Brent Crude positive correlation with FTSE China A50 and S&P 500

  • Alternative Energy: While fossil fuels such as oil and gas continue to dominate cleaner energy sources, there is an incessant push towards sustainability on a global scale. This will definitely impact crude oil prices going forward which makes this a key factor to monitor in a crude oil trading strategy.

The impact of derivatives on the traditional valuations of crude oil have been thought by many to have destabilized the asset class. Simply put, the oil futures are thought to have reflected higher proportions of noise which do not reflect the fundamental data at the time. This is contentious within the investing community with some in disagreement with the above rationale, but it cannot be ignored that large speculative traders are becoming more influential with the flourishing derivative market.

Want to know more about oil? Here are 8 Surprising Crude Oil Facts Every Trader Should Know !

HOW TO TRADE OIL: TOP TIPS AND STRATEGIES

Expert oil traders generally follow a strategy. They will understand the fundamental factors that affect the price of oil and use a trading strategy that suits their trading style. Each trading strategy is different, risk management is an important component to consistent trading, like the effective use of leverage and avoiding top trading mistakes.

A comprehensive crude oil trading strategy could include:

  1. Fundamental Analysis
  2. Technical Analysis
  3. Risk Management

Once a trader understands the fundamental supply and demand factors that affect the price of oil, he/she can look for entries into the market using technical analysis. Then, when a buy or sell signal has been identified using technical analysis, the trader can implement the proper risk management techniques. Let’s go through an example using the steps outlined above:

  1. Fundamental Analysis

On the 30th of November 2017, OPEC and Russia agreed to extend an oil production cut, which lead to a decrease in supply. The basic theory of supply and demand suggests that a decrease in supply should be succeeded by an increase in demand and consequently price. This is the fundamental analysis a trader would need to incorporate into their strategy in order to identify potential buy signals in the market.

WTI daily chart highlighting supply cut:

WTI daily chart highlighting supply cut

2. Technical Analysis

The next step would be to analyze the chart using technical analysis. There are a variety of technical indicators and price patterns a trader can use to look for signals to enter the market. There is no need to use many technical indicators, one that you understand well will do the job. A common yet very effective way to begin analyzing any chart is to identify the overall trend of the market. In this example, the implementation of simple price action is used to identify higher highs and higher lows which is suggestive of a preceding upward trend. This falls in line with our fundamental expectation of further upward price movement.

WTI daily chart showing preceding upward trend:

WTI daily chart showing preceding upward trend

Once the bullish trend has been confirmed, the next step in the trading strategy would be to recognize possible entry points. Again, there are multiple tools and techniques to locate entry points but this example uses the Commodity Channel Index (CCI) indicator which moves into oversold terrirtoy shortly after the fundamental supply cut announcement was made. An oversold signal on the CCI advocates further price appreciation and the possibility of a long (buy) entry.

WTI daily chart with CCI indicator:

WTI daily chart with CCI Indicator

3. Risk Management

The final step in any trading strategy would be to employ sound risk management to every trade. At DailyFX we support the 1:2 risk-reward ratio guideline which basically means that the target level should be roughly two times more than the position stop-loss level. To manage risk, the trader could look to set a take-profit above the recent high and set a stop-loss at the recent low.

In this example, a recent swing low ($49.30) has been identified as stop level which is approximately $8 away from the entry price ($57.20). There is no recent high which in this case which would allow for a target projection using basic maths. With the stop distance being roughly $8 away from entry, a 1:2 projection could seee initial resistance at the $73 level.

WTI daily chart with 1:2 risk-reward ratio:

WTI daily chart with 1:2 risk-reward ratio

This sample trade would illustrate a positive risk to reward ratio. We researched millions of live trades in a variety of markets and discovered a positive risk to reward ratio was a key element to consistent trading. Additionally, at DailyFX, we recommend risking less than 5% of capital on all open trades.

UK Inflation Proves Too Hot to Handle in April, Unravelling Rate Cut Bets

UK Inflation Proves Too Hot to Handle in April, Unravelling Rate Cut Bets

Inflation Proves Too Hot to Handle in April, Unravelling Rate Cut Bets

The April print was identified as a potential hurdle for the Bank of England (BoE) after last year’s print marked the start of a reacceleration in inflation pressures that forced another rate hike from the BoE.

It was hoped that lower headline inflation leading up to the April 2024 print would have a cooling effect on services inflation. That proved not to be the case. Monthly and yearly inflation measures for the services sector surpassed not just the average estimate but also the maximum estimate within the projection data.

Headline CPI printed above expectations but has made significant headway within the overall disinflationary process. Core CPI (YoY) also moved lower but not by as much as the headline measure, from 4.2% to 3.9% (est. 3.6%)

Discover how to prepare for high impact economic data and events via an easy-to-implement approach:

The incoming data has some meaningful ramifications for rate cut bets and the pound. Yesterday afternoon, the market expected a little over 50% chance that June would be appropriate for the first rate cut by the BoE. Now, that has dwindled to a lowly 14% and has shifted expectations of a rate cut from August to November. Additionally, expectations of two rate cuts this year have retreated to just one with the potential for a second.

Rate Cut Expectations (in Basis Points, ‘Bps’)

image2.png

GBP/USD Strengthened after Hot CPI Print

GBP/USD naturally witnessed a move higher on the release of the hot CPI data, trading above the 1.2736 prior swing high (November 2023) but pulling back beneath it as the dust settles.

GBP/USD 5-Minute Chart

image3.png

GBP/USD revealed hints of bullish fatigue in the lead up to the data print as the daily candle wicks became more pronounced ahead of the 1.2736 level and daily trading ranges contracted. However, the data surprise provided a bullish catalyst, sending the pair higher.

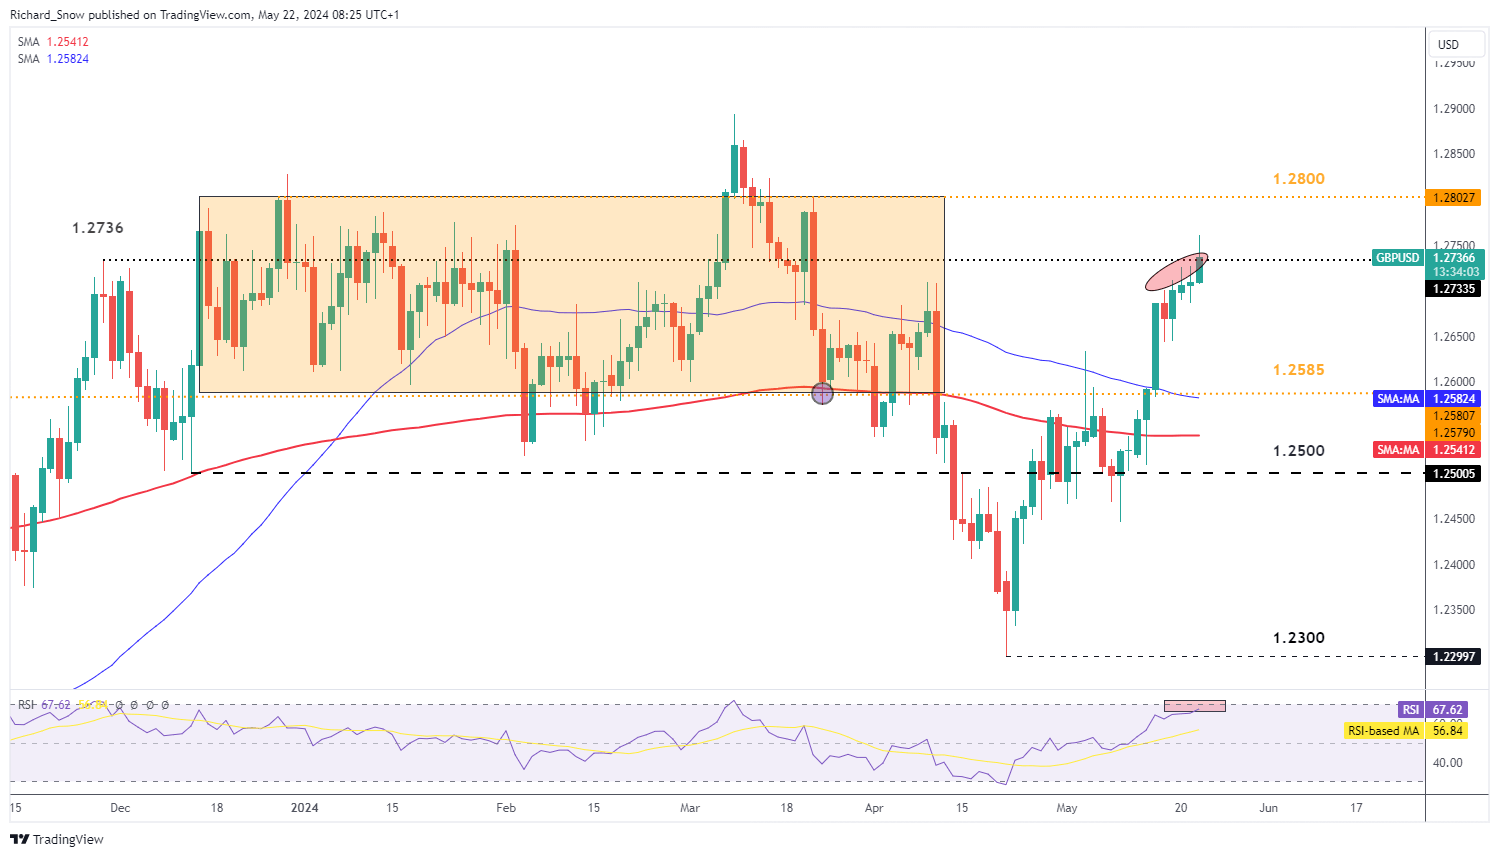
1.2800 becomes the next level of resistance with 1.2585 the next level of support – around the 50-day simple moving average (SMA). The pair now treads dangerously close to overbought territory on the RSI meaning resultant momentum will need to be closely monitored for the risk of a pullback.

GBP/USD Daily Chart

image4.png

EUR/GBP Remains One to Watch Ahead of the June ECB Meeting

The hot UK CPI data propelled the pair lower, with trendline support proving not to be an issue. EUR/GBP closed yesterday marginally below the trendline acting as support, but has broken through it with ease today thus far. The most imminent level of support becomes 0.8515 – the level that propped up the pair in July and August of 2023 and for most parts of 2024 too. The prior trendline support turns into trendline resistance, in the event of an immediate pullback.

EUR/GBP Daily Chart
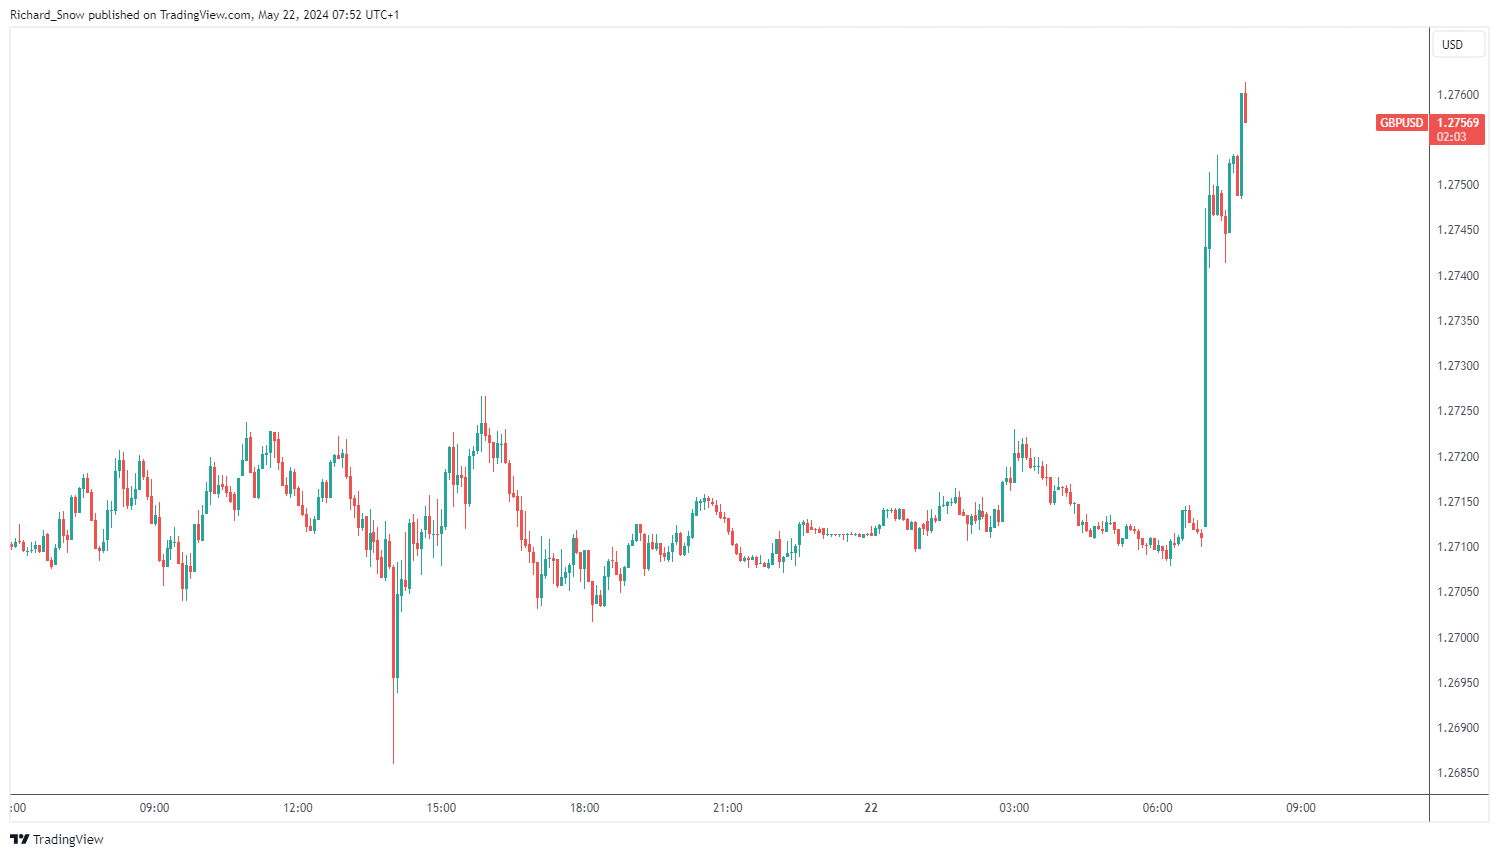
image5.png

Japanese Yen Rises On Inflation-Focused Dollar Despite Feeble Japanese GDP Print

Japanese Yen Rises On Inflation-Focused Dollar Despite Feeble Japanese GDP Print

The Japanese Yen made sharp gains on the United States Dollar in Asia on Thursday but has already returned some of them as investors digest fascinating economic numbers from both sides of the USD/JPY pair.

Wednesday’s official snapshot of April US consumer price inflation showed it relaxing to 3.4%. This was as expected. But, after the shock strength in factory gate prices revealed earlier this week, there was clearly some relief that hopes for continued deceleration, and lower interest rates, were alive. These data knocked the Dollar across the board, cutting Treasury yields and boosting stocks.

However, on Thursday came news that Japan’s economy remains stuck in the doldrums. First quarter Gross Domestic Product fell by an annualized 2%. That was much worse than the 1.5% expected. It was also bad news for the monetary authorities in Tokyo who’d dearly like to move away from the ultra-low interest rates that have characterized Japan for decades.

They won’t have liked evidence of weak personal consumption in the GDP figures either. Of course this is only one set of data. But it’s a massive set. And it hardly shows an economy crying out for monetary tightening.

Still, for now the ‘weak Dollar’ story seems to be winning out, with USD/JPY having fallen by nearly three full yen at times in the past two days. But pending more data the jury must be seen as out on higher Japanese interest rates. This is likely to leave the Yen vulnerable to the better returns available across developed market currencies.

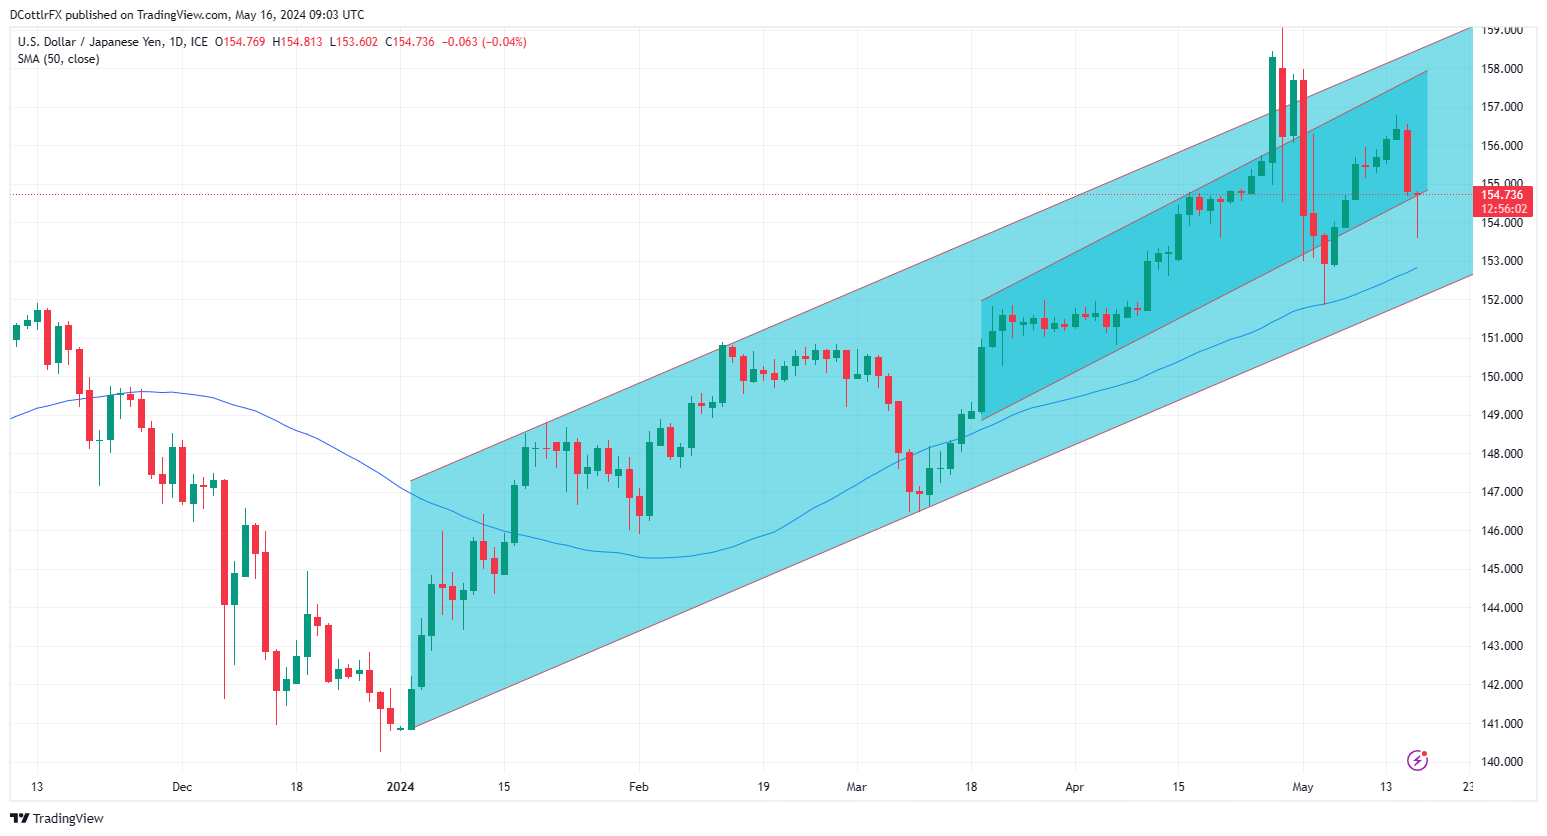
USD/JPY Technical Analysis

A graph of a stock market  Description automatically generated

USD/JPY Daily Chart Compiled Using TradingView
The Dollar was recovering quite rapidly from the bout of intervention-selling by the Japanese authorities which knocked it back so sharply earlier this month.

However, the latest fundamental data have seen it slide once again, although the uptrend channel from March 19 still appears to offer some support. That comes in now at 154.630, which at the time of writing (0910 GMT on Thursday) is just about where the market it.

Breaks below that are likely to be held at the 50-day moving average, which is where the market bounced on its last big foray lower. That now offers support at 152.60, with further channel support below that at 152.086.

Bulls will need to retake and hold the 156.00 region to force near-term progress. Right now t this looks like a big ask but, if they can defend the current uptrend, they might be able to get there. Of course, the market will remain wary of further intervention.

Retail traders seem quite sure that USD/JPY is headed lower, with 70% bearish according to IG data.

Discover the power of crowd mentality. Download our free sentiment guide to decipher how shifts in USD/JPY’s positioning can act as key indicators for upcoming price movements:

Gold Price Outlook: XAU/USD Prices Rise on Renewed Rate Cut Hopes

Gold Price Outlook: XAU/USD Prices Rise on Renewed Rate Cut Hopes

CPI, the Dollar, and US Yields Drive Gold Prices Higher

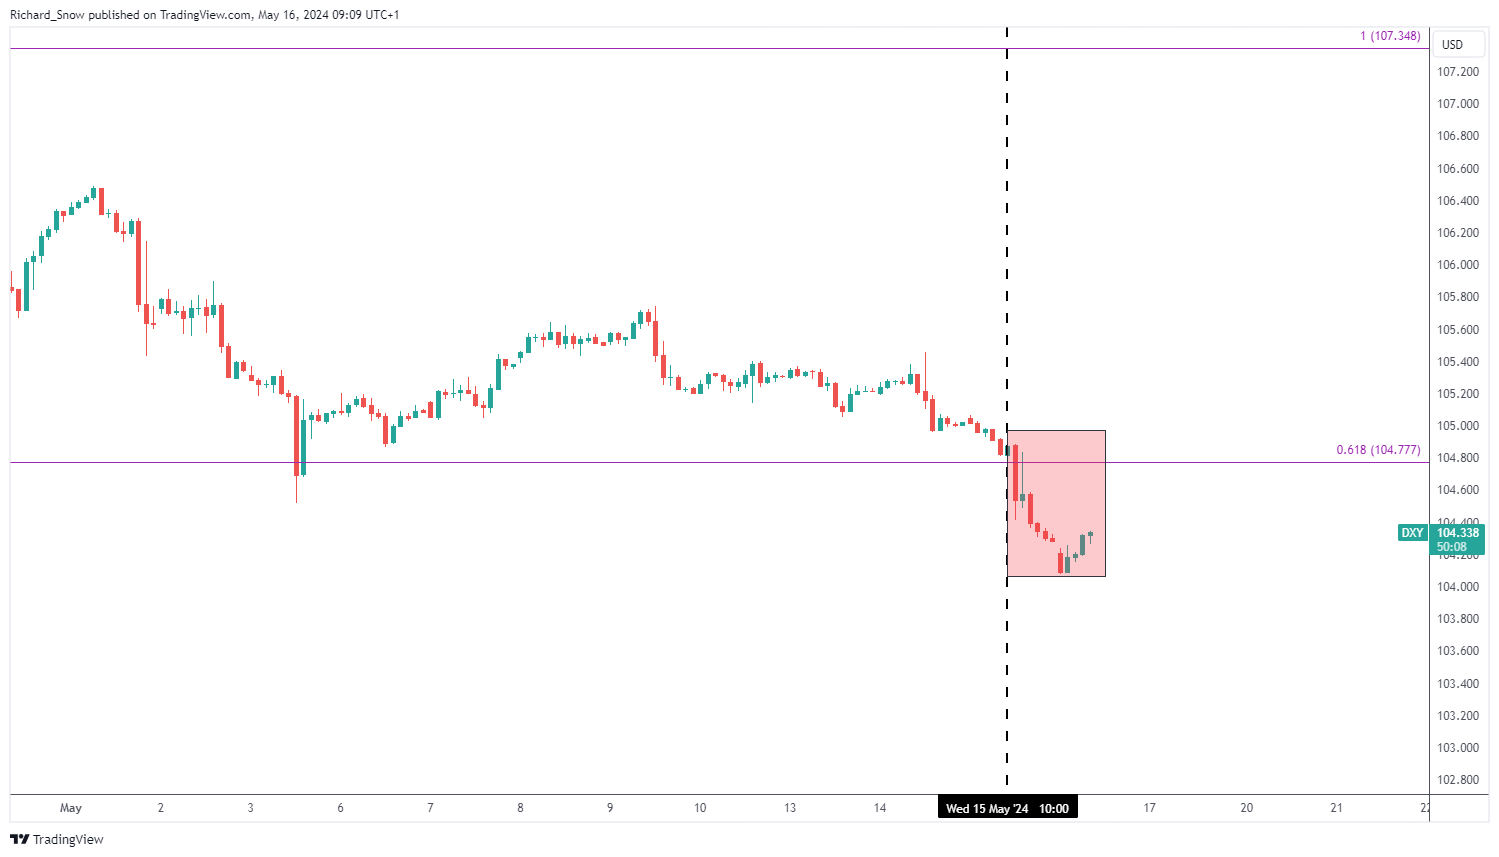
US CPI always has the power to propel markets given the amount of media attention and recent struggles as price pressures have accelerated over the past two months. It was, therefore, a relief to many when monthly CPI dropped form a prior 0.4% to 0.3% and both headline and core measures printed lower (but in line with estimates) too.

The dollar – measured by the US dollar basket (DXY) – immediately sold off, allowing gold to rise in the aftermath. The precious metal is viewed more favourably when interest rates are expected to come down as it means the opportunity cost of holding the non-interest bearing asset is lowered. US Treasury yields were seen sharply lower, adding to the positive catalyst for gold

US Dollar Basket (DXY) 2-Hour Chart

image1.png

Gold Breakout Attempt – Bullish Continuation Plays in Focus

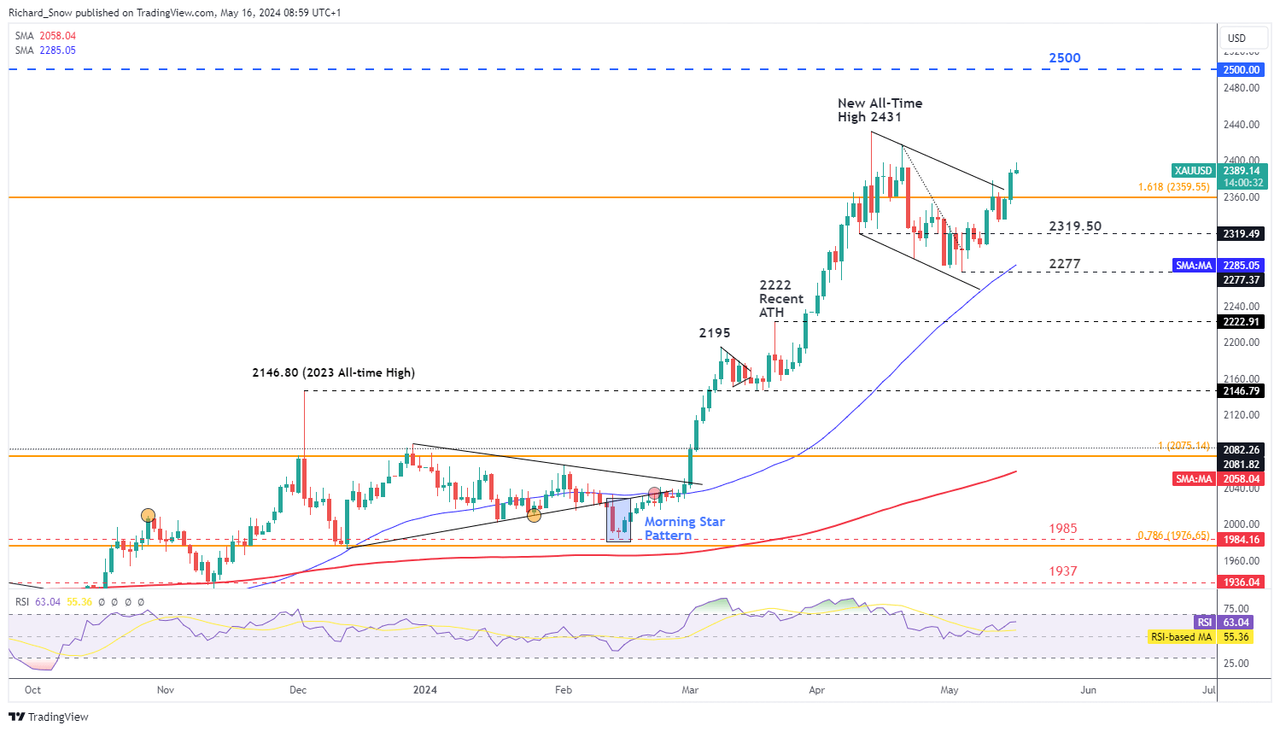
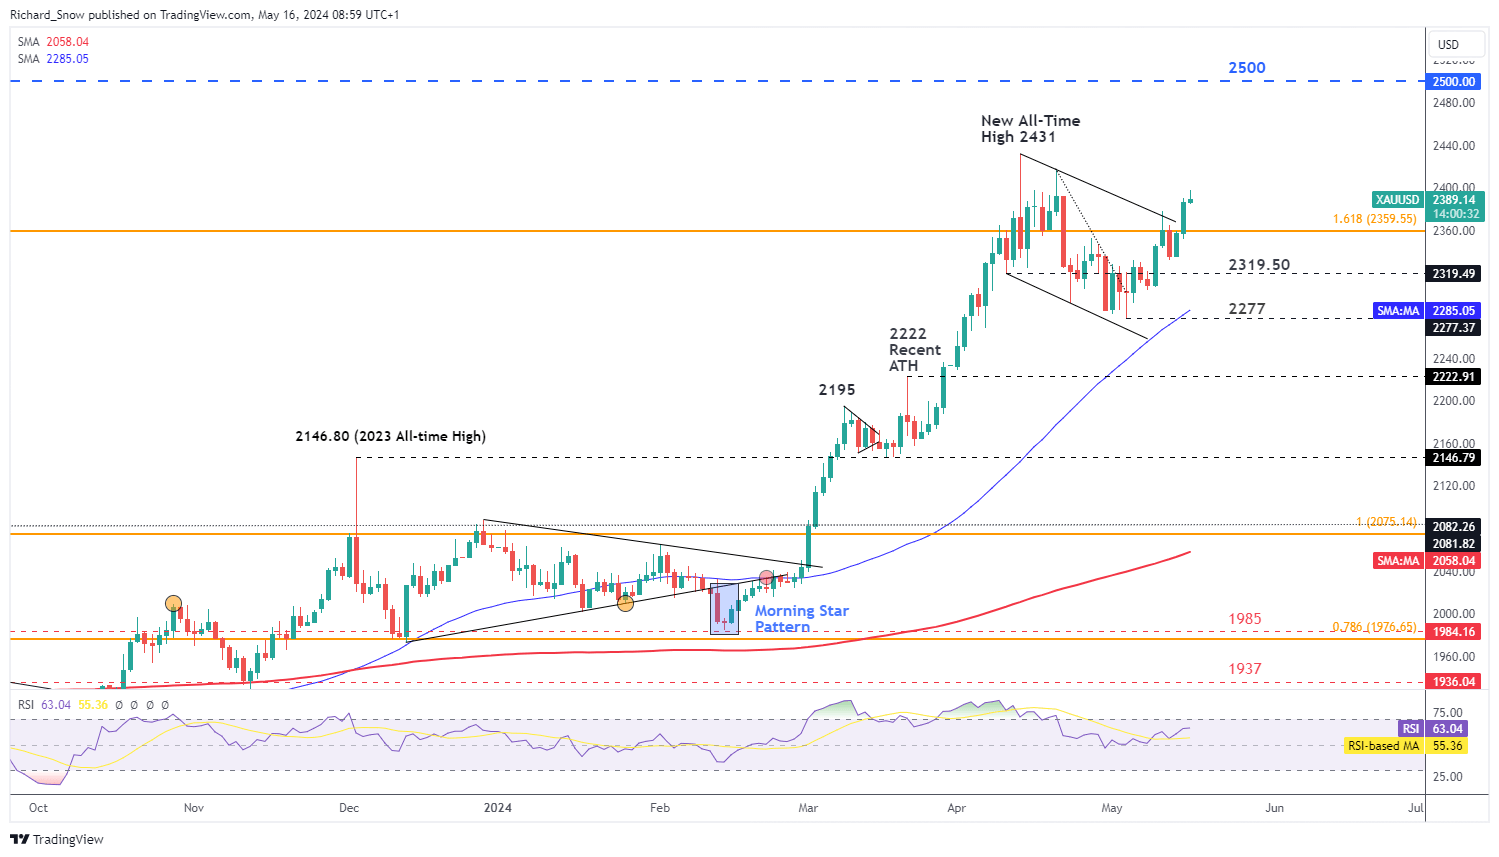
Gold prices appear likely to test the all-time high should the current bullish impetus evolve into a more sustained push higher. Gold received a boost from softer CPI data and a more dovish adjustment in interest rate expectations as the market prices in two full rate cuts by year end.

The precious metal had broadly been seen easing – trading within a bearish channel – until CPI proved the catalyst for potential bullish continuation. Yesterday’s daily candle managed to close above trendline resistance (upper bound of the channel) in a move that signals a reinvigoration of the longer-term bull trend.

Key observations from here include a potential retest of the prior resistance, now support, as this is so often the case with breakouts. Such an approach also provides a prudent way to handle breakouts while avoiding a false breakout which can trap unsuspecting traders. Look for the $2360 mark to hold (the 1.618% Fibonacci extension of the 2020 – 2022 major decline). This represents a level of confluence resistance as it coincides roughly with the prior resistance trendline.

Gold (XAU/USD) Daily Chart
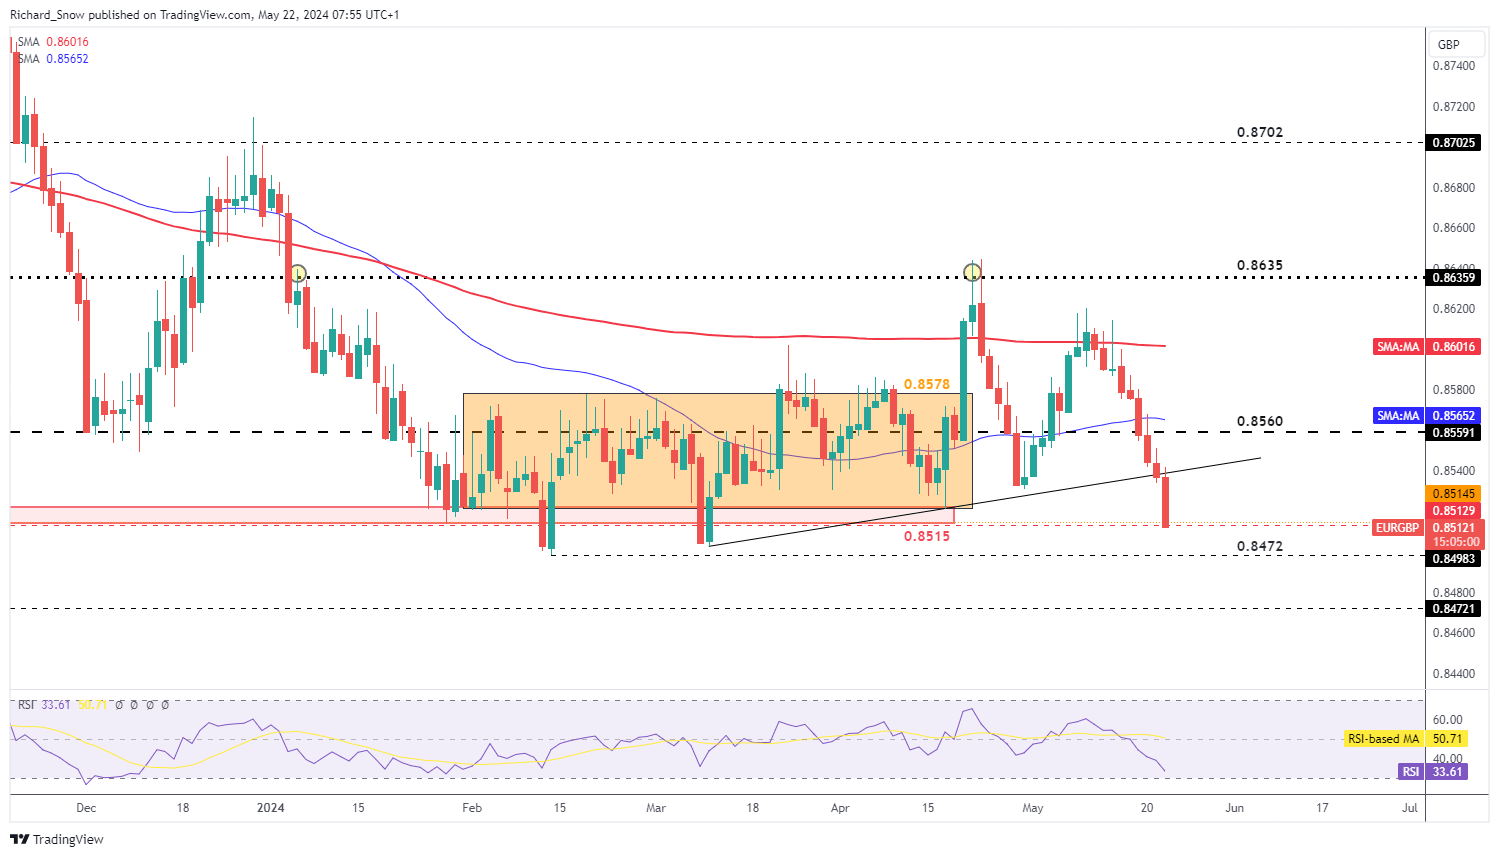
image2.png

Understand how to setup for impactful events or data releases with this easy-to-implement approach:

Gold Volatility Lifts but More is Required for an Extended Move in the Metal

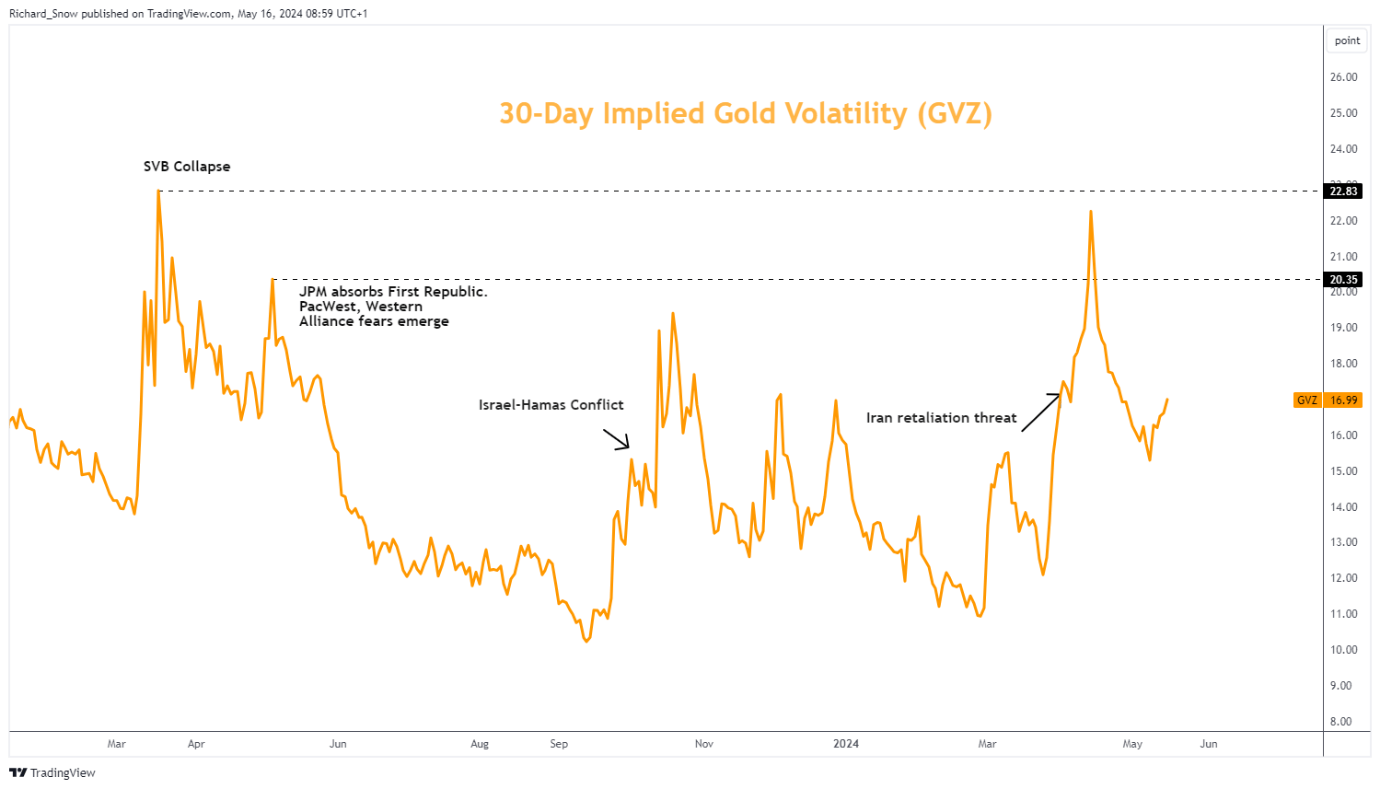
Gold prices tend to rise in volatile environments more often than not and can be influenced by nervousness or a general risk off environment. Therefore, the mere prospect of lower interest rates, while supportive of higher prices, can prove insufficient to produce a long-lasting push higher.

Of course any material weakness in the US economy or jobs market may lead to more aggressive rate cut expectations but as things stand now, longer-lasting bullish momentum remains to be seen.

Gold Volatility Index (GVZ)

image3.png


Explaining the Stochastic Oscillator

Explaining the Stochastic Oscillator

What is a Stochastic Oscillator?

A stochastic oscillator is a momentum indicator that calculates whether the price of a security is overbought or oversold when compared to price movement over a specified period. The oscillator essentially weighs up the most recent price level as a percentage of the range (highest high – lowest low) over a defined period of time.

Stochastic Oscillator

How does a Stochastic Oscillator Work?

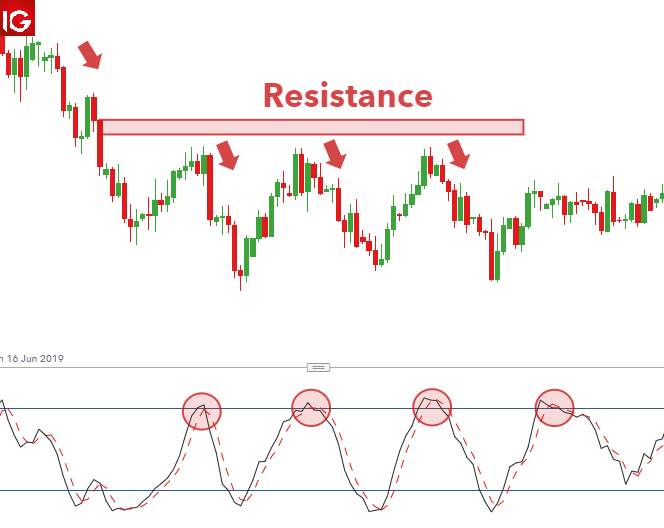
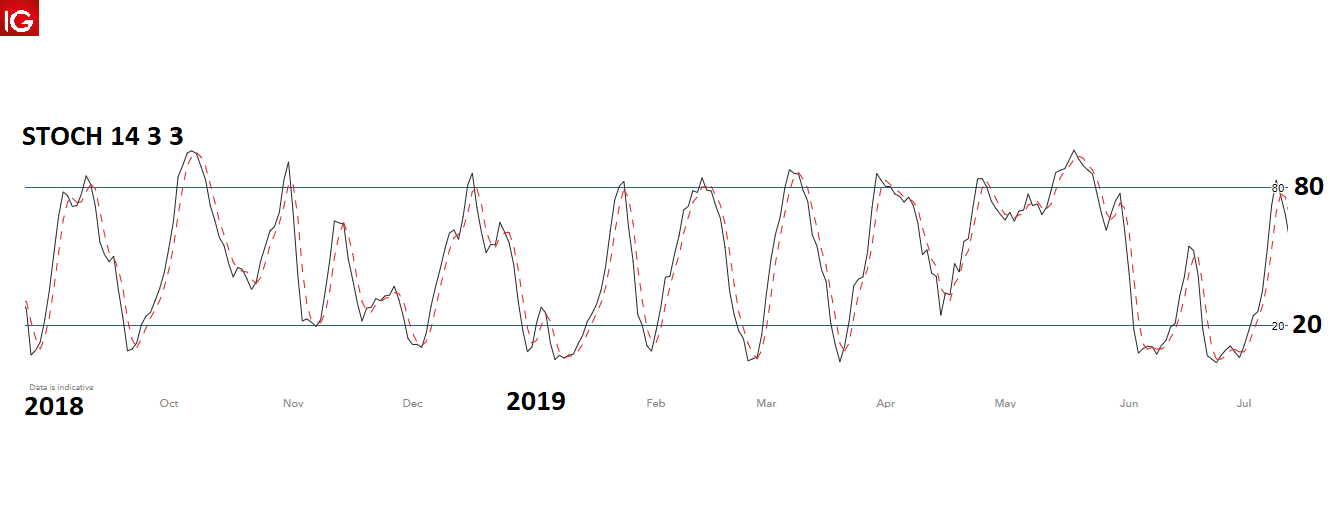
The stochastic oscillator presents two moving lines that ‘oscillate’ between two horizontal lines. The solid black line in the image below is called the %K and is determined by a specific formula (explained later in the article), while the red dotted line is a 3-period moving average of the %K line.

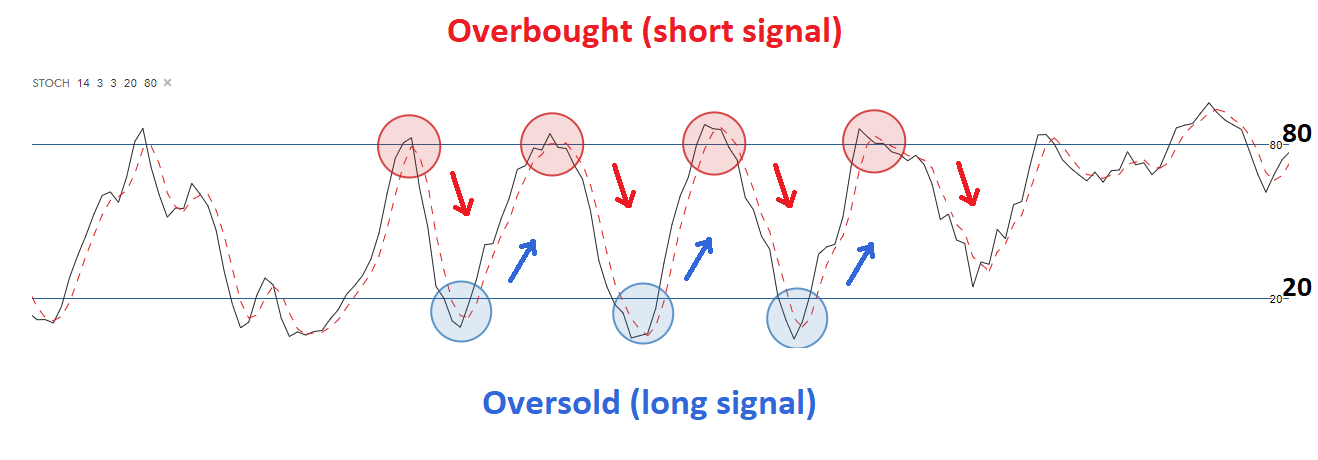
Price is shown to be ‘overbought’ when the two moving lines break above the upper horizontal line and ‘oversold’ once they break below the lower horizontal line.

The overbought line represents price levels that fit into the top 80% of the recent price range (high – low) over a defined period – with the default period often being ‘14’. Likewise, the oversold line represents price levels that fit into the bottom 20% of the recent price range.

Timing entries

Furthermore, the stochastic indicator provides great insight when timing entries. When both lines are above the ‘overbought’ line (80) and the %K line crosses below the dotted %D line, this is viewed as a possible entry signal to go short and visa versa when the %K line crosses above the %D line when both lines are below the oversold line (20).

Entry signals using stochastic oscillator

Additionally, traders should not blindly trade based on overbought/oversold conditions alone. Traders need to understand the direction of the overall trend and filter trades accordingly. For example, when looking at the USD/SGD chart below, since the overall trend is down, traders should only look for short entry signals at overbought levels. Only when the trend reverses or a trading range is well-established, should traders look for long entries in oversold conditions.
stochastic oscillator using trend as a filter

Stochastic Oscillator Formula

The below calculation is presented for a 14-period stochastic indicator but ultimately, can be tailored to any desired time frame.

Calculation for %K:

%K = [(C – L14) / H14 -L14)] x 100

Where:

C = latest closing price

L14 = Lowest low over the period

H14 = Highest high over the period

Calculation for %D:

%D = simple moving average of %K (3 period simple moving average is the most common)

Pros and Cons of Stochastic Oscillators

Traders ought to understand where the stochastic oscillator excels and where its short-comings lie, in order to get the most out of the indicator.

Pros Cons
Clear entry/exit signals Can produce false signals when used incorrectly
Signals appear frequently (depending on the selected time setting) If trading against the trend, prices can remain overbought/oversold for long periods
Available on most charting packages
Conceptually easy to understand

Stochastic Oscillators: A Summary

The stochastic indicator is a great tool for identifying overbought and oversold conditions over a specific time period. The stochastic oscillator is preferred by many traders when price is trading in a range because price itself is ‘oscillating’, leading to more reliable signals from the stochastic indicator. However, traders need to avoid blindly shorting at overbought levels in upward trending markets; and going long in down trending markets purely based on oversold conditions shown by the indicator.

Become a Better Trader with Our Trading Tips

  • If you are just starting out on your trading journey it is essential to understand the basics of forex trading in our free New to Forex trading guide.
  • Another oscillator indicator that shows overbought and oversold regions is the Relative Strength Index (RSI). However, the RSI is very different to the stochastic indicator which is why traders need to understand the formula and what the indicator communicates about price.
  • Commodity Channel Index (CCI), although its name refers to commodities, is an indicator that can be used in forex trading too. It tends to oscillate between a reading of +100 and -100 but unlike the stochastic indicator, uses statistical variation from the mean to produce signals.
The Psychology of Speculation in the Forex Market

The Psychology of Speculation in the Forex Market

What is speculation in the forex market?

Speculation in the foreign exchange market involves the buying and selling of currencies with the view of making a profit. It is called speculation because of the uncertainty involved as no one can say for sure whether the market will be going up or down. Traders assess the likelihood of either scenario before placing a trade.

What happens when it all goes wrong?

After you’ve developed a trading strategy centered around forex speculation and learned the basics of the market – you have many of the tools that are needed to be successful. And when that success doesn’t come, numerous questions can swirl around inside your head.

“Am I trading the right strategy?”, “Do I really know what I’m doing?”

These questions/doubts are not unique. Most traders have these thoughts at some stage or another and have learned how to overcome them. Let’s address these questions directly:

1) Am I Trading the Right Strategy?

Many traders don’t realize this early on – market conditions change over time. As a currency speculator, you can spend weeks analysing a specific market that suits your strategy at the time, but this is likely to change and when it does it will seem like nothing is working in your favour.

A perfect example of this can be seen when comparing EUR/USD in 2017 to the same currency pair in the first half of 2019.

In 2017, EUR/USD was is a strong uptrend for the majority of the year. Backtesting trend trading strategies would naturally yield attractive results and any reasonable trader would look to implement such a strategy.

currency speculation EUR/USD upward trend 2017

A very different picture can be seen below as EUR/USD trades sideways for the first six months of 2019, making things difficult for new trend traders. The red 200 day moving average helps make this point as it cuts through price many times and fails to provide a clear signal.

Forex speculation in EUR/USD 2019

Traders should dedicate some time to analyze whether or not market conditions have changed. It is very possible that the trading strategy is fine but the market no longer exhibits the characteristics that drew you to it in the first place.

2) Do I Really Know What I’m Doing?

“FAIL: First Attempt in Learning” – Anonymous

This is a difficult question to answer as this will depend on each trader’s knowledge and preparedness. Since this question cannot be answered, the next best thing to do is to look at what others have done wrong, learn from it, and avoid making the same trading mistakes.

At DailyFX we researched over 30 million live IG trades to discover the number one mistake traders make in our Traits of Successful Traders report. Understanding where it all goes wrong and making the necessary adjustments is the first step to trading like the professionals.

4 Tips to speculate like a successful trader and get back on track

1) Don’t Let Risk Change Your Behaviour

The biggest psychological obstacle for traders is the perception of losses (and the concept of losing). For traders, the pain of closing a trade and realizing a loss outweighs the excitement of realizing a winning trade of equal magnitude.

Top traders apply sound risk management first and foremost. Traders can win two-thirds of all their trades and still land up blowing up the account in the absence of using stops. A natural consequence of this is that traders allow losing positions to run, while taking profit as soon as a position turns positive. The losses outweigh the winners and this should never happen.

One way to manage your emotions is to implement a trailing stop or manually move your existing stop when the market moves in your favor. This way, traders can relax knowing that they are breaking even and any further movement in your favor is purely profit.

Currency speculation using stops

Before placing a trade, know what level of risk you are prepared to take on and ensure that the risk to reward ratio is at least 1:1.

2) Bring a Positive Mindset to the Charts Every Day

Since you will inevitably be taking losses in this game of forex speculation, it’s important to deny those losses from altering your frame of mind.

Traders will often experience the disappointment of being stopped out and this can be very discouraging. As a result of this they take shortcuts on their analysis or question their own approach. This never ends well.

The key to keeping a positive mindset in trading is to look at losses in the same way that a business owner looks at expenses; simply as a cost of doing business. Because once you’ve learned to lose properly, and after you’ve learned to keep those losses in scope of the bigger picture – you’ve addressed biggest aspects of trading psychology.

3) Strike the delicate balance between fear and greed

These two drives can have a large bearing in the way we live our lives; and not just in trading. When trading, both fear and greed can be massively detrimental, as they can cloud your judgment and lead to bad decisions.

Most human beings will be greedy when they have a losing position; willing to hold on if only price can come back to their entry level. And when in a winning position, most human beings will begin to be fearful.

Traders should look to reverse those drives and to be greedy when they’ve been proven right. If fearful, you can use the breakeven stop to help alleviate the concern that your initial risk is still exposed.

4) Don’t let confidence get the best of you

After putting together a string of successes, it’s human nature to build up confidence around your dealings and this can be a good thing.

But once a trader has gone into the territory of being ‘over-confident’, risky habits may sneak into their approach, none more damaging than the willingness to bend their own trading rules simply because they feel it will be successful.

Therefore, traders should always look to strike that delicate balance between being scared or fearful, and over-confident.