The CPI and Forex: How CPI Data Affects Currency Prices

The CPI and Forex: How CPI Data Affects Currency Prices

What is CPI and why does it matter to forex traders?

The Consumer Price Index, better known by the acronym CPI, is an important economic indicator released on a regular basis by major economies to give a timely glimpse into current growth and inflation levels.

Inflation tracked through CPI looks specifically at purchasing power and the rise of prices of goods and services in an economy, which can be used to influence a nation’s monetary policy.

CPI is calculated by averaging price changes for each item in a predetermined basket of consumer goods, including food, energy, and also services such as medical care.

It is a useful indicator for forex traders due to its aforementioned effect on monetary policy and, in turn, interest rates, which have a direct impact on currency strength. The full utility of knowing how to interpret CPI as a forex trader will be explored below.

CPI release dates

CPI release dates usually occur every month, but in some countries, such as New Zealand and Australia, quarterly. Some nations also offer yearly results, such as Germany’s index. The US Bureau of Labor Statistics has reported the CPI monthly since 1913.

The following table shows a selection of major economies and information about their CPI releases.

Country/jurisdiction Compiling body Frequency of releases
Australia Australian Bureau of Statistics Quarterly
Canada Statistics Canada Monthly
China National Bureau of Statistics of China Monthly
Eurozone European Central Bank Twice monthly
Germany Federal Statistical Office of Germany Monthly, yearly
Italy Istat Monthly
India Ministry for Statistics and Programme Implementation Monthly
Japan Statistics Japan Monthly
UK Monetary Policy Committee Monthly
US US Bureau of Labor Statistics Monthly

Why forex traders should follow CPI data

Understanding CPI data is important to forex traders because it is a strong measure of inflation, which in turn has a significant influence on central bank monetary policy.

So how does CPI affect the economy? Often, higher inflation will translate to higher benchmark interest rates being set by policymakers, to help dampen the economy and subdue the inflationary trend. In turn, the higher a country’s interest rate, the more likely its currency will strengthen. Conversely, countries with lower interest rates often mean weaker currencies.

The release and revision of CPI figures can produce swings in a currency’s value against other currencies, meaning potentially favorable volatility from which skilled traders can benefit.

Also, CPI data is often recognized as a useful gauge of the effectiveness of the economic policy of governments in response to the condition of their domestic economy, a factor that forex traders can consider when assessing the likelihood of currency movements.

The CPI can also be used in conjunction with other indicators, such as the Producer Price Index, for forex traders to get a clearer picture of inflationary pressures.

What to consider when trading forex against CPI data

When using CPI data to influence forex trading decisions, traders should consider the market expectations for inflation and what is likely to happen to the currency if these expectations are met, or if they are missed.

Similar to any major release, it may be beneficial to avoid having an open position immediately before. Traders might consider waiting for several minutes after the release before looking for possible trades, since forex spreads could widen significantly right before and after the report.

Below is a chart displaying the monthly inflation rates for the US. For the latest month, expectations are set at 1.6% inflation compared to last year’s data. If CPI is released higher or lower than expectations this news event does have the ability to influence the market.
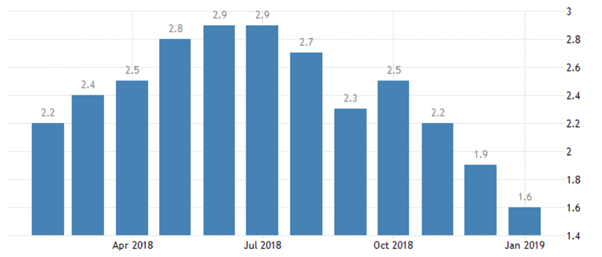
Chart to show US inflation levels in 2018/19. Source: TradingEconomics.com. US Bureau of Labor Statistics

One way the effects of CPI data can be interpreted is by monitoring the US Dollar Index, a 2018/19 example chart for which is below. If CPI is released away from expectations, it is reasonable to believe this may be the catalyst to drive the Index to fresh highs, or to rebound from resistance.

Since the Index is comprised of EUR/USD, USD/JPY, and GBP/USD, by watching the US Dollar we can get a full interpretation of the events outcome.
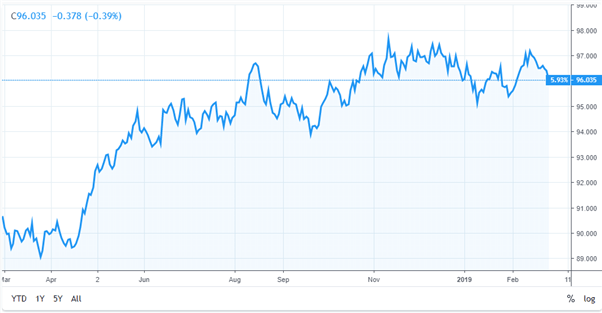
Chart to show movement in the US Dollar Index. Source: TradingView.com

As can be observed in the example above, as inflation rose during the first half of 2018, the US Dollar Index went up accordingly. But with US inflation drifting lower in the following months and with a missed target of 2%, this pushed US interest rate hikes off the agenda. As a result, the dollar struggled and weakened against a basket of other currencies.

Not every fundamental news release works out through price as expected.

Once the CPI data has been released and analyzed, traders should then look to see if the market price is moving through or rebounding off any areas of technical importance. This will help traders understand the short-term strength of the move and/or the strength of technical support or resistance levels, and help them make more informed trading decisions.

RBA Governor Michele Bullock Pours Cold Water on Rate Hike Chatter

RBA Governor Michele Bullock Pours Cold Water on Rate Hike Chatter

The RBA Press Conference

On Tuesday (May 7), RBA Governor Michele Bullock held the heavily anticipated RBA press conference. Key comments included,

  • Need vigilance about high inflation, with high petrol prices and services inflation influencing headline inflation trends.
  • Interest rates at the right level to bring inflation to target in 2025.
  • Some households are struggling to make ends meet, impacting household consumption.
  • Difficult path to bring inflation to target while supporting employment growth.
  • The RBA cannot let inflation take hold.
  • Regarding the budget, the government has inflation in mind while considering the upcoming budget.
  • Nevertheless, the RBA is in a wait-and-see mode vis-à-vis the budget.
  • Governor Bullock does not think further tightening is needed unless inflation is stickier than expected.
  • The Board did discuss an interest rate hike but viewed the status quo as more appropriate.
  • The Australian government is looking for more steady immigration, which could lessen the impact on demand. However, immigration also contributes to the labor supply.
  • Immigration does affect the housing market with higher rents.
  • Tight labor market stemming from the essential services sectors. Weak consumption has impacted labor market conditions across the hospitality and retail sectors.
  • Consumers are responding to higher interest rates by cutting back on spending.
  • Some households are increasing savings to pay down mortgages more quickly in the elevated mortgage rate environment.
  • Hours worked, youth unemployment, and part-time employment trends signaling a weaker labor market environment.
  • Financial conditions are restrictive for households. However, the equity and corporate bond markets support financing for larger corporations.

RBA Rate Statement Flags Elevated Inflation

On Tuesday (May 7), the RBA left the Cash Rate unchanged at 4.35%. However, the Rate Statement highlighted concerns about inflation falling more slowly than expected toward the target range.

Experts trade the markets with IC Markets

Trading Derivatives carries a high level of risk to your capital and you should only trade with money you can afford to lose. Trading Derivatives may not be suitable for all investors, so please ensure that you fully understand the risks involved, and seek independent advice if necessary. A Product Disclosure Statement (PDS) can be obtained either from this website or on request from our offices and should be considered before entering into a transaction with us. Raw Spread accounts offer spread

Salient points from the RBA Rate Statement included,

  • Inflation continues to soften but at a slower pace than expected.
  • Board members attribute the slower-than-expected fall in inflation to petrol prices and services inflation.
  • Incoming data continues to signal excess demand in the economy and strong domestic cost pressures. Labor and non-labor inputs fueled cost pressures.
  • Wage growth appears to have peaked but remains above a sustainable level, considering productivity growth trends.
  • Central forecasts are for inflation to return to the target range of 2-3% in H2 2025.
  • Resilient services inflation is a key uncertainty, with services inflation likely to fall more modestly than previously forecast.
  • High inflation and RBA rate hikes have impacted household consumption growth.
  • The RBA expects real income to increase during 2024 to support consumption.
  • Board members highlighted a risk that household consumption increases more slowly than expected, which may impact growth and the labor market.
  • While the economic outlooks for China and the US have improved, uncertainties stemming from geopolitics are elevated.
  • The Board considers returning inflation to target within a reasonable time frame the highest priority.
  • The RBA rate path to bring inflation to target remains uncertain and the board is not ruling anything in or out.

AUD/USD Reaction to the RBA Statements and Press Conference

Before the RBA Rate Statement and press conference, the AUD/USD fell to a low of $0.66172 before rising to a high of $0.66437.

However, in response to the RBA Rate Statement, the AUD/USD tumbled to a pre-press conference low of $0.65972. In reaction to the RBA press conference, the AUD/USD fell to a Tuesday session low of $0.65877. The Aussie dollar trended lower on RBA Governor Bullock pouring cold water on rate hike expectations.

On Tuesday (May 7), the AUD/USD was down 0.57% to $0.65878.

AUD/USD reacts to the RBA Rate Statement and press conference.
070524 AUDUSD 3 Minute Chart
Japanese Yen Sentiment Analysis & Market Outlook: USD/JPY, EUR/JPY, GBP/JPY

Japanese Yen Sentiment Analysis & Market Outlook: USD/JPY, EUR/JPY, GBP/JPY

USD/JPY FORECAST – MARKET SENTIMENT

IG data reveals a bearish tilt in sentiment towards USD/JPY, with 65.61% of clients holding net-short positions. This translates to a short-to-long ratio of 1.91 to 1. However, this bearishness has eased somewhat compared to both yesterday and last week.

Our trading approach often incorporates a contrarian perspective. The prevailing bearish sentiment suggests a potential for USD/JPY to push higher. Yet, the recent easing in net-short positions weakens this signal, creating a more different outlook: the broader trend may be on the cusp of reversing lower despite the fact that sellers continue to dominate.

Important Note: These mixed signals highlight why contrarian indicators shouldn’t be used in isolation. Always combine them with a thorough technical and fundamental analysis of USD/JPY for a more comprehensive and informed trading strategy.

Keen to understand how FX retail positioning can provide hints about the short-term direction of EUR/JPY? Our sentiment guide holds valuable insights on this topic. Download it today!

EUR/JPY FORECAST – MARKET SENTIMENT

According to IG data, there’s a noticeable bearish sentiment surrounding EUR/JPY, with 69.73% of clients currently selling the pair. This equates to a short-to-long ratio of 2.30 to 1. Interestingly, while the bearishness towards the euro remains strong, it has slightly eased compared to both the previous trading session and last week.

We often employ a contrarian perspective in our trading. The prevalent pessimism towards EUR/JPY might hint at further upside in the near term. However, the recent decrease in the aggregate number of sellers introduces an element of uncertainty, as the shift in positioning may imply the broader trend could be about to reverse to the downside.

Key Takeaway: Contrarian signals provide a valuable alternative viewpoint, but they are most powerful when combined with technical and fundamental analysis. In the case of EUR/JPY, a comprehensive approach is crucial for navigating these conflicting signals.

Feeling discouraged by trading losses? Take control and improve your strategy with our guide, “Traits of Successful Traders.” Access invaluable insights to help you avoid common trading pitfalls and costly errors.

 GBP/JPY FORECAST – MARKET SENTIMENT
Based on IG data, 65.45% of retail clients are betting on GBP/JPY to decline, with the short-to-long ratio standing at 1.89 to 1. The tally of traders selling the pair is 11.54% higher than yesterday, but 12.93% lower than seven days ago. Conversely, bullish positions are 1.53% higher than yesterday and 85.98% above last week’s levels.

Our trading strategy often diverges from mainstream market sentiment. The fact that traders are net-short suggests there may be potential for GBP/JPY to rise in the near future. However, we have limited confidence in this call as bearishness has decreased significantly on the weekly timeframe. The mixed signals weaken our contrarian outlook, leading us to adopt a more neutral stance on GBP/JPY.

Major reminder: Contrarian signals can offer valuable insights, but they are most powerful when combined with a broader market analysis. In the case of GBP/JPY, the mixed signals necessitate a more nuanced approach that incorporates technical and fundamental analysis.

Using Candlestick Wicks to Identify Price Action Support and Resistance

Using Candlestick Wicks to Identify Price Action Support and Resistance

In that scenario the main takeaway is the point at which the wick began to form – which is the same price at which the reversal started to show on lower time frames – is a resistance price of relevance and something that traders can follow on their chart for future trade setups or analysis.

But – what about when multiple wicks align at the same price point?

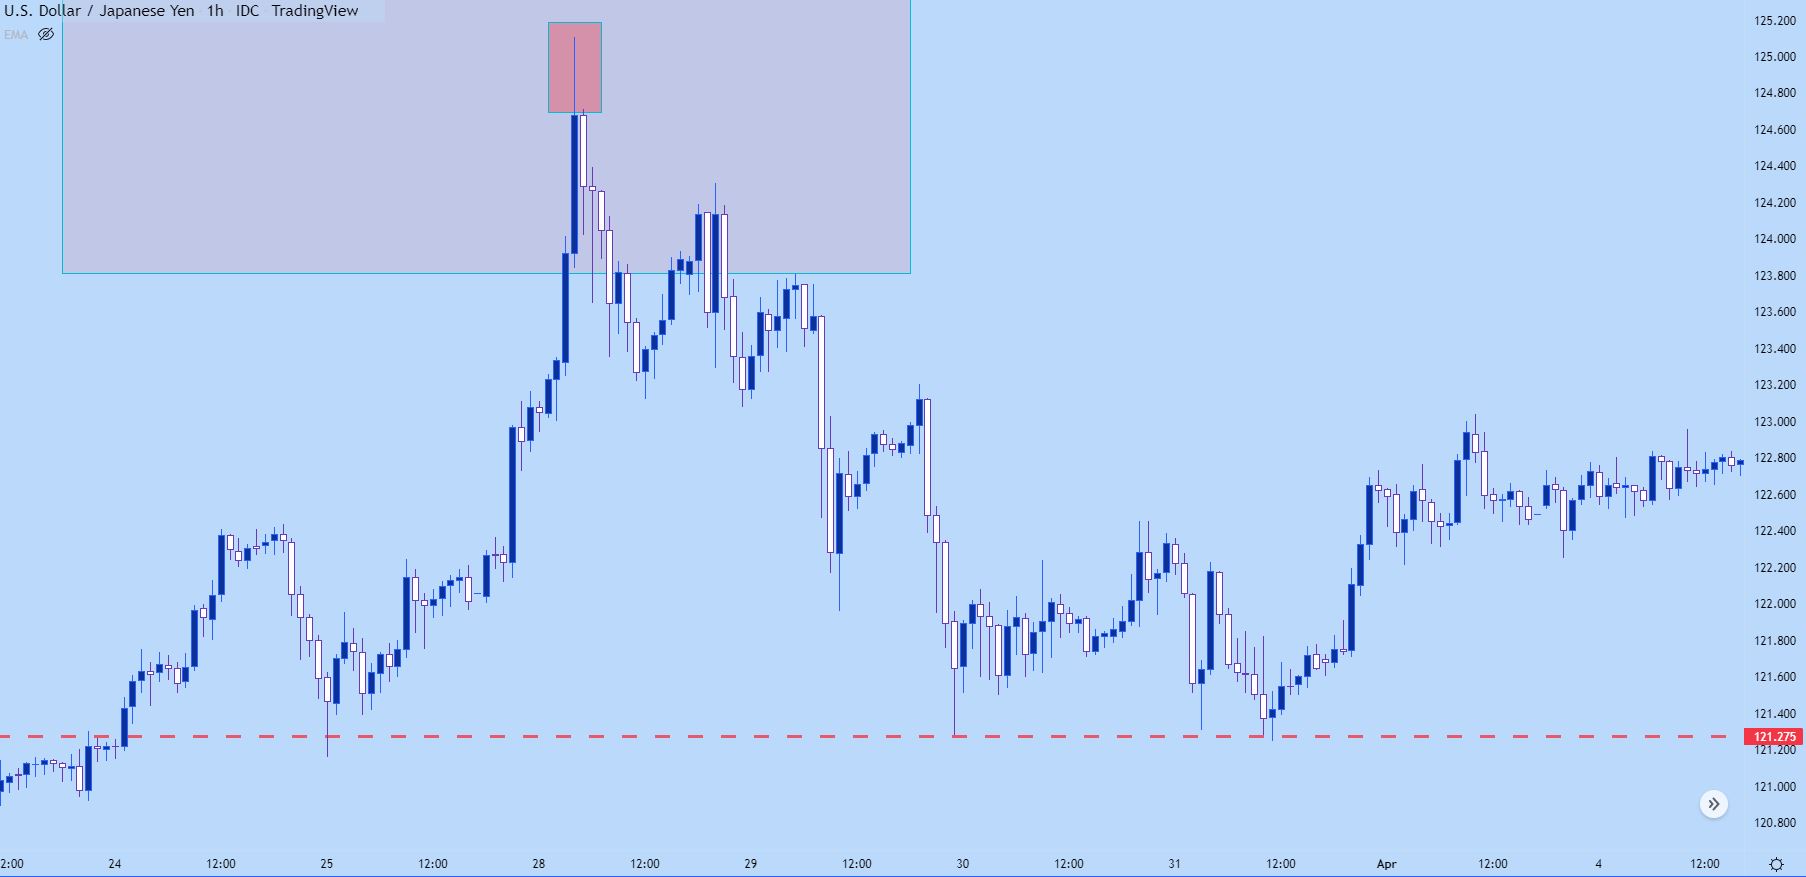
You might remember the final point of our last article, in which I wanted to draw your attention to a red line on that USD/JPY chart. I’ll post it again below to highlight what I’m talking about.

USD/JPY Hourly Price Chart

Chart prepared by James Stanley; USD/JPY hourly chart, late March – early April 2022

Previously we were looking at the reversal as started by the extended wick on this hourly chart. But, look at what happened at the red line after the move had priced-in.

As price hit the red line after topping, the sell-off stopped. Sellers took another swing but when touching that level for a second time, similarly, the sell-off stopped.

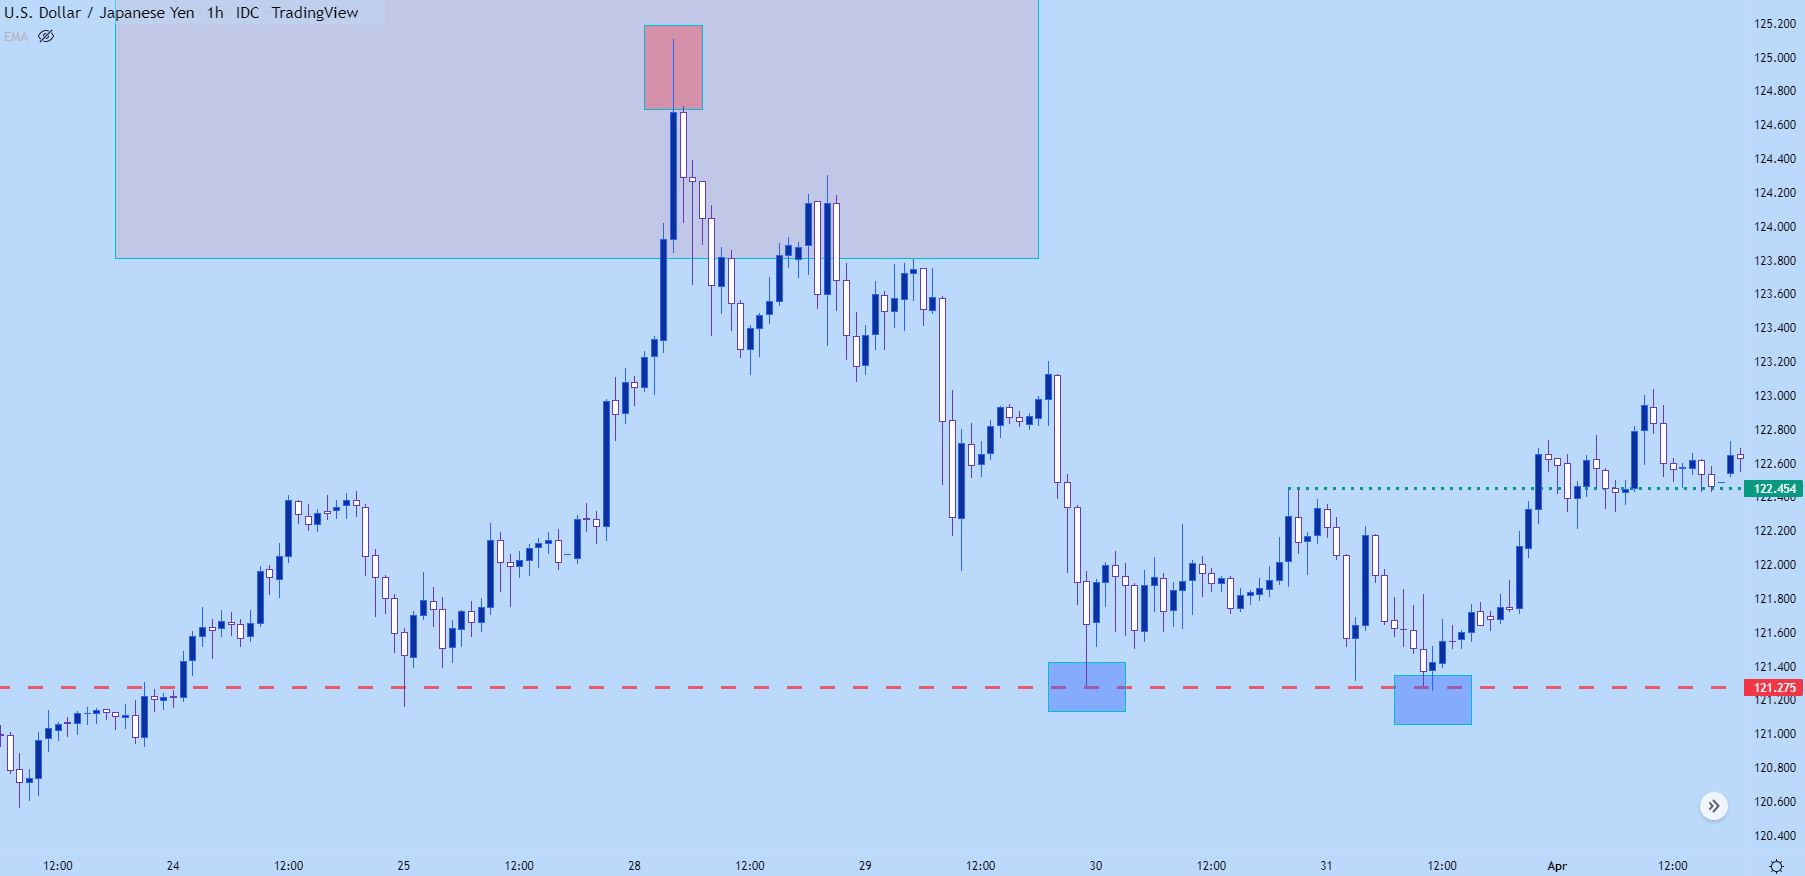
This is indication of support. Below, I take a closer look at this item with a blue box around each bounce. I’ve also added a green line that we’ll talk about a little later.

USD/JPY Hourly Price Chart

Chart prepared by James Stanley; USD/JPY hourly chart, late March – early April 2022

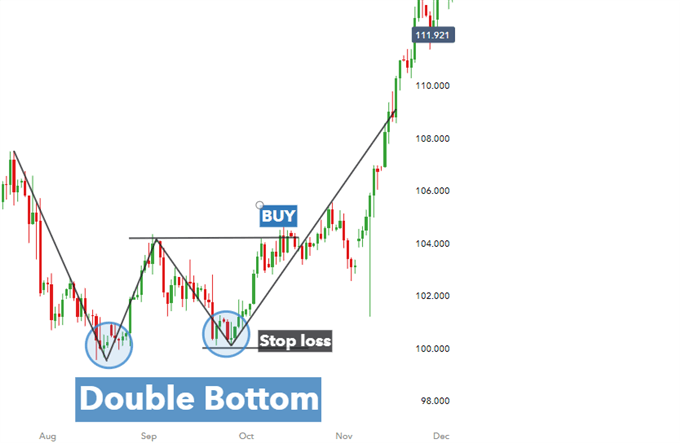
When a point of support shows two inflections, that brings up a possible double bottom formation. Such formations are often followed with the aim of bullish reversals, driven by the premise that price hit a level of support that it could not breach and, eventually, that support played out with buyers reversing the trend to bring on higher prices.

Remember that green line? Well, that would be called the ‘neckline’ from such a formation, and it’s simply the high point between the two support inflections. A breach of that neckline opens the door for bullish trends as a short-term breakout takes hold.

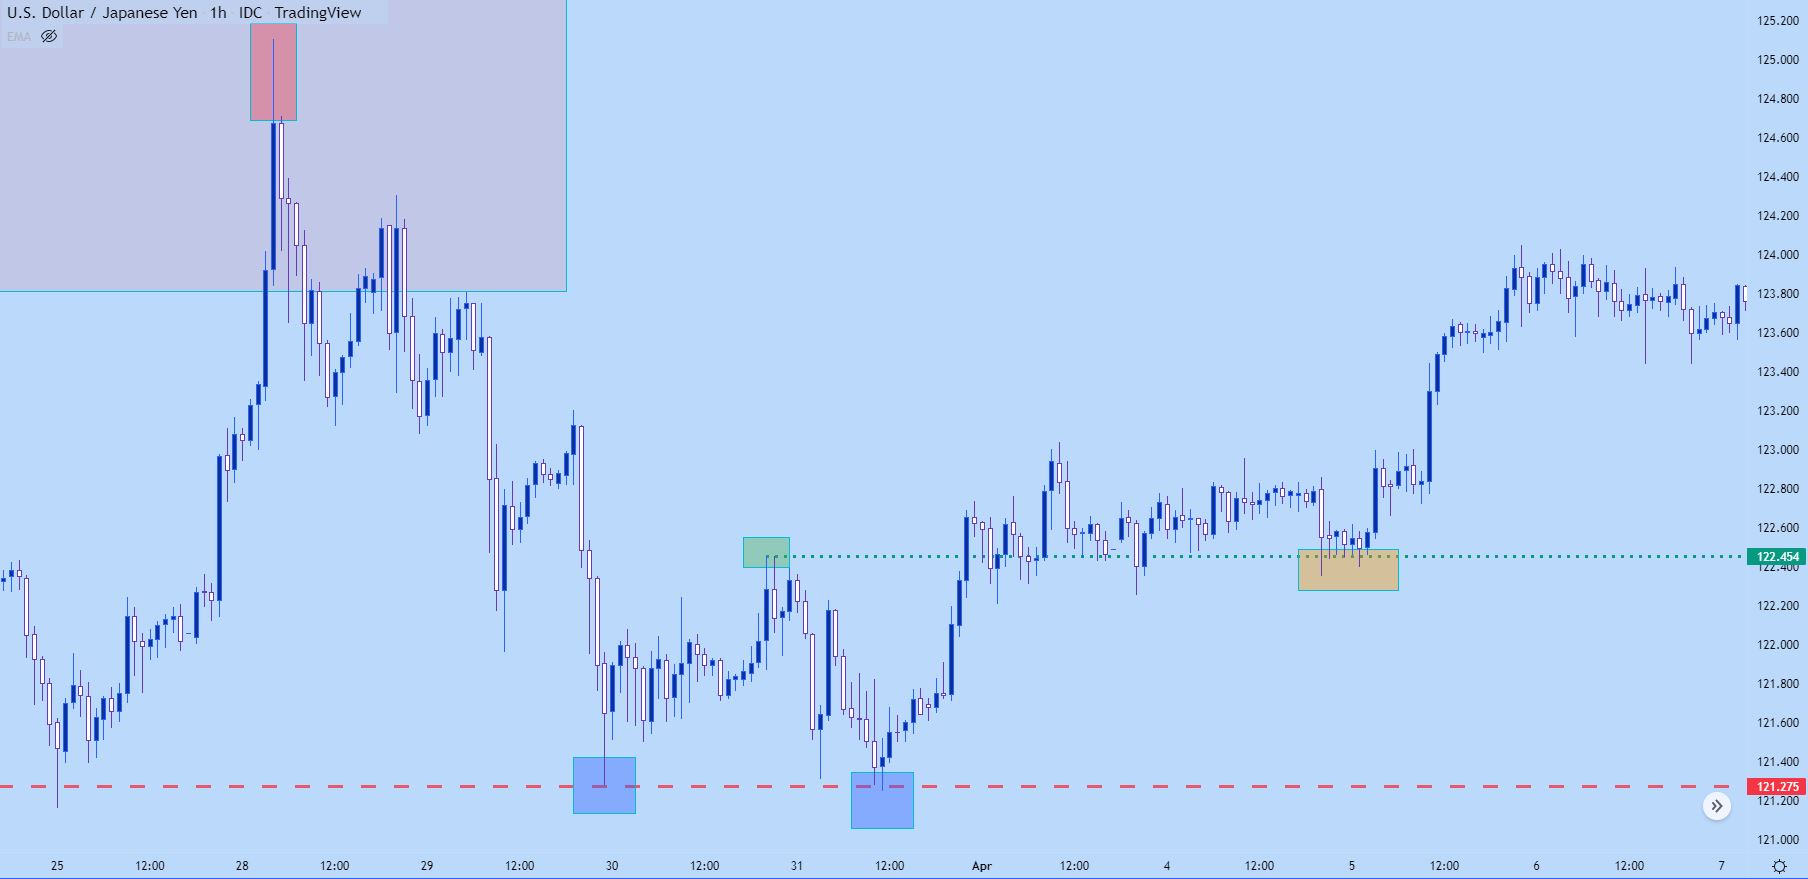
In the below example, we can see where that breakout hits shortly after the second support inflection, after which the green line of prior resistance is soon re-purposed as support before the bullish trend launches higher.

USD/JPY Hourly Price Chart

Wick Sequencing

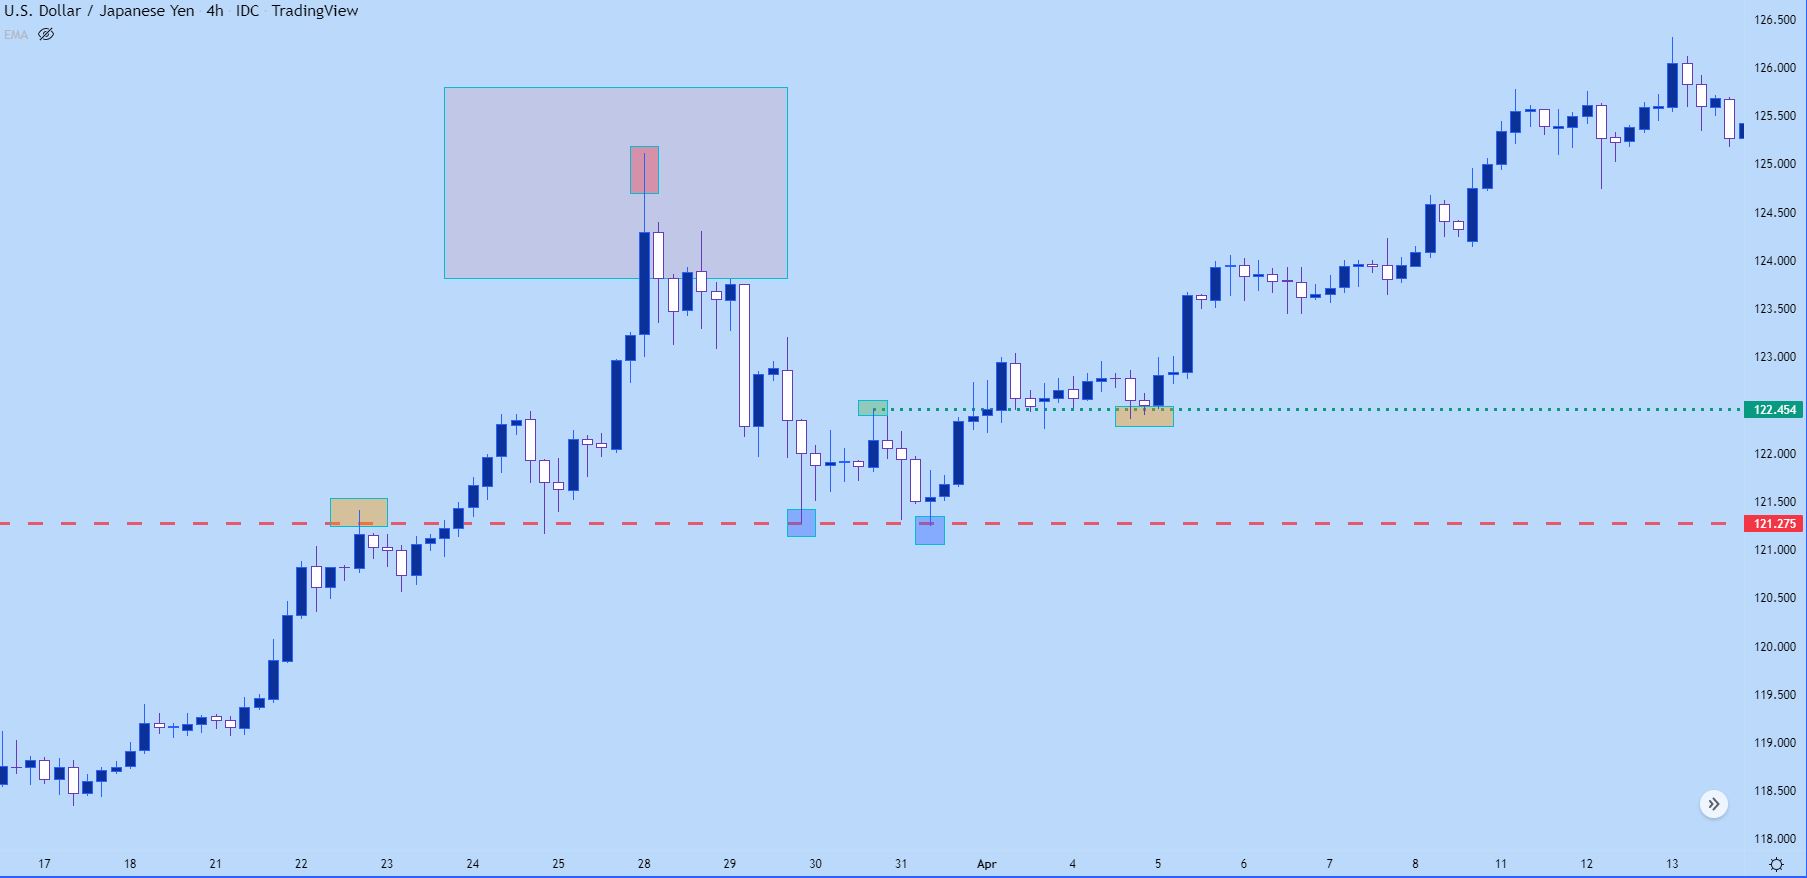
Let’s look at that same example again but, this time we’ll use a four hour chart. The benefit of a four hour chart is that we’re getting a lot more information in the same number of candles but, the trade-off is less granularity.

But, price is price, and whether that price served as support or resistance on a one minute or a weekly chart, it will show on the candlestick chart as an inflection.

But – when we get a grouping of candles all showing wicks in a similar area – that’s highlight a key price level that’s at work, continuing to drive price flows in that market as it comes into play. On the below chart, notice the orange boxes, one on left and the other on the right side of the chart.

The first orange box is showing resistance which later became support. And the second orange box shows support that was prior resistance. The key being that these prices didn’t just drop on the chart, there was prior reference at these levels from previous days’ trading activity.

USD/JPY Four-Hour Price Chart

Sentiment Analysis for Forex Trading

Sentiment Analysis for Forex Trading

What is Market Sentiment?

Market sentiment defines how investors feel about a particular market or financial instrument. As traders, sentiment becomes more positive as general market consensus becomes more positive. Likewise, if market participants begin to have a negative attitude, sentiment can become negative.

As such, traders use sentiment analysis to define a market as bullish or bearish, with a bear market characterized by assets going down, and a bull market by prices going up. Traders can gauge market sentiment by using a range of tools such as sentiment indicators (see below), and by simply watching the movement of the markets, using the resulting information to make their decisions.
What is Sentiment Analysis in forex trading?

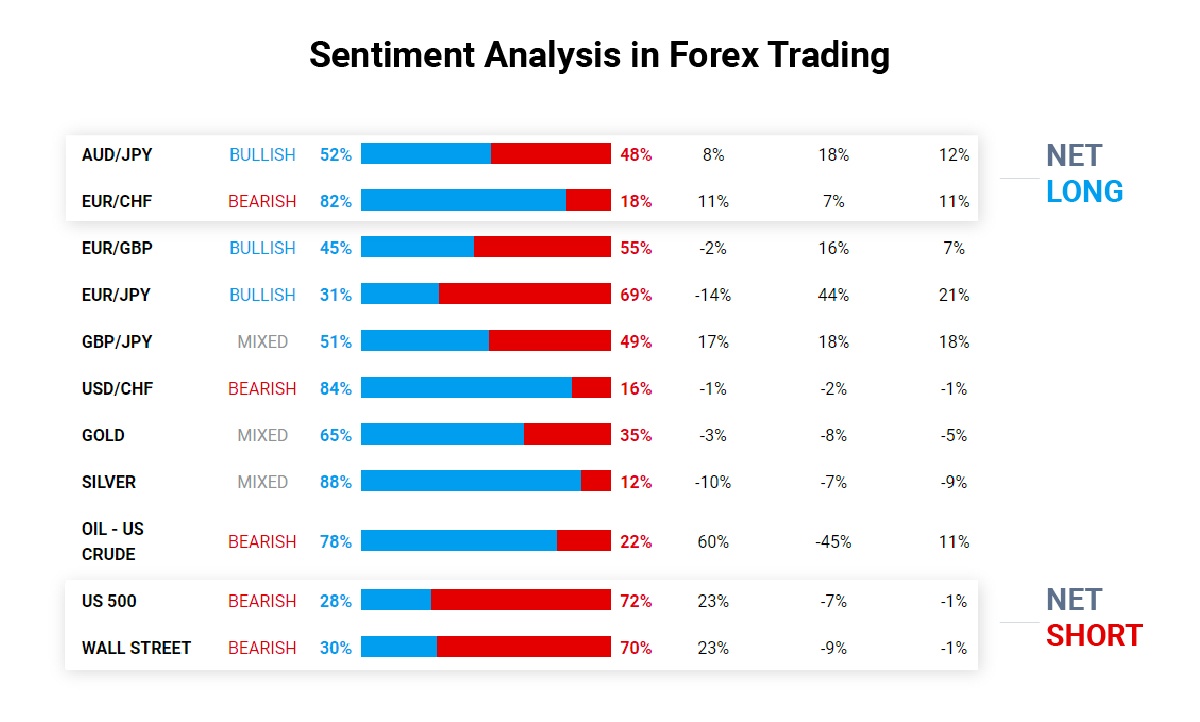
Forex sentiment analysis is the process of identifying the positioning of traders, whether net long or net short, to influence your own trading decisions in the currency market. While sentiment analysis can be directly translated to forex, it is also used for stocks and other assets. Contrarian investors will look for crowds to either buy or sell a specific currency pair, while waiting to take a position in the opposite direction of sentiment.

Sentiment analysis showing net long and net short

How Forex Sentiment Analysis Works

An example of how sentiment analysis can be applied in forex trading is a large single movement in GBP/USD in 2016, with negative sentiment sending GBP slumping to a 31-year low following Britain’s vote to leave the European Union. After broadly positive sentiment in the year that followed, negative sentiment then took over much of 2018 again before prices started to trend higher in 2019.

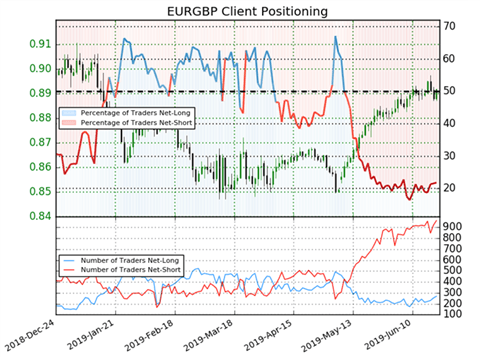
Another example of net short sentiment can be seen in the EUR/GBP chart below, with 21.9% of traders net-long with a ratio of traders short to long at 3.58 to 1. The chart shows in blue the percentage of IG traders taking a net long position, and in red the percentage taking a net short position.

Chart to show net negative sentiment alongside price action

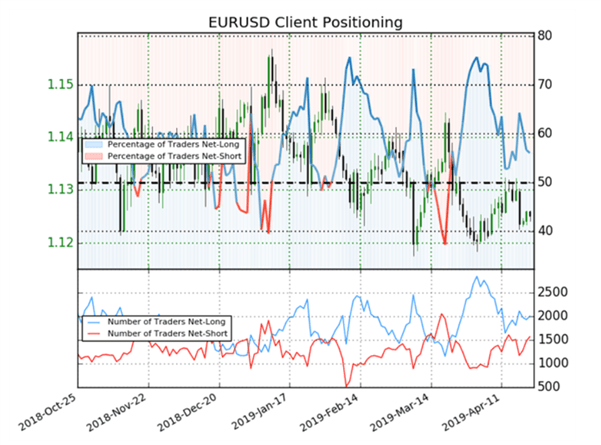
Rising sentiment may mean there are few traders left to keep pushing the trend up. In this case, traders may want to watch for a price reversal. On the other hand, a price moving lower, showing signals that it has topped may prompt a sentiment trader to enter short. The below chart shows an example of the EUR/USD pair experiencing net positive sentiment.

Using Sentiment Indicators

Sentiment indicators are numeric or graphic representations of how optimistic or pessimistic traders are about market conditions. This can refer to the percentage of trades that have taken a given position in a currency pair. For example, 70% of traders going long and 30% going short will simply mean 70% of traders are long on the currency pair.

The best sentiment indicators for forex traders include IG Client Sentiment (as seen in the charts above) and the Commitment of Traders (COT) Report.

IG Client Sentiment

IG Client Sentiment can be a useful tool to incorporate into your trading strategy. It can give a helpful picture of the number of long and short trades occurring in a particular market, giving an impression of the turning points in sentiment. For more on this indicator and how it can assist your trading, be sure to click the link above.

Commitments of Traders Report

The Commitment of Traders (COC) Report, published weekly by the Commodity Futures Trading Commission (CFTC), is compiled from submissions from traders in the commodities markets, giving a picture of the commitment of classified trading groups. The CFTC’s report is released every Friday at 15:30 Eastern Time and can be a useful market signal.

How to Create a Trading Plan

How to Create a Trading Plan

MUST HAVE A TRADING PLAN

In anything we set out to do, if we intend on it having a shot at success, don’t we plan ahead? Some type of plan? Trading is of course not different. Markets are too dynamic, full of too much uncertainty, to try and navigate them without a solid framework in place. A plan is imperative if you are to achieve consistent trading results. They are also excellent at helping you identify your strengths and weaknesses so you can gravitate towards doing more of what works and further away from what doesn’t.

RISK MANAGEMENT

As I stress in all my webinars, proper risk management is one of, if not the most critical aspects to successful trading. Trading psychology for the discretionary trader runs with risk management in importance. Without good risk management the rest of the trading plan will not won’t matter, regardless of how good it may be. This is the very first thing you need to get straight in your plan.

You need to know your risk tolerance and adopt a risk management strategy which fits you. Know how much risk-per-trade you will take and total account risk across several positions. What is the max number of positions you will hold at once? (Fewer are easier to manage.)

Have a max drawdown figure in place as a ‘kill switch’ when things aren’t going well. For example, if you experience a drawdown of 10% you will either take a break or at least reduce your trading size. Remember, job #1 as a trader is capital preservation. (For more details, check out this session on risk management.)

ANALYTICAL APPROACH

This is straight forward – what do you use to identify set-ups? It doesn’t matter so much what you use, just that it makes sense and is used consistently. It could be some combination of price support and resistance, trend-lines/slope analysis, chart patterns, Fibonacci levels, moving averages, Elliot Wave Principle (EWP), sentiment analysis, fundamentals, etc. Perhaps all together something else. Have a process in place, is the point. In the beginning this will be difficult to outline but with time things will start to come together. Even if you have been doing this for a while, a year or two, your plan is likely to continue to change, perhaps dramatically so, as you continue to mature as a trader.

WHAT MARKETS WILL YOU FOCUS ON?

Not every market moves the same. It’s a good idea to keep your universe relatively small as it helps not only keep things simple but allows you to learn the personalities of the markets in focus. You can take it a step further and focus on specific time-frames from each market type. For example, you may trade equity indices on a very short-term time horizon (days or less), but choose to trade FX from a swing-trader standpoint (several days to several weeks). You could also have dynamic exposure to one market over another, i.e. – 75% FX, 25% indices/commodities.

TIME-FRAME, HOLD TIME

On average, what is the intended hold time for your trades? Are you a swing-trader, holding for several days to weeks using weekly/daily/4-hr charts, or do you focus on day-trading, with hold times of a few hours or less, thus using daily down to even a 1-minute chart? It could be some blend of the two.

For beginner traders interested in day trading, it is a good idea to focus on taking it slow with slower time-frames before moving towards the rapid pace of intra-day trading. It’s a good idea to focus on only a couple of time-frames at most, as trying to manage trades across several time-frames can be a difficult task even for seasoned traders.

FAVORITE TRADE SET-UPS

What set-ups work best for you, those that resonate with you the most? It probably goes without saying, but these should be at the core of your trading. Set-ups are based on the alignment (confluence) of any number of factors which make for a high conviction trading opportunity. If you are new to trading, then this will take some time to figure out, so be patient in making progress towards understanding what works best for you.

A set-up is one thing, but how you execute it is another. There is the set-up, then the method by which you will take advantage of the set-up. For example, a group of ten traders could sit down at a computer with the same set of tools, but how the market is analyzed and then executed upon with vary from one to another. For example, a market could be ranging and one trader will buy immediately as the market breaks out of the range while another trader who has identified the same range breakout, might wait to trade the first pullback. Or some combination of the two entry strategies.

HANDLING ADVERSITY (AND SUCCESS)

When you hit the inevitable drawdown, what will you do to make sure it doesn’t become damaging? You should reduce your trading size or stop trading altogether for a short period of time so you can alleviate stress and figure out what is going wrong. It is very important to have a plan for this before it happens.

It is also important to have a plan in place for when things are going well. Overconfidence can be a killer and lead to a drawdown if not correctly managed. While it is good to be more aggressive when market conditions are conducive and you’re doing well, but you need to do so responsibly. Increasing your risk by 50% isn’t out of control, but suddenly quadrupling your risk is, and is setting you up for a frustrating and potentially devastating outcome.

HAVE A ROUTINE FOR STAYING ON TRACK

You should set aside time to reflect on the week’s events and how you traded. It’s a good idea to regularly review your trading plan and make tweaks if necessary. Periodic review of your history and keeping a trading journal are excellent ways to ensure you are following the process outlined in your plan, as well as identifying patterns in your trading that can lead to further tweaking of your plan. Save charts of trade set-ups so you can remind yourself on a regular basis what good and bad trades look like.

FTSE 100 on Track for yet Another Record High while Dow and S&P 500 Recover

FTSE 100 on Track for yet Another Record High while Dow and S&P 500 Recover

FTSE 100, Dow Jones, S&P 500 – Analysis and Charts

​​​FTSE 100 hits yet another record high

​ ​The FTSE 100 is on track to make yet another record high above the 8,200 mark. Further up lies the 8,301 level where the 161.8% Fibonacci extension of the March-to-June 2020 advance, projected higher from the October 2020 low, can be found.

​Support is seen along the April-to-May support line at 8,160 and at Wednesday’s 8,096 low. Further down lie the early-to-mid-April highs and last Wednesday’s low at 8,046 to 8,003.

FTSE 100 Daily Price Chart

​Dow recovers ahead of Non-Farm Payrolls

​The Dow Jones Industrial Average managed to find support at its 37,705 current May low and is attacking last week’s high at 38,595 ahead of US Non-Farm Payrolls. Further up meanders the 55-day simple moving average (SMA) at 38,735 and sits the 10 April high at 39,029.

​Slips below Monday’s high at 38,408 may find support along the breached April-to-May downtrend line at 38,164.

Dow Jones Daily Price Chart

​​The S&P 500 seems to have found support at this week’s low at 5,009 and has been boosted by Apple earnings beat with it heading back up towards last week’s high, the 55-day simple moving average (SMA) and April-to-May downtrend line at 5,120 to 5,138 ahead of Friday’s NFP data release.

​Minor support lies around the 5,040 mark where the mid-April low and the 22 April high were made.

S&P 500 Daily Price Chart

Market Update – Apple Soars, Gold Struggles, USD and VIX Slip, Sentiment Positive Ahead of NFPs

Market Update – Apple Soars, Gold Struggles, USD and VIX Slip, Sentiment Positive Ahead of NFPs

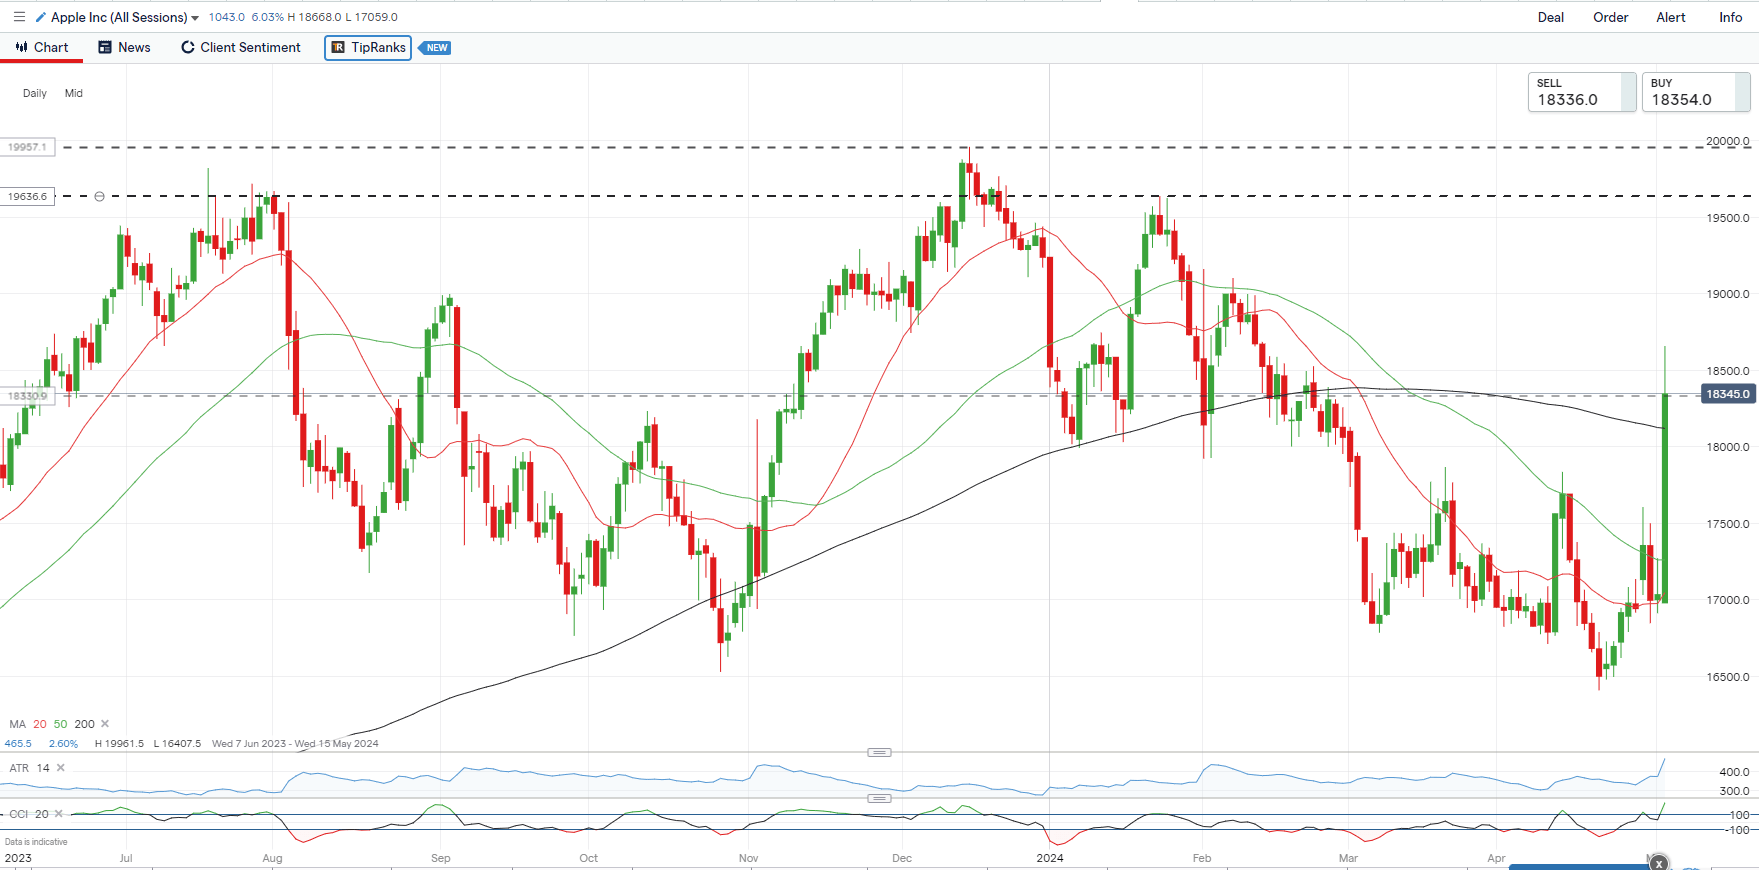
Apple’s Q2 earnings are giving markets an early boost, after the world’s 2nd largest company beat market expectations across a range of metrics and announced a record-breaking USD110 billion share buyback, up from USD90 billion last year. Apple shares rose by 2.3% during regular hours and added nearly 6% in after-hours trading. The move higher has broken a recent series of lower highs and leaves $196-$200 as the next zone of resistance.

Apple (APPL) Daily Chart


image1.png

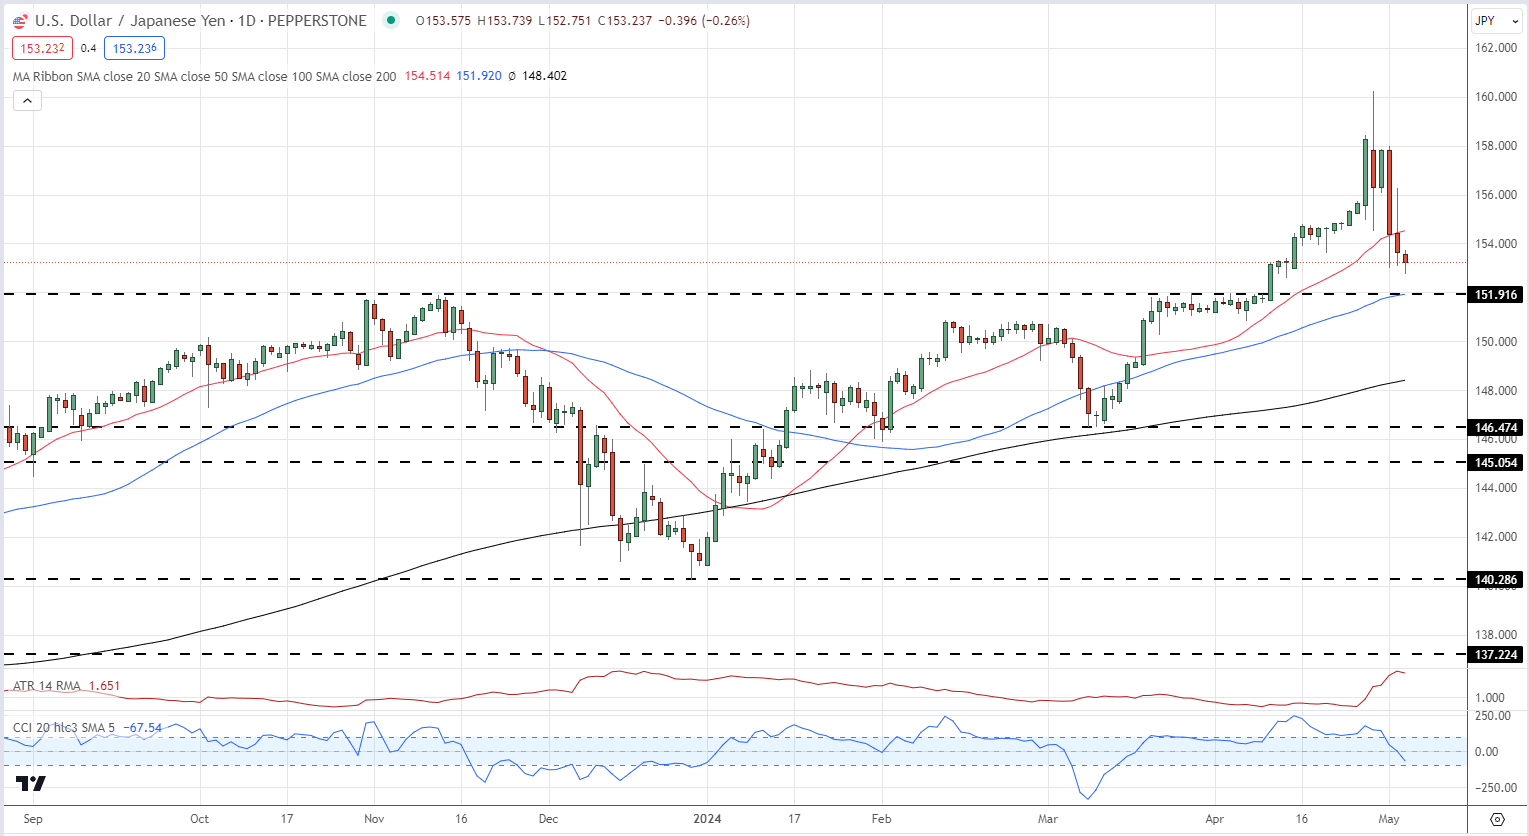
The Japanese Yen is finally seeing the benefit from the recent rounds of official intervention and is pushing higher, in holiday-thinned trade. USD/JPY is back just above 153.00, its lowest level in nearly three weeks, and is moving towards a prior area of interest around 151.90. Below here 150.00 comes into focus. Japan is closed on Monday 6th.

USD/JPY Daily Chart

image2.png

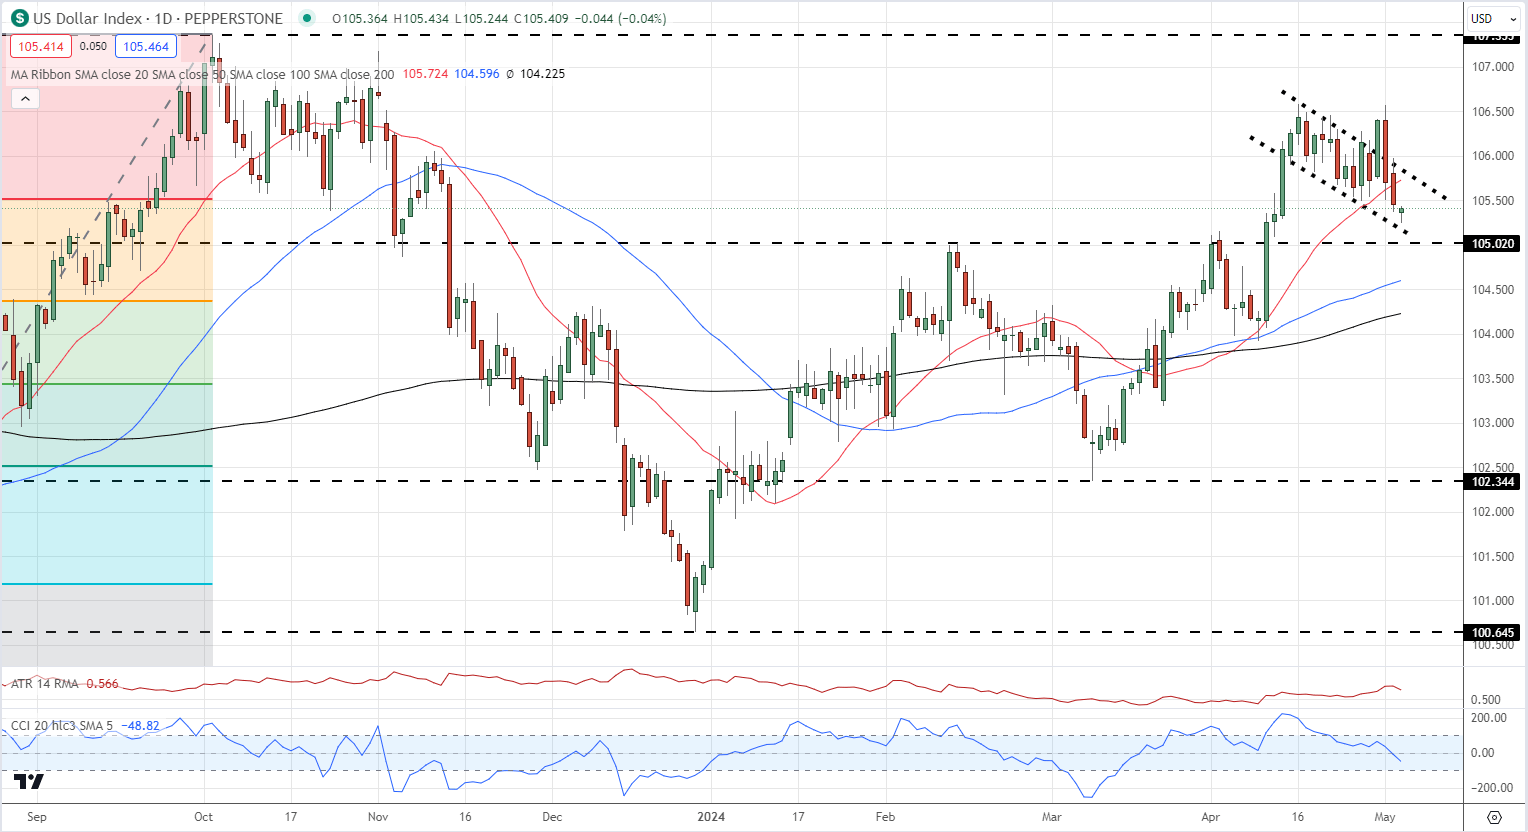
A recent sell-off in US Treasury yields is weighing on the US dollar. UST 2s hit 5.04% on Thursday and are now quoted at around 4.93%, while the benchmark UST 10s are offered at 4.63%, around 7 basis points lower than this week’s high.

The US dollar index remains channel bound and recent thoughts that a bullish flag was forming are being tested. Today’s US Jobs Report (13:30 UK) will decide the dollar’s fate ahead of the weekend.

US Dollar Index Daily Chart

image3.png

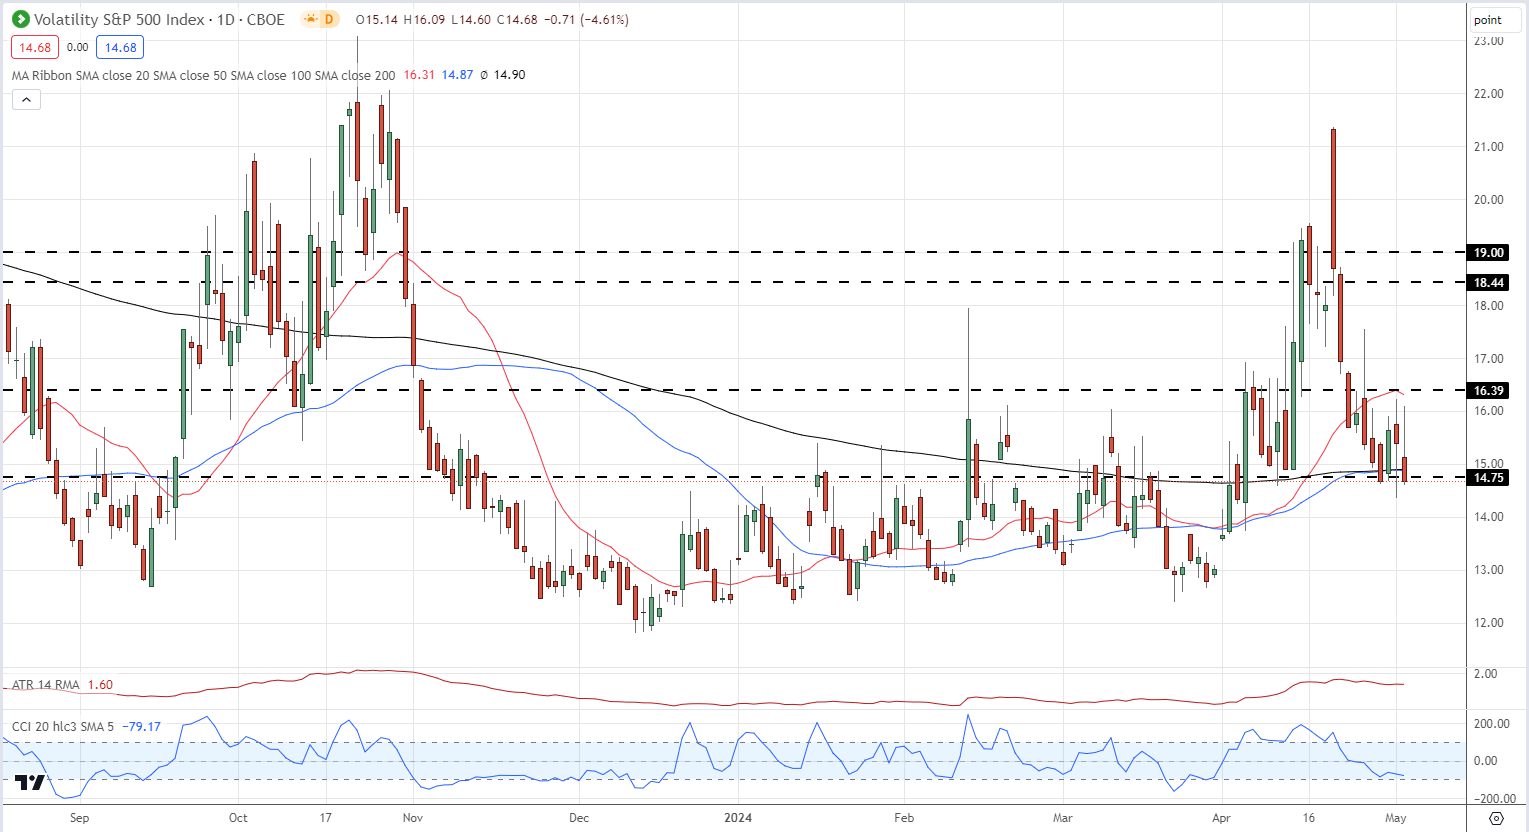
The latest bout of risk-on sentiment can be seen in the VIX ‘fear gauge’ which is now testing multi-week lows. The VIX is now testing both the 50- and 200-day simple moving average, and a confirmed break below these two indicators could see the VIX testing a cluster of prior lows down to the 12.00 level in the coming days.

VIX Daily Price Chart

image4.png

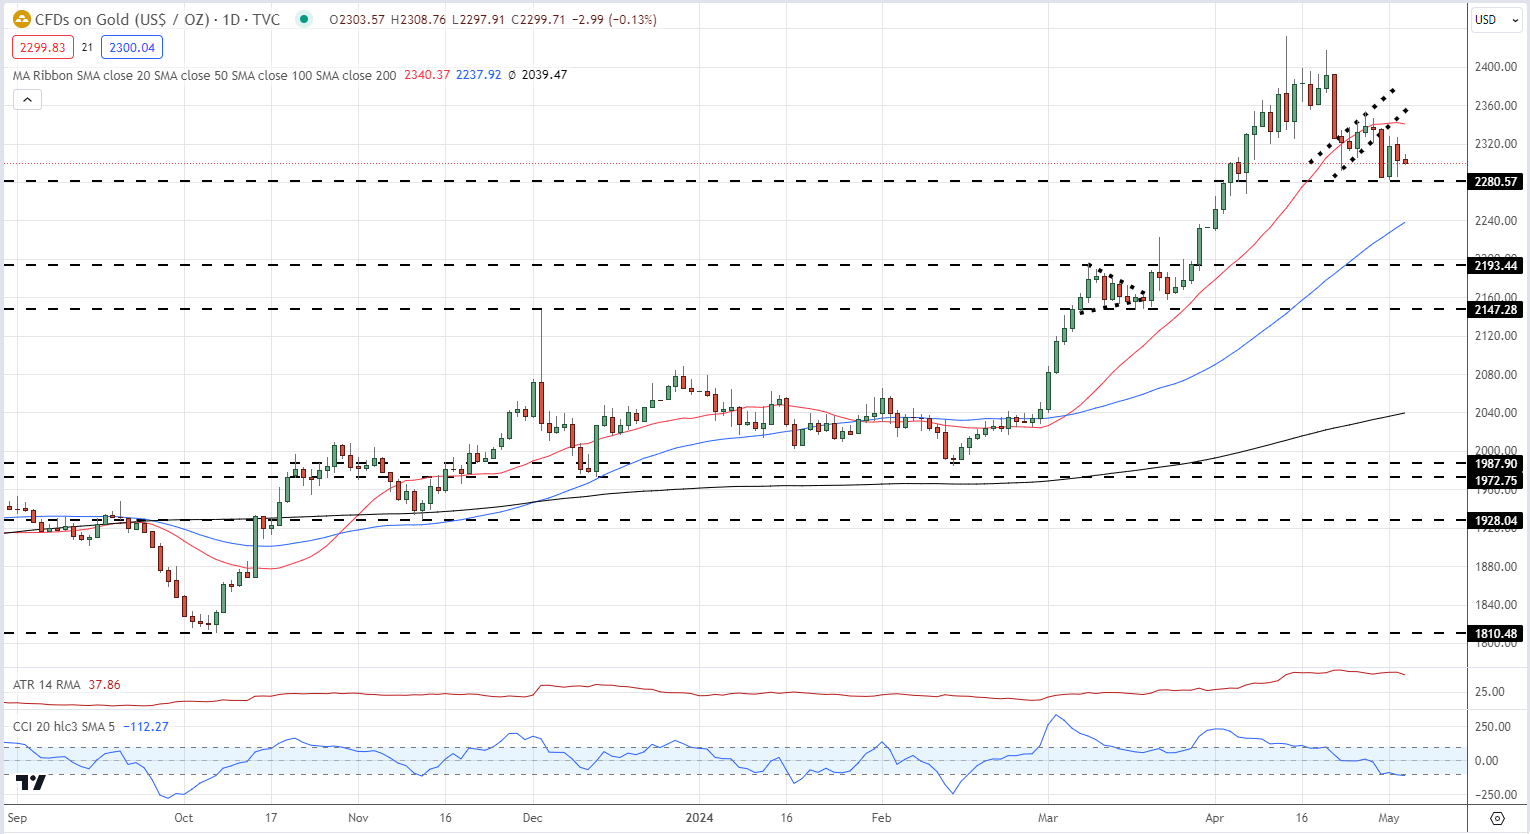
Gold is trading sideways in a small range today after this week’s break out from a bearish flag setup. The precious metal has tested support around $2,280/oz. on three occasions this week and a weaker-than-expected US Job Report or a further strengthening of the current risk-on move will see gold test this support again.

Gold Daily Price Chart

image5.png

IG Retail Sentiment show 55.89% of traders are net-long with the ratio of traders long to short at 1.27 to 1.The number of traders net-long is 5.87% higher than yesterday and 1.20% higher than last week, while the number of traders net-short is 2.14% lower than yesterday and 2.91% lower than last week.


How Forex Traders Use ISM Data

How Forex Traders Use ISM Data

The ISM manufacturing index plays an important role in forex trading, with ISM data influencing currency prices globally. As a result, the ISM manufacturing, construction and services indicators can provide unique opportunities for forex traders, which makes understanding this data (and how to prepare for its monthly release) essential.

What is ISM?

The Institute for Supply Management (ISM) measures the economic activity from both the manufacturing side as well as the service side. Monthly ISM data releases include key information such as changes in production levels.

ISM was formed in 1915 and is the first management institute in the world with members in 300 countries. The data gleaned from its large membership of purchasing managers means ISM is a reliable guide to global economic activity, and as a result, currency prices. A country’s economy is often determined by its supply chain, as a result, the monthly ISM manufacturing and non-manufacturing PMI economic news releases are carefully watched by forex traders around the world.

ISM Surveys

ISM publishes three surveys – manufacturing, construction, and services – on the first business day of every month. The ISM Purchasing Managers Index (PMI) is compiled from surveys of 400 manufacturing purchasing managers. These purchasing managers from different sectors represent five different fields:

  1. Inventories
  2. Employment
  3. Speed of supplier deliveries
  4. Production level
  5. New orders from customers.

In addition, ISM construction PMI is released on the second business day of the month, followed by services on the third business day. Forex traders will look to these releases to determine the risks at any given time in the market.

How does ISM Impact currencies?

The Manufacturing and Non-manufacturing PMIs are big market movers. When these reports are released at 10:30am ET, currencies can become very volatile. Since these economic releases are based on the previous month’s historical data gathered directly from industry professionals, forex traders can determine if the US economy is expanding or contracting – much like non-farm payrolls (NFP) data.

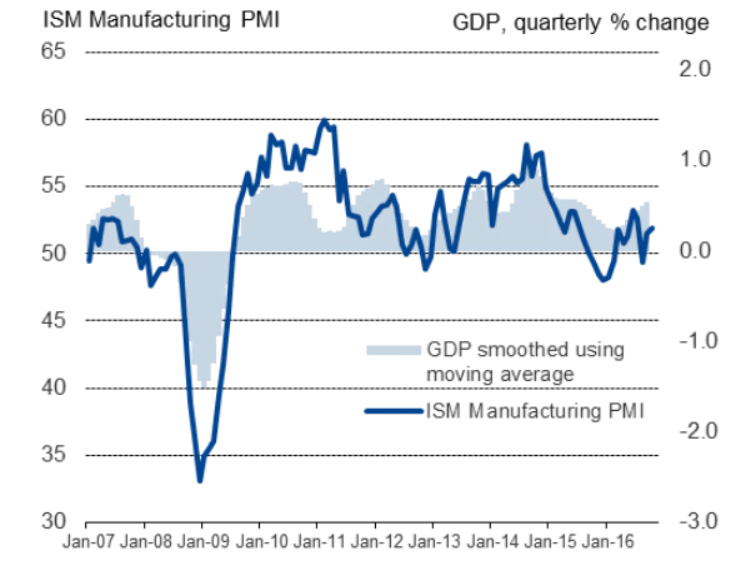
Currencies react with this information as it represents a gauge of US economic health (see image below).

ISM manufacturing PMI vs GDP

Source: Institute for Supply Management

How forex traders use ISM data

Forex traders will compare the previous month’s ISM data figure with the forecasted number that economists have published. If the released PMI number is better than the previous number and higher than the forecasted number, the US dollar tends to rally. This is where fundamental and technical analysis comes together to create a trade setup.

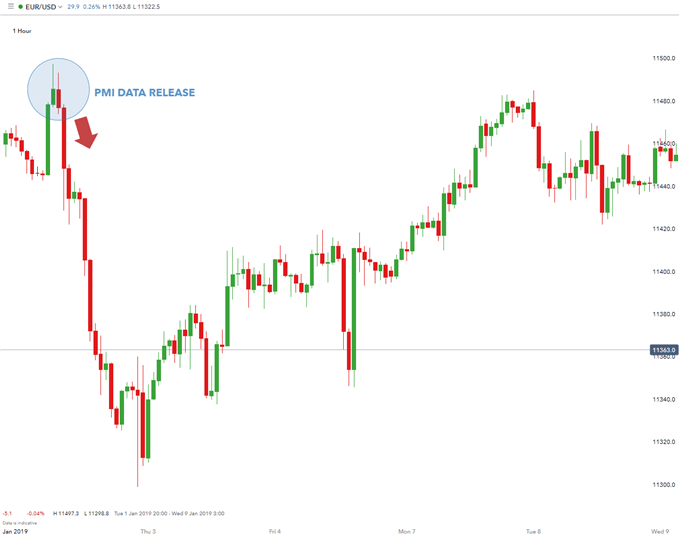
EUR/USD drops as a result of better than expected data

ism manufacturing index

In the example above, notice how the better than expected PMI number triggered a US dollar rally against the Euro. As seen in the chart (EUR/USD – one hour), the ISM Manufacturing PMI came in higher than the previous month at 54.9.

When an economic releases beats expectation, sharp fast moves can ensue. In this case, EUR/USD dropped 150 pips in a few hours. Traders often choose the Euro as the “anti-dollar” to take advantage of capital flows between two of the largest economies.

Read more on using pips in forex trading.

The Eurozone has large liquid capital markets which can absorb the huge waves of capital seeking refuge from the US. A weak US ISM Non-Manufacturing number usually leads to a dollar sell-off and a rise in the Euro. Another scenario is when the number released is in line with forecasts and/or unchanged from the previous month, then the US dollar may not react at all to the number.

Overall, an ISM PMI number above 50 indicates that the economy is expanding and is healthy. However, a number below 50 indicates that the economy is weak and contracting. This number is so important that if the PMI is below 50 for two consecutive months, an economy is considered in recession.

PMIs are also compiled for Euro zone countries by the Markit Group while US regional and national PMIs are compiled by ISM. As you can see, traders have good reason to pay special attention to the important releases from the ISM manufacturing index.

Interest Rates and the Forex Market

Interest Rates and the Forex Market

What are interest rates and why do they matter to forex traders?

When traders talk about ‘interest rates’ they are usually referring to central bank interest rates. Interest rates are of utmost importance to forex traders because when the expected rate of interest rates change, the currency generally follows with it. The central bank has several monetary policy tools it can use to influence the interest rate. The most common being:

  • Open market operations: The purchase and sale of securities in the market with the goal of influencing interest rates.
  • The discount rate: The rate charged to commercial banks and other depository institutions on loans they receive from their regional Federal Reserve Bank’s lending facility.

Central banks have two main tasks: to manage inflation and promote stability for their country’s exchange rate. They do this by changing interest rates and managing the nation’s money supply. When inflation is ticking upwards, above the central bank’s target, they will increase the central bank rate (using the policy tools) which can restrict the economy and bring inflation back in check.

The economic cycle and interest rates

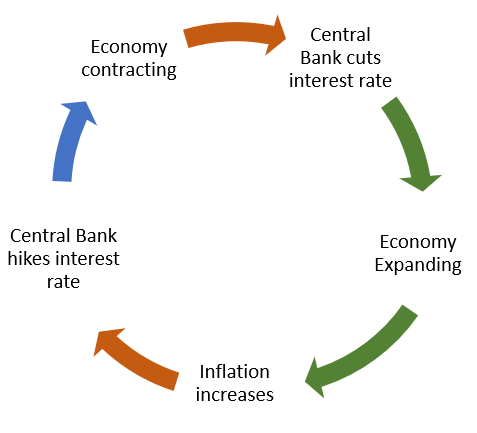
Economies are either expanding or contracting. When economies are expanding, everyone is better off, and when economies are contracting (recession) they are worse off. The central bank aims to keep inflation in check while allowing the economy to grow at a modest pace, all by managing the interest rate.

When economies are expanding (GDP Growth positive), consumers start to earn more. More earning leads to more spending, which leads to more money chasing fewer goods – triggering inflation. If inflation is left unchecked it can be disastrous, so the central bank attempts to keep inflation at its target level, which is 2% (for most central banks), by increasing interest rates. Increased interest rates make borrowing costlier and helps reduce spending and inflation.

If the economy is contracting (GDP growth negative), deflation (negative inflation) becomes a problem. The central bank lowers interest rates to spur spending and investment. Companies start to loan money at low interest rates to invest in projects, which increases employment, growth, and ultimately inflation.

The cycle goes something like this:

Flowchart showing economic rate cycle and impact on interest rates

How do interest rates affect currencies?

The way interest rates impact the forex markets is through a change in expectations of interest rates that lead to a change in demand for the currency. The table below displays the possible scenarios that come from a change in interest rate expectations:

Market expectations Actual Results Resulting FX Impact
Rate Hike Rate Hold Depreciation of currency
Rate Cut Rate Hold Appreciation of currency
Rate Hold Rate Hike Appreciation of currency
Rate Hold Rate Cut Depreciation of currency

Interest rate relevance to forex trading

Imagine you are an investor in the UK that needs to invest a large sum of money in a risk-free asset, like a government bond. Interest rates in the US are on the rise so you start to buy US Dollars to invest in the US government bonds.

You (being the UK investor) are not alone in investing in the country with higher interest rates. Many other investors follow the increase in yield and so increase the demand for US Dollars which appreciates the currency. This is the essence of how interest rates affect currencies. Traders can attempt to forecast changes in expectations of the interest rate which can have a large effect on the currency.

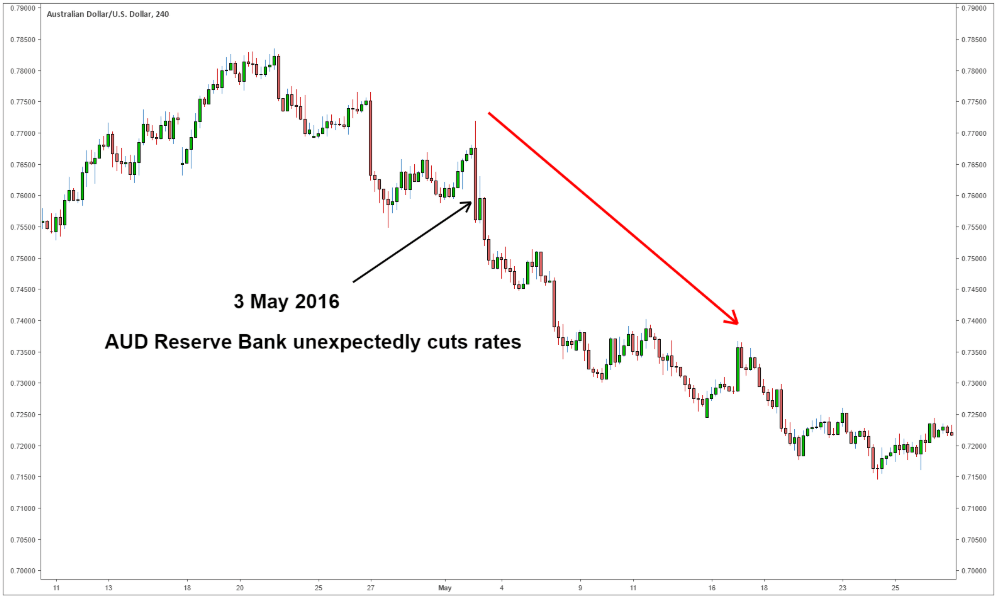
Here is an example of what happens when the market expects the central bank to keep interest rates on hold, but then central bank decreases the interest rate. In this example, the Reserve Bank of Australia was expected to keep interest rates on hold at 2% but instead cut it to 1.75%. The market was surprised by the rate cut so the AUD/USD depreciated.

Chart showing AUD/USD depreciation after Reserve Bank cut interest rates

Understanding forex interest rate differentials

Interest rate differentials are simply differences in interest rates between two countries.

If a trader expects the US to unexpectedly hike interest rates he/she anticipates the US dollar may appreciate. To increase the trader’s chances of success, the trader can buy the US Dollar against a currency with low interest rates as the two currencies are diverging in the direction of their respective interest rates.

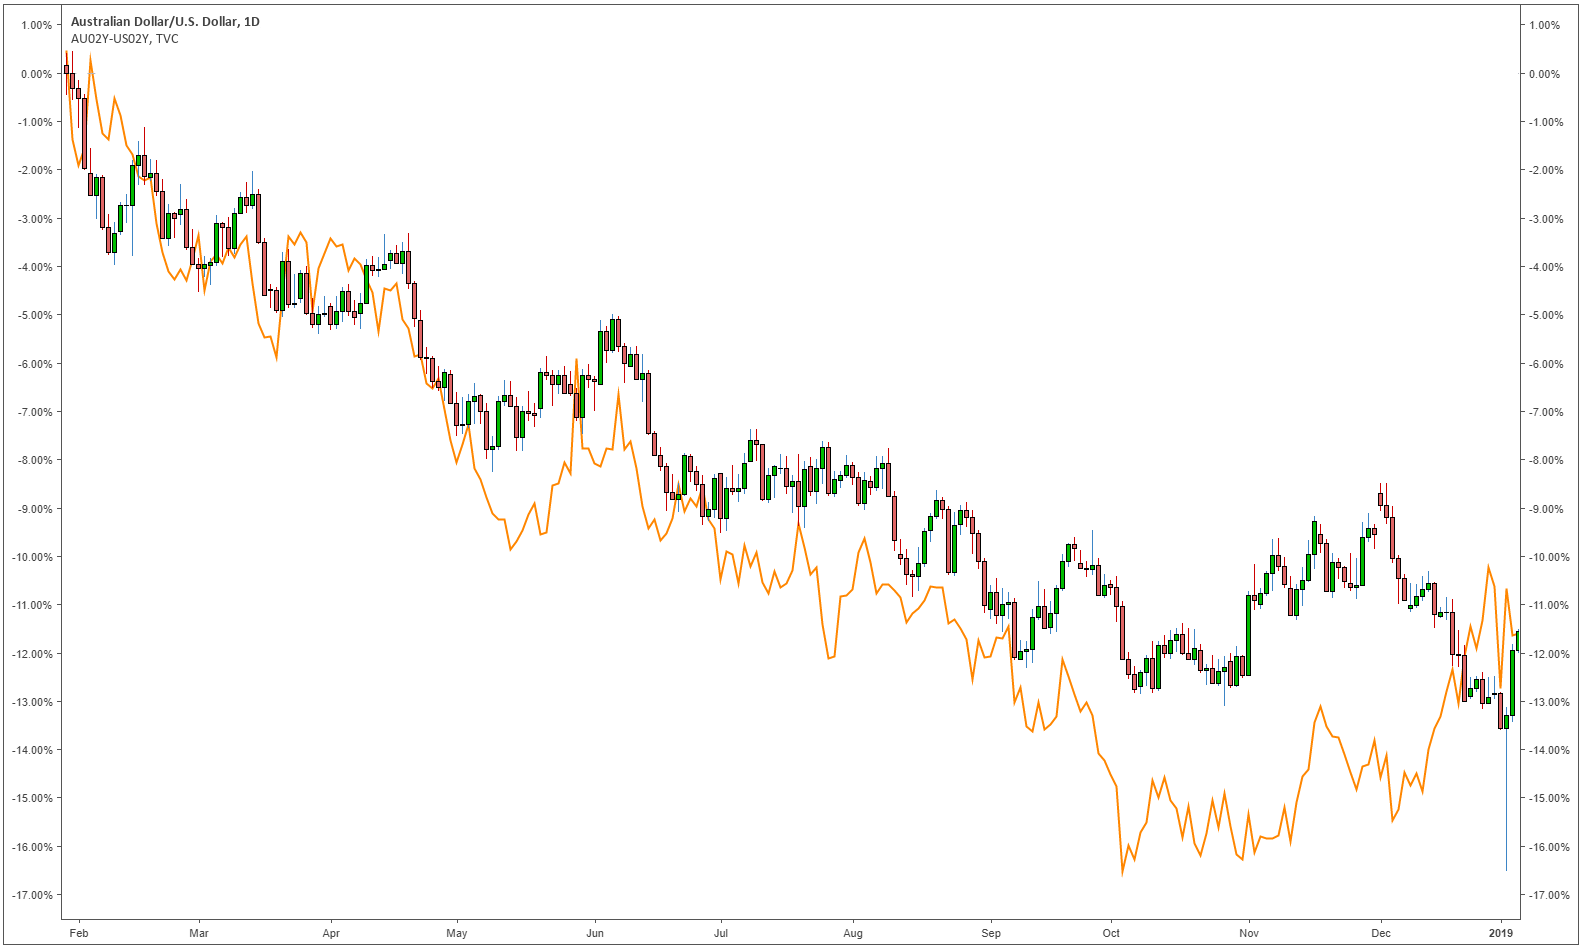
Interest rates and their differentials have a large influence on the appreciation/depreciation of the currency pair. The changes in interest rate differentials are correlated to the appreciation/depreciation of the currency pair. It is easier to understand visually. The chart below compares the AUD/USD currency pair (candlestick graph) and the difference between the two-year AUD government bonds and the two-year USD government bonds (orange graph). The relationship shows that as the AUD bonds yield decreases relative to the USD bonds, so does the currency.

AUD/USD compared with 2 year AUD/USD rate differential

Interest rate differentials are widely used in carry trades. In a carry trade money is loaned from a country with a low rate and invested in a country with a higher interest rate. There are, however, risks involved with the carry trade such as the currency invested in depreciating relative to the currency used for funding the trade.

How to forecast central bank rates and the impact on FX markets

Fed funds futures are contracts traded on the Chicago Mercantile Exchange (CME) that represent the markets expectations of where the daily official federal funds rate will be when the contract expires. The market always has its own forecast of where the interest rate will be. A trader’s job is to forecast a change in those expectations.

For a trader to forecast central bank rates he/she will need to keep a close eye on what the central bankers are currently monitoring. Central bankers try to be as transparent as possible to the public about when they expect to increase interest rates and which economic data they are currently monitoring.

The central bankers decide to increase or decrease interest rates based on several economic data points. You can keep up to date with the release of these data points using an economic calendar. Inflation, unemployment, and the exchange rate are some of the major data points. The trader must be in tune with the central bank policy makers and almost try to forecast what their actions will be before they state it to the public. This way the trader can reap the benefits of the markets change in expectations. This method of trading is based on the fundamentals which is different to trading using technical analysis. See our article on Technical vs Fundamental analysis to understand the different ways to analyze forex.