Stock types are an essential component to a stock trader’s investing basis. Traders and investors need to know the distinction between different stock types. Knowing stock types are so important because it allows traders to deduce and select the correct stock for their personal financial goals and risk appetite.
Thing to keep in mind with stock types
Because stock types and investor objectives are correlated, the following should be taken into consideration before selecting a stock type to trade:
Risk appetite – higher risk appetite will point toward a more volatile stock whilst a lower risk appetite will highlight more consistent stocks
Voting rights– Common stock
6 Different types of stocks every trader should know
Stocks are categorized under different labels which allow traders to sift through stocks with ease making for more efficient trading. Below are the major stock types most frequently utilized by stock traders.
Common stock and preferred stock:
There are two main types of stocks including common stock and preferred stock. Although there are many differences between the two, the primary difference is that preferred stock generally does not give shareholders voting rights whilst common stock does. Both types of stock signify a form of ownership within the company which investors believe will appreciate in value.
Stock type
Pros
Cons
Common stock
Voting rights
Benefits of stock appreciation
Lower dividends if accessible
Last in line to receive disbursements after creditors, bondholders and preferred stock holders
Stock price and dividend may encounter greater unpredictability
Preferred stock
Steady and predictable dividend payments
Benefits of stock appreciation
Higher dividends if accessible
Shareholders have higher probability to recover some of the initial investment in the case of bankruptcy
The descending triangle is a bearish pattern that is characterized by a descending upper trendline and a flat lower trendline that acts as support. This pattern indicates that sellers are more aggressive than buyers as price continues to make lower highs. The pattern completes itself when price breaks out of the triangle in the direction of the overall trend.
How to identify a Descending Triangle Pattern on Forex Charts
The descending triangle is fairly easy to spot once traders know what to look for. The below method can be applied to all financial markets as well as forex.
Downtrend: The market must be in a downtrend before the descending triangle pattern appears. This is important and emphasises that traders should not simply trade the pattern whenever the descending triangle appears.
Consolidation: The descending triangle then appears while the market enters the consolidation phase.
Upper trendline: While the market is consolidating, a downward sloping trendline can be drawn by connecting the highs. This downward sloping trendline shows that sellers are slowly pulling the price down – which provides further support for a bearish trading bias.
Lower trendline: The lower trendline acts as support. Price often approaches this level and bounces off until the breakout eventually occurs.
Trend continuation: After price posts a strong break below the lower trendline, traders will look for confirmation of the pattern via continued downward momentum.
Descending Triangle Measuring Technique
The descending triangle, often referred to as the ‘falling triangle’, has an inherent measuring technique that can be applied to the pattern to gauge likely take profit targets.
For the descending triangle,traders can measure the distance from the start of the pattern, at the highest point of the descending triangle to the flat support line. That same distance can be transposed later on, starting from the breakout point and ending at the potential take profit level.
The illustration below shows the distance from A to B can be transferred lower down, from C to D, in order to project a possible take profit level.
How to Trade the Descending Triangle
When trading the descending triangle, traders need to identify the downtrend and this can be seen in the EUR/USD chart below. Thereafter, the descending triangle appears as the forex candlesticks start to consolidate. The measuring technique can be applied once the triangle forms, as traders anticipate the breakout.
After viewing a strong break below support, traders can enter a short position, setting a stop at the recent swing high and take profit target in line with the measuring technique.
The breakout market condition is one of the more exciting backdrops because, by definition, something relatively ‘new’ is happening. It can also be a favored strategy amongst forex traders because it can allow for outsized moves that may last for an extended period of time; potentially plotting for a price breakout to develop into a new trend that may allow for
Fibonacci breakouts: Introduction
Fibonacci retracements are a popular tool to use when looking to exploit possible breakout opportunities. Identifying key levels inside of trends using Fibonacci retracements gives traders specific price zones to monitor for price breaks above or below. Implementing multiple time frame analysis can aid traders, bymagnifying long-term information in the effort of finding more granular accuracy in terms of possible entry points. This article will outline how Fibonacci retracements can be used to identify breakout opportunities and how other technical analysis techniques can beincorporated to compliment possible breakout decisions.
If you’re puzzled by trading losses, why not take a step in the right direction? Download our guide, “Traits of Successful Traders,” and gain valuable insights to steer clear of common pitfalls that can lead to costly errors.
How to Trade Range Breakouts with Fibonacci Retracements
The GBP/USD charts below exhibit a potential breakout opportunity using Fibonacci retracements. The first step as always when using the Fibonacci retracement is to locate the relevant high/low or vice versa and draw the Fibonacci retracement as seen on the weekly chart (red box, to the left of the chart). This represents a well-defined high to low. As evident from successive lower highs and lower lows price has tended towards a downward bias. This step is key as identifying the trend will aid in future trade decisions. Trend identification can be recognized in various ways such as price action (used below), oscillators and other technical indicators.
Notice how after the major move was in, price action went into a range-bound state; with fairly clear definition of resistance around the 76.4% retracement to go along with supports at 38.2 and 50% retracements. Once the longer-term picture has been drawn, traders can look to focus in on smaller time frame charts for more detail. The eight-hour chart focuses in on what happened after that major move. GBP/USD began to range for much of the four months after, with numerous inflections showing off of these Fibonacci retracement levels. But, by mid-July, towards the right side of the chart, buyers began to take control, witnessed by a pullback to and show of support around the 61.8% retracement (highlighted in blue).
At that point, buyers take-over and force a bullish breakout at the same 76.4% retracement that had previously held the highs (indicated by the green box). And after the breakout takes place, buyers continue to drive as a fresh short-term bullish trend has formed.
New to trading financial markets? Here’s a guide on how to build confidence. Download the free guide now!!
GBP/USD Eight-Hour Price Chart
Fibonacci Support/Resistance: To Break or Not to Break, that is the Question
For traders implementing strategy across markets, there are two primary ways of going about it. Traders can look for directional moves or they can look for mean reversion. With a trend trading strategy, traders are looking to harness the prevailing bias in looking for some element of continuation. Range traders, on the other hand, are looking to take the other side of the matter, looking to get short after a bullish move finds resistance or, on the opposing side, looking to get long after a bearish move brings in a level of support.
The transitory state between a range and a fresh trend is the breakout; when prices push out of the range and go into what could be a fresh trend that might continue. As such, speculating for breakouts can be dangerous because, by nature, the trader is expecting something different to happen as opposed to the status quo.
So key for such approaches are strong risk and trade management, along with an analytical framework that can produce support or resistance levels that can allow for the strategy to be properly implemented. Fibonacci can certainly help in that regards.
Fibonacci breakouts: Summary
Range breakouts can be complex to identify and analyze but implementing Fibonacci retracements can give traders a clearer picture of where support and resistance zones exist. In conjunction with other technical tools, traders can make educated trade decisions on Fibonacci breakout strategies.
Key steps to consider when employing a Fibonacci breakout strategy:
Correctly draw Fibonacci retracement using appropriate high/low and vice versa
Identify the preceding trend
Apply multiple time frame analysis with additional Fibonacci retracements
Locate range
Assess current market conditions
Look for possible breakout opportunities when price breaks above/below resistance/support in line with preceding trend
To quickly understand how the multi-timeframe strategy works, let’s look at the most popular option, the intraday trading strategy on 30M, 15M and 5M timeframes.
To determine the entry point into the market, you need to consider several charts and timeframes, and assess the market conditions from top to bottom. That is, from the largest time frame to the smallest.
Identifying trends and market entries will not take more than a few minutes. If the current trend is in the same direction on all three time frames, this is a good opportunity to open a trade. The most effective trades will be when the trend reverses, especially if all three charts confirm it.
Rule 1 – Determine Main Trend
First of all, identify the primary trend (developing over 2-3 days) on the highest of the time frames we are considering. Remember that only the long-term time frame shows the macro trend. Trading against the macrotrend is dangerous and often leads to losses.
Chart shows two main trends, downward and sideways. The downtrend is global and has been developing for a long time. Let’s study the sideways trend. The good thing about it is that it is easy to determine its borders (support and resistance lines). Traders should start trading from these lines.
So, the main trend is flat. The price is located at its upper border. In this situation, the price can either break out the resistance line and go up, breaking the trend, or reverse and continue the trend. It is the reversal that is most interesting, since it supports the current trend, which means such a trade is the safest.
Rule 2 – Determine Current Market Bias
Next, you need to determine the current trend. The next timeframe signals to us the medium-term bias. If the global one indicates a trend of 2-3 days, then the current one shows changes within the day.
The current trend on the lower time frame confirms the direction of the intraday movement. The chart shows a confirmation of a possible reversal at the resistance line. The price is attempting to exit the local sideways channel and has already crossed the lows of the daily trend. 30M and 15M timeframes are not very different from each other, and, as a rule, the color of the candles on them will be the same.
When trading on three timeframes, traders use a candlestick chart, which helps them quickly determine the trend by comparing the color of the last candles on different timeframes.
On M30 and M15, the last candles are black, which means the trend direction is the same. Thus, the M15 fully confirms the reversal trend from the larger time frame.
Rule 3 – Determine Entry and Exit
Once the current trend is confirmed, switch to short-term charts to identify good entry and exit points for the trade. A signal to enter the market will be the same colors of the last candles on all three timeframes, as well as a trend reversal. In our case, this is a breakout of the local channel support line.
It is better to enter a trade on the smallest time frame, since high time frames do not provide the necessary price accuracy. After receiving all confirmations, you can open a sell trade.
Determine the exact entry and exit points based on risk management rules. A sell trade can be opened immediately after the signal is confirmed, and it is better to exit the trade at the take profit level. In this situation, it is logical to set it around the support line of the global channel on the M30 timeframe. It is better to set the stop loss level above the resistance line of the global channel.
Trading 3 Timeframes in Forex Market
There are a lot of different strategies in modern technical analysis, and sometimes traders forget that the simplest ones are the most effective. Trading on three time frames is a powerful trading strategy that allows traders to make profits with minimal time investment.
Trading on three timeframes is divided into:
Long-term. The average trade duration exceeds a week or even a month.
Medium term. The trade duration ranges from several days to one week.
Short term. Traders open trades within shorter timeframes, without moving on to the next day.
The most popular time frame is the daily chart, as it allows traders to make trading decisions without haste. The higher the timeframe, the easier it is to focus on trading management. The more time you have, the greater the trade’s security. Also, all dominant trends are clearly visible on the daily chart.
When trading three time frames, use the three rules below:
Don’t trade against the global trend.
Enter trades only if all the last candles on three timeframes are the same color.
Do not open trades if there is high volatility in the market.
Best Timeframe Combinations
Now that you know how to use three timeframes in trading, let’s consider the combinations of timeframes that most traders commonly use.
The most popular is the combination of M30, M15 and M5. Statistically, this combination allows traders to maintain a good balance between the number of trades and profitability.
The second most popular is long-term trading on D1, 4-hour and H1 timeframes. This combination allows traders to ideally follow the rules of money management, but involves fewer trades over the period due to the duration exceeding a week.
Trading on H1, M30 and M15 is well-balanced in terms of trade duration and money management. This combination allows traders to open trades ranging from several hours to one day and effectively utilize risk management techniques such as trailing stops.
Use different combinations to find the perfect one for you. Sometimes, traders even use M1 in search of the best entry points. However, you cannot use too large gaps between timeframes in trading. There is a sufficient gap between M1 and D1 for the strategy to not work. I don’t recommend setting a gap of more than five candles between timeframes.
Indicators for Trading with Multiple Timeframes
Choosing the best timeframe combination is only part of future success. The main thing is to determine the exact entry and exit points. Above, we considered an example with an entry based on the theory of resistance and support. But the most popular method is indicator analysis. According to this method, traders can use technical indicators, from basic moving averages to complex oscillators such as RSI, CCI, and Stochastic.
The figure above shows trading on M30, M15, M5 time frames using the basic setup of three exponential moving averages (EMA). The principle of operation of such a strategy is described below:
Apply three Moving Average indicators with basic parameters and periods of 21,13 and 8 on three time frames. Mark the slowest in blue, the average in red, and the fastest in green.
Blue will be the signal one. After it is broken out by the other two, a trade will be opened.
Wait for two fast EMAs to cross the signal one on all three timeframes.
Crossing from top to bottom is a sell signal, and from bottom to top is a buy signal. In our case, this is a sell signal.
After receiving the signal, open a sell trade.
When there is a reverse cross on the M5 timeframe, close the trade.
First, let’s have a look at the definition of a stochastic oscillator.
A stochastic oscillator is a technical momentum indicator that compares an asset’s current prices with a range of its prices over a certain period of time.
The stochastic oscillator accounts these patterns in its calculations. In upward trends, the current closing price hovers at previous swing highs for some time. On the flip side, the price temporarily stays at previous swing lows during downward trends.
The indicator can be applied to any market when using the appropriate time frame and settings.
How Does the Stochastic Oscillator Work?
Classically, a stochastic oscillator as a technical analysis tool is represented by two moving curves that move between two levels. Usually, these are 80% and 20%.
The solid orange line in the image above is called %K, and the blue line is the 3-period moving average of the %K curve.
When two lines are above the upper level of 80% (marked with blue zones at the top), the instrument is overbought. When they fall below the bottom horizontal line of 20% (red zones in the bottom), it’s oversold. This is how the user can easily spot the overbought and oversold levels of the market.
Line crosses have a special meaning. If it happens in the overbought zone, it’s a signal of a short position. If it is in the oversold area, you should open a long trade to avoid losing money rapidly.
Nevertheless, it’s not recommended to trade using only the stochastic oscillator as a momentum indicator. In the simplest stochastic oscillator strategy, signals are filtered by the trend direction. For instance, if a downtrend prevails, open only short positions. If there is an upward trend, place long trades. Combining a stochastic indicator with other trading tools can help the user to spot easier overbought and oversold conditions.
Thus, if we analyze the overbought and oversold levels of the EURUSD chart, we can spot a bearish trend. That’s why we look for a point to open a short trade in overbought zones. The stochastic oscillator presents a potential entry point where the red oval is. As there is a crossover of the indicator lines above 80%, a short-term correction should end, and the downtrend will continue pushing the oversold levels lower.
Stochastic Momentum Index (SMI) Explained
In addition to the classic stochastic indicator, a modified version called the Stochastic Momentum Index indicator, or SMI, is widely used. It is also considered a very efficient technical analysis tool that combines the aforementioned tool with momentum, which provides smoother signals and is less dependent on market noise.
In SMI, curves are built around a zero line and move in either a positive or negative direction. One of the curves is called smoothed or fast; another one is short-term. As you can guess, these lines differ by period.
Some of the stochastic momentum indicator’s pros are its reliable entry and exit signals when the market is flat. Still, even in such a case, it’s worth using the SMI with other technical tools. As for the directional movement, the SMI uses the last closing price and provides plenty of fake signals.
You can download the Stochastic Momentum Index here.
The standard installation process is via MetaTrader 4. For beginner traders, check the step-by-step explanation using the example of the Bollinger Bands indicator here.
Install and run the stochastic indicator. In the “Input parameters” tab, you can change parameters such as:
«Period_Q» – a period of the algorithm’s primary curve;
«Period_R» – primary smoothing of the main line;
«Period_S» – secondary smoothing of the main line;
«Signal» – the parameter responsible for the smoothing of the secondary signal curve.
If both the main and signal curves (the green and red lines on the chart above) are above the zero line (blue), the market is overbought; if below, the market is oversold. This way the user can always have a better understanding of the overbought and oversold levels of the market.
A sell signal is formed when the main momentum indicator line crosses the signal line upside-down.
On the chart above, the red arrow marks this moment. If the stochastic indicator breaks the signal line bottom-up (green arrow), open a long position. A stop-loss can be placed slightly below swing highs within several candles from the entry point. Close the position at either a take profit level, which is 2-3 times bigger than stop-loss, or when a reversal signal occurs in order to avoid losing money rapidly.
Best Settings for Stochastic Oscillator
Let’s dig deeper into how the indicator works to get the best settings for it. Traders use the following stochastic types:
the fast stochastic oscillator includes two lines: the solid main line %K and the dashed signal line %D;
the slow stochastic oscillator is less volatile, showing less market noise. It replaces the %K line with the %D line and the %D line with a three-day moving average equal to %D. If you set the smoothing period to 1, you will plot the fast stochastic oscillator.
The stochastic oscillator includes three parameters:
%K period;
%D period;
smoothing period.
The default settings in MetaTrader and most other trading platforms are 5.3.3. For day trading, these are the best indicator settings, providing optimal sensitivity and noise level.
The chart above shows the indicator with default settings 5.3.3. As can be seen on the chart, the indicator with such parameters generates a lot of overbought and oversold signals, and its lines are not smooth enough, which indicates excessive volatility.
To analyze volatile charts, traders prefer to use stochastic oscillators with settings 8.3.3 or even 14.3.3, which give fewer false signals.
The stochastic oscillator with settings 14.3.3 is added to the EURUSD chart. Unlike the previous example, the indicator’s lines are smoother. The algorithm takes into account a wider price range over time, which means that reversal signals appear less often, generating fewer false signals.
If we consider the indicator’s general settings, we can draw a simple conclusion: Higher values make the stochastic oscillator less sensitive to market noise, and low values make it over-sensitive. In this regard, the frequency of signal occurrence changes.
The picture above shows an example of using the stochastic oscillator with periods 3.3.1, which excludes smoothing. With such settings, the indicator line changes direction along with the price. This means that it reacts to the slightest price movements.
Traders should tune their stochastic oscillator for the markets they trade in, considering time frames and preferred trading styles. Ready-made trading strategies with stochastic oscillators usually include recommendations for indicator settings.
It is possible to use the tool with other technical indicators such as MACD, RSI, or ADR. When used together, the settings of the used indicators can be adjusted depending on the trader’s goals, chosen stochastic oscillator’s settings, and the trading strategy.
Stochastic Indicator Calculation & Formula
Let’s consider the stochastic oscillator’s formula.
%K is calculated as follows:
Where:
max (Hn) – a top within an n period;
min (Ln) – a low within an n period;
C0 – a close price of the current candlestick.
Here’s an example of the Stochastic’s formula that uses three periods.
On the chart, the bar with which we calculate the stochastic indicator is marked with green. The close price is 1,17972. The green line highlights the highest price for the last three candles – 1,17994. The red line marks the lowest price of the previous three candles, which is 1,17948.
This is how traders used to calculate stochastic readings and used to define the highest and lowest prices. Nowadays, it seems extremely inconvenient.
Alternatively, you can use an automated stochastic indicator, which is integrated into the LiteFinance online platform, MetaTrader 4, or download the stochastic oscillator as an Excel calculator here. The principle of how this calculator works is straightforward. It is like the Excel Bollinger Bands Table (the link to the explained instructions is here).
Stochastic Indicator Interpretation: Reading the Charts
When using the stochastic indicator on Forex trading, there are many signals, including the overbought and oversold levels of the market. That’s why this momentum indicator is often used with other indicators for more accurate signals. In the following sections, we will explain the specifics of the stochastic oscillator signal types, methods of interpretation, and detection.
Fast, Slow & Full Indicators
How do you set the stochastic indicator? Usually, the parameters are defined by three meanings. One for each % K, % D, and smoothing coefficient. 5, 3, 3 is one of the classic combinations.
Where:
5 is a period of %K- the leading stochastic curve. As you might remember, we have already broken down how to calculate this parameter. The stochastic formula looks like this:
The value 5 means that maximums and minimums will be calculated for the last five candles. In the stochastic indicator’s formula, this parameter is presented by n.
3 reflects the period of %D, a so-called signal line. It’s a simple moving average built on the final parameters of %K.
3 is the last parameter of the slow stochastic oscillator. It’s used to smooth the %K curve, making it more flowing without market noise. In other words, initial %K is calculated with an averaging coefficient.
In such a case, the formula for %K is as follows:
The %D curve will be built on the average value of %K. In fact, it will be double smoothed. Such an effect allows you to filter noise and reduce the number of fake signals, but it also increases the stochastic oscillator’s lag. That’s why it’s called slow.
If you don’t want to use smoothing, you should use 1 as the last parameter. Such stochastic indicators are called fast.
The full version of the stochastic oscillator allows you to change all three parameters and even how %D stochastic is smoothed.
LiteFinance gives you the chance to experiment with a free demo account, but also provides the full version of the indicator. But if I could, I would call it Super Full Platform provides such comprehensive settings.
LiteFinance supports four types of smoothing the stochastic oscillator:
Simple is classic smoothing and uses a simple moving average (SMA);
Exponential smooths using an exponential moving average (EMA);
Linear Weighted smooths using Linear Weighted Moving Average (LWMA);
Smoothed is double smoothing due to the feature of the Smoothed MA (Smoothed MA).
Such functions allow the user to make use of the stochastic oscillator formula in any trading tool and market, in order to spot easily the highest and lowest prices of the market when trading cfds, currency pairs, etc. There are no strict rules on what smooth settings to use with this momentum indicator, but it’s vital to consider their differences for successful trading experiments.
Let’s visually compare how they differ.
In the case we trade forex, like the price chart above, the numbers can correspond to five signals of the stochastic oscillator.
It’s clear that the second and fourth signals are fake. The first and fifth ones reflect the local correction. The most valuable signal is the third one, which indicates a trend reversal, in some points protects the trader from losing money rapidly.
Note! Here, the signals are a cross of %K and %D lines above 80% and below 20%. Later, we will talk about momentum indicator signals in detail. Now, it should be remembered as a condition for the experiment.
On the chart above, the stochastic oscillator takes various forms such as:
Fast;
Slow with an SMA;
Slow with an EMA;
Slow with an LWMA;
Slow with a Smoothed MA.
Periods for all stochastics are similar: %K – 5, %D – 3. A smoothing period for all types except fast stochastic is 3.
Conclusions:
A fast stochastic oscillator is a momentum indicator that reacts to the market movements faster than other types. It operates almost without a delay, but the number of fake signals is large leading investors on losing money rapidly.
Using a slow stochastic oscillator with SMA and LWMA is almost identical regarding the lag and number of fake signals.
The filter of the slow stochastic indicator with Smoothed MA was too strong and suppressed almost all signals. It provided only the last alert out of five.
The most effective slow stochastic was the one with smoothing EMA. This indicator successfully filtered fake signals and was slightly faster compared to its counterparts.
We tested the signals on the M30 chart of the EURUSD pair. Still, results may vary on other timeframes and trading instruments. You can compare any type of stochastic indicator using a free demo account right now on LiteFinance in several clicks without registering.
Timeframes also play an important role. The best stochastic oscillator settings for М5, М15, М30, and, sometimes, H1 timeframes are (10,7,3), (7, 3, 3), or (5, 3, 3). On high timeframes, such parameters may generate false signals. Therefore, stochastic oscillator settings for H4, D1, and, sometimes, H1 charts are (9, 3, 3), (14, 3, 3) or (21, 3, 3).
You can use slower curves with (21, 7, 7) or (21, 14, 14) settings for daily and weekly charts. The described setting combinations are used most often. You can practice and pick up your own parameters. Maybe you will succeed and find a perfect combination for your stochastic strategy.
Crossovers
The crossover between the %К and %D curves is the leading signal of the stochastic oscillator tool. It’s analyzed only in overbought and oversold zones analyzing the current closing price. In other cases, such signs are useless.
There are two types of crossovers:
When the %K line curve breaks above the %D line, the trend is bullish. In this case, it’s worth placing a pending order slightly above the cross point.
When the %K curve crosses the %D line upside-down, strong sell signals are monitored meaning that a bearish trend begins. A short position should be open slightly below the breakout point.
Below I will show how to use the stochastic oscillator by spotting the overbought and oversold conditions on the EURUSD chart.
Above the green oval, you can see an upward cross of %K and %D lines. Since the signal occurred below 20%, the risk of it being false is low. Here, it’s worth opening a long trade near the highest point of the crossover candlestick. On the chart above where the lowest prices are, I marked the entry level with a green line.
Here, we observe the opposite situation. A %K line curve crosses the %D one downwards at a price range, slightly above 80%. Therefore, analyzing the behavior of the stochastic lines, we can open a short position near the close price of the candlestick where the cross happened.
At the same time, a small shift down is acceptable. In the chart above, this situation is marked with a red oval.
Overbought & Oversold
The stochastic oscillator can help the user to have a better understanding of the overbought and oversold conditions of the market. The overbought issue occurs within an uptrend when the main line crosses the 80% level in an upward direction. It’s a sign that the rise slows down, and the price trend reverses down. Generally, a sell position should be open when the line breaks the 80% level back from the top, where the last closing price is, and follows the downward direction.
Oversold conditions happen in the downtrend when the line falls below the 20% level. In a similar fashion, it signals a slowdown of the price decline and that there is about to be a reversal. It’s recommended to buy when the curve exits the oversold area crossing the 20% line bottom-up.
When analyzing the indicator’s behavior in overbought or oversold zones, it’s worth considering the reversal’s formation in order to spot a potential buy or sell signal. If the primary curve forms an acute angle, the following price movement will be intense. If the repeated break occurs after flat conditions, the move will likely be weaker but stable.
Using the stochastic oscillator on the chart, blue squares indicate overbought areas; red ones mark oversold zones. In all three cases, those major signals show that the price tends finally to be reversed. The right blue square displays a sharp turn. It corresponds with the area on the graph marked with a blue oval. After the reversal, there is an intensive downward movement showing a potential sell signal, offering to the trader the chance to understand how spread bets.
Bull & Bear Divergences
When applying the stochastic oscillator on a chart, divergence occurs rarely, but its signals are highly accurate.
For instance,
Bearish divergence: When a price tend hits maximums, but the stochastic lines of %K and %D can’t overcome the previously highest prices(marked with the blue line) on the overbought or oversold region, it means there will likely be a reversal in the downward direction soon and works as a sell signal. Thus, we can open a short position after the indicator’s moving averages cross and the signal candlestick closes. In that situation a bearish divergence occurs.
When the market price falls, but %К and %D curves don’t reach previous lowest prices (marked with red lines), it’s a sign of the upward reversal. We can open a buy trade after the cross and closure of the signal candlestick. When this phenomenon we say that a bullish divergence occurs.
A rough change that occurs either on the overbought or oversold levels is known as stochastic divergence. Entry signals are marked with black circles.
Based on the text above, you can recognize the bearish divergence from a bullish divergence, in the overbought or oversold region. If you aren’t sure yet, you should read the article “What the divergence on Forex is” where the issue is explained in detail.
Ignore the fact that there is a different indicator in the article. The stochastic oscillator follows the classic rules of the technical analysis for bullish and bearish divergence and convergence. Everything you read in this article will work for the stochastic in order to monitor efficiently the price movement of our asset as well as to have a better understanding of when a bullish or bearish divergence occurs.
Bull & Bear Set-ups
Bullish and bearish patterns look the same as the stochastic divergences we covered above, but they provide different signals:
A bullish pattern is adjusted when the new highest price forms a lower-than-previous high, but the stochastic has a higher high than the last closing price. It leads to a short-term price trend decline and a reversal. So, this pattern should be used as a bullish entry point ahead of the upcoming rise.
A bearish pattern occurs when the new lowest price has higher lows, but the oscillator forms a lower minimum, indicating strong sell signals. Such types of price movement can be considered false signals since, later, the price will rebound and reverse.
Circles and violet lines mark swing highs on the price chart and the stochastic indicator. This means the formation of a bullish pattern that outruns the reversal signal. There is a short-term price decline (red area) where a trader can monitor how the spread bets, a price reversal, and a new bullish trend (green area).
Stochastic Oscillator: Best Trading Strategies and Real-Life Examples
Applying a trading strategy is essential for making a profit from trading on Forex. Even if you understand the price chart perfectly with the help of a stochastic oscillator, you may still suffer losses from Forex trading due to a wrongly chosen market entry point or a poor risk management and incorrect transaction volume. The given trading strategies with stochastic oscillators take into account all the intricacies that traders face in real trading.
The stochastic indicator allows you to receive many different signals. It can be used in different types of trading such as scalping, day trading, and swing trading. Read on to find out about the peculiarities of using the stochastic oscillator on different time frames.
Scalping
Scalping is a type of high-frequency trading. It is popular among algorithmic traders who use trading bots.
This strategy is usually used with lower time frames from M5 to tick charts.
Scalping is similar to the stochastic crossing strategy. The only differences are the time frame and the setting of parameters that make the indicator more sensitive and faster.
Let’s use an M5 time frame and the following stochastic parameters to implement the scalping strategy:
%K period 10;
%D period 7;
smoothing period 3.
Key levels to apply this strategy are 30 and 70.
We can open a long trade if the following conditions are met:
The lines are located on the 30% threshold or below;
%K crosses %D from below.
Conditions for opening a short position:
the lines are located on the 70% boundary or higher;
%K crosses %D from above.
Stop Loss is placed at 3-5 previous candle’s swing low. Take Profit is set at the same distance between your entry point and Stop Loss or exceeds this distance by 5-10 points. It is recommended to trade with small fixed lots.
Examples of Long/Short Trades
You can enter into short trades when the indicator is in the overbought zone and the main line crosses the signal line from above. The right signal is marked with a blue circle on the indicator’s chart. Open a short position after the red candle closes (blue horizontal line). Place your Stop Loss just above the next swing high (red horizontal line). You can take profits upon receiving a reversal signal when the blue main line %K crosses the red signal line %D from below in the oversold zone (green circle).
When the indicator’s main line crosses the signal line in the zone below 30, you can enter into long trades. On the indicator’s chart, the buy signal is marked with a blue circle. The market entry point is marked with a blue horizontal line. Stop Loss should be set near the previous low (red horizontal line). You can close the trade and take profits after the stochastic oscillator generates a reversal signal (green circle).
Day trading strategy
Day trading assumes opening and closing trades within one trading day. It is better to use H1 or lower time frames. For example, you can pick M30. For this time frame, use a sensitive stochastic indicator with settings 5.3.3 and a slower one with settings 21.7.7 to identify the general trend.
Firstly, use a slow stochastic oscillator to identify the general trend. If the main line %K moves below from the upper area, the trend is bearish. On the contrary, if it moves from the below to the top, the trend is bullish. Depending on which zone the line is moving in, you can understand the life cycle of the trend. For example, if the line is starting to decline in the upper area of the indicator’s chart, it means that a bearish trend is emerging.
Market entry rules:
open trades according to the trend’s direction, identified by the slow indicator;
open short trades when the fast stochastic is located in the overbought zone and the main line %K crosses the signal line %D from above. Enter into long trades when the fast indicator is found in the oversold zone and the main line %K crosses the signal line %D from below.
Market exit rules:
set Stop Loss below a swing low for a long trade or above a swing high for a short trade, considering the previous 3 or 4 candles;
while the price moves in a favorable direction, replace your Stop Loss to a breakeven point;
lock in the profit when the opposite signal to the one we entered the market with appears. For example, if a long trade was opened, the signal to close it will be the crossing of the indicator lines in the overbought zone.
Examples of Long/Short Trades
On the chart, let’s use the slow stochastic oscillator to determine the general direction. The indicator is moving up toward the overbought zone. Therefore, the trend is bullish.
When the indicator forms a golden cross in the oversold zone, this is a perfect time to open a long trade (blue circle). Enter the market in the area of the blue horizontal line and set Stop Loss just below the low. Close your position once you get a reversal signal (green circle).
Now, let’s see what happens when it comes to short trades.
The chart shows a bearish trend confirmed by the stochastic oscillator tuned to the mid-range 21.7.7 setting.
Within this trend, when the indicator lines cross in the overbought zone, open a short trade with Stop Loss just above the previous high. There is also a false crossover. Since an intersection of the lines occurs on the border of the oversold zone, not inside it, we can ignore this false crossover. The closing signal appears in the area of the green circle. Take profit on the close of the corresponding candle.
50-level crossing strategy
This strategy implies that a trader ignores the 20 and 80 levels. Instead, they only pay attention to the 50 level. Let’s readjust the stochastic oscillator to make it visually easier to apply this trading strategy.
This strategy requires one line, so if there is an opportunity to turn off the moving average %D, it is better to do it so that it does not hamper the overall picture. In addition, we mark the 50 level instead of levels 20 and 80.
The image above shows a readjusted stochastic oscillator.
How to trade using this strategy:
enter the market when the buy/sell pressure causes the indicator to break through the 50 level. Open a long trade when the stochastic oscillator line crosses the 50 level from below. A breakthrough of the 50 level from above allows you to open short trades;
place Stop Loss orders according to the standard rule just below the nearest swing low or above the swing high;
exit from the market when the trend loses its strength, the indicator chart reverses and crosses the 50-level threshold in the opposite direction;
this trading strategy is versatile and can be applied to any time frame and trading style.
On the GPBUSD chart, an emerging bullish trend drives the indicator to break the 50 level from below (blue circle). As soon as it generates a signal, open a long trade at the level of the blue line. Stop Loss is marked by the red line. The subsequent short-term pullback returns the indicator to the 50 level. However, there is no inverse crossover and we keep the trade open.
A little later, the indicator line breaks through the 50 level (green circle). At this point, the price has already risen significantly and we can take profits at the level of the green line.
Swing Trading
The strategy’s name best describes the principle of swing trading. According to this strategy, traders must first determine the long-term trend. Swing traders always follow the main trend but do not trade the trend itself but the waves within it.
To understand the stochastic swing strategy, we should learn the star pattern. There are two types.
The morning star consists of three consecutive bars:
The first one is bearish with a long body;
The second one forms with a gap (ideally) with a bottom shadow and a short body;
The third one is bullish, with a long green body that overcomes the most significant part of the first candle’s body.
The opposite is the evening star. It includes three bars:
The first one is bullish with a long green body;
The second one has a short body and a gap up (ideally);
The third one is bearish, with a long red body covering the most significant part of the first candlestick.
Conditions for opening a long position:
Stochastic is below the 20 level;
There is a morning star pattern at the reversal;
The market starts moving upward.
Conditions for opening a short position by a swing trader:
Stochastic is above the 80 level;
There is an evening star pattern at a reversal;
The market starts moving down.
We should open a trade as soon as the bar after the pattern crosses its extreme in the trend direction. The stop-loss is set at the maximum point of the star. We will close the position as soon as there is a cross of stochastic lines, either above 80% or below 20%.
To improve the accuracy of signals, you can also use additional indicators. For example, RSI, which is not as fast as the stochastic oscillator, but provides fewer false signals.
Examples of Long/Short Trades
Let’s consider a long and short setup in the market using a real example of swing trading.
The chart depicts the formation of an evening star pattern with simultaneous crossing of the indicator lines in the overbought zone (blue circle) for the fast stochastic 5.3.3. These are ideal conditions for a short setup.
We opened a trade at 1.37637, when the bar crossed the pattern’s minimum point (the blue line). A signal to exit the market was a curve cross marked with the red circle. We fixed the profit at 1.34695, the close of the candlestick. The final profit was 2942 points.
Let’s consider a long setup using the example of a positional trade on the EURUSD daily timeframe using stochastic with settings 21.3.3. The chart above shows a golden cross in the oversold zone of the indicator, which is confirmed by the morning star pattern. At the level of its formation, enter purchases with a stop below the swing low. Take profit when a death cross forms in the overbought zone.
Using a Stochastic Oscillator When Trading S&P 500 and U.S. Dollar
Each instrument shows its own behavior. It’s crucial to consider it when trading. Below, we’ll look at stochastic trading features on the S&P 500 futures, gold, and the U.S. dollar.
S&P 500 Trading
Looking at this instrument’s historical price movements, it’s visible that the price decline doesn’t always follow a stochastic move to the overbought area. Vice versa, when the indicator is in the oversold zone, it’s more likely the market will rise soon.
The signals of a bullish reversal work well when the market is temporarily oversold in the uptrend. Signs of a bullish correction will likely work if the market entered an overbought area in the downtrend.
Gold Trading
When trading gold, it’s not recommended to use overbought/oversold signals even with a line crossing.
When the market is temporarily oversold in the uptrend, signals on a bullish reversal usually don’t work. Meanwhile, it’s likely a bearish reversal works when the market is temporarily overbought in a downtrend.
U.S. Dollar Trading
The U.S. dollar often continues moving following the momentum when curves enter overbought or oversold zones. Therefore, you should enter the market when there is a price reversal. The stochastic Forex strategy isn’t useful for USD if it’s based on fixing overbought conditions during an uptrend and oversold ones during a downtrend.
Combining a Stochastic Oscillator With Other Indicators
The stochastic oscillator is a high-frequency indicator that can generate false signals, especially in strong directional movements. It makes sense to use the oscillator with other trend indicators. Let’s consider the most popular combinations using any type of stochastic oscillator with other tools, such as the stochastic RSI.
Moving Averages
This is one of the simplest trend strategies that allow traders to get good results. To define a long-term trend, we will use the daily timeframe, while entry and exit points will be determined on the hourly one.
First, we add three exponential moving averages with periods of 50-, 100-, and 200-bars.
We use a stochastic oscillator to find the entry levels. The recommended settings are:
Periods: 14, 3, and 3;
Levels: 90% and 10%.
Conditions for a long trade:
There is a long-term upward trend on the daily chart; the price moves up and is above the EMA (50), while the EMA (50) is above EMA (100), which, in turn, is above EMA (200).
On the hourly chart, the oscillator crosses 10%.
Conditions for a short trade:
There is a long-term downward trend on the daily chart; the price moves down and is below the EMA (50), while the EMA (50) is below EMA (100). And EMA (100) is below EMA (200).
On the hourly chart, the oscillator crosses 90%.
Place the stop-loss slightly below the local extreme. Profit can be fixed by a take profit that is two times bigger than the stop-loss or by a trailing stop of EMA (50). If the most recent closing price is below it, you should fix profit.
In another version of the stochastic strategy on Forex, you should wait for the stochastic to enter overbought or oversold areas to fix profit. To make it clear, look at the example below.
We observe a long-term uptrend on the daily chart. Therefore, we will only open long trades while we monitor the most recent closing price.
With the hourly time frame, we wait until the curves cross 10% (the blue circle).
We enter the market at the close of the breakout bar where the lowest price is located (the blue line). A stop-loss is placed slightly below the minimum (the red line).
During the price movement, the stop-loss first moves to the breakeven and then to the profitable zone. We close the trade when the stochastic indicator comes closer to the 90% line where we compare it with the most recent closing price(the green line).
Trendlines
All trend strategies are used to open positions in the current trend or fix profit when the trend changes. Still, an entry point is considered a weak spot. A stochastic oscillator can solve this issue. A combination of a stochastic oscillator with any trend indicator can provide good results and avoid false signals.
In this regard, it’s essential to follow several rules:
Determine a trend on high timeframes;
Don’t open trades against the trend;
Use a %K and %D cross in the overbought/oversold areas to define an entry point.
Try to use a stochastic oscillator with your favorite trend indicator. Follow these three simple rules, and you will be surprised by the result.
Bollinger Bands
The Bollinger Bands indicator is the leading tool in this strategy, while the stochastic oscillator will be used as a signal filter. You can read more about them in my article “Bollinger Bands Indicator in Forex”.
Note! This strategy is intra-channel. The trade occurs within Bollinger Bands. The indicator settings are standard: the moving average period is 20 candles, and the standard deviation multiplier is 2.
We should also add a stochastic oscillator with 5, 3, and 3 parameters.
Conditions for a buy trade:
A bar crosses (or at least touches) the bottom line of the Bollinger Bands;
The %K line crosses the %D line bottom-up below 20%.
We can enter the market at the opening of the next candle after the signaling one.
Conditions for a sell trade:
A bar crosses or at least touches the upper boundary of the Bollinger Bands;
The %K line crosses the %D line upside-down above 80%.
Enter the market at an opening of the candle that follows the signal one.
A stop-loss is set with a small shift from the extreme point of the breakout bar. The ideal take profit level is at the opposite band of the Bollinger indicator. When working with a buy trade, it should be placed at the upper boundary, during a sell trade – at the bottom band.
Let’s take a look at the strategy of Bollinger bands and stochastic oscillators through an example.
The blue circle points to the moment when the bar touches the bottom line. In the same area, the %K crosses %D from the bottom, thus, confirming the primary signal.
We enter the market at the opening of the next candle (the blue line) at 1.17444. The stop-loss is set slightly below the minimum of the touch candle, and the take profit is at the upper boundary – 1.17808.
In a while, the price declines, almost touching the stop-loss level, but it turns around and surges. The trade is closed at the take profit level (the red circle). The final profit is 364 points (1.17808 – 1.17444 = 0.00364).
Pros & Cons of the Stochastic Indicator
Like any tool in technical analysis, the stochastic oscillator has several advantages and disadvantages.
cam on the Forex market is defined as targeted actions aimed at obtaining money from potential victims through deception, misrepresentation, psychological manipulation and emotional pressure. It includes pseudo brokers, scam artists selling software and training courses, income guarantees, and so on.
In this review, you will learn about the most common Forex scam models. You will also learn how to recognize a scammer and what to do if you have already fallen for their bait.
Common Forex Scams To Avoid
One can often hear that Forex is a scam and trading on the Forex currency market is like going to a casino. But that’s not true. Forex is an international over-the-counter market where traders, investors, speculators and representatives of market makers enter into transactions with each other. These transactions are supported by brokers, banks, and liquidity providers. However, sometimes there are scammers among those.
Forex scam is a scheme that is used to deceive traders in order to extort money or gain access to personal information. For this purpose, scammers use direct deception, as well as psychological approaches and emotional pressure.
Most common scams on Forex:
Unlicensed Forex brokers whose website is a payment gateway that is disabled after collecting money.
Sale of custom software, tools and trading signals with “guaranteed income”.
Manipulation of prices, quotes, spreads, and execution of transactions in order to worsen conditions for clients and increase own profits. There may be deliberate advertising of high leverage, which can lead to losses due to an error in calculating the value of a point.
Financial pyramids. They attract new investors in order to attract income to the previous ones. They offer to earn money quickly and easily, but at some point the payments stop.
Psychological pressure, playing on a person’s emotions in order to convince them to invest more money and avoid withdrawing and complaining about problems.
Let’s take a closer look at these Forex scam models.
Fake Trading Educators
Scammers from this group can be divided into two groups: pseudo educators and info marketers. The “educators” have several goals:
get money from a potential victim as payment for a foreign currency trading course. One can only buy the introductory course. They don’t care how useful it will be and whether a person will be able to apply the acquired knowledge;
sell books or video lessons during the training – anything they can make money on;
convince listeners to invest money in a project casually advertised during the training. For example, opening an account with a certain broker in order to make money through an affiliate program.
Trusting nature is a key quality that scammers play on. If a person is trusting, even their rational mind telling them not to get involved in the scam might not be enough.
One of the most common broker scams starts with the message: “You have received a free certificate for 2 weeks of training from top traders.” Next, the victim is taught how to trade on a demo account and given the chance to feel the excitement and taste of success. After this they are offered to switch to a live Forex account with broker X, which is a dummy platform.
Info marketers have a simpler task – to show the potential victim what opportunities they will miss if they do not take advantage of the invitation to this training session. The methods are different: from stories of a beautiful wealthy life to convincing offers to register on the website of a “unique project”. They have one thing in common: false promises and unrealistic expectations. Everything they show in their presentations looks too good to be true.
How to avoid Forex trading scams? Ask yourself a few questions:
What will this training give me? Can I find similar lessons for free?
If this coach is so successful, why don’t they earn money themselves? And if they make money, why would they be coaching?
Why can’t I find real reviews of previous buyers of this course?
There is a category of people who like to work with audiences and share their expertise. But there are relatively few of them. Most “educators” only have one task – to get your money.
Unreliable Trading Signals
Unreliable trading signals are one of the most common and effective scams on Forex. They work great for the following reasons:
many novice Forex traders subconsciously want to trust professionals. Scammers take advantage of that by showing off;
people want to get rich fast. Traders are in no hurry to develop knowledge on their own, hoping to make money using the experience of others;
scams are difficult to prove, because scammers give recommendations without guaranteeing the result or guaranteeing it only in words. The victim voluntarily uses signals whose accuracy is questionable and loses money.
Let’s look at the most common Forex scams of this type.
Paid signals in Telegram
There are many groups online that publish signals for entry and exit, stop levels and explanations.
You pay a monthly subscription and get signals to buy and sell, but they do not work. The signal seller explains this by saying that you used it late, you have a bad quote provider, and so on. You lose money, and the group organizer looks for the next victims.
The influx of new victims is ensured by two factors: a small subscription fee and the desire for easy money. People fall for scammers hoping for instant income without effort. Losing a small amount is not a big deal for them, which scammers take advantage of.
How to avoid scams on the Forex market. Not all paid channels are scams. Pay attention to how many users there are in the group, how many of them actually view the signals and participate in the discussion. If comments are closed, such signals should not be trusted. If there are 50 thousand people in a group, and there are several hundred views, there is a sign of cheating.
Free signals on Telegram
Free signals have two goals: to lure a person into a paid group or to convince them to sign up on a specific platform, to invest in a future scam, etc.
Recently, the following scheme has become increasingly common. A person texts on Telegram and offers to earn money with them. They promise to teach, show and give signals for free. In return, they ask for a percentage of the profits, counting on your honesty. But you need to earn money only on the platform that they recommend. The result is easy to guess – the trader loses money.
How to avoid Forex scams. There is no free lunch. Do not follow recommendations that require payment. Double-check free signals on a demo account. If in a sample of 50 signals 80% are successful, you can think about subscribing.
Copy trading
Signal copying services are available from many brokers. But not every broker approaches ranking responsibly. Therefore, they may contain accounts with inflated results, fake signals or fake accounts.
Perhaps a retail trader actually managed to earn +2,175% in 4 years. However, even large investment funds cannot boast of such profitability. It is prudent to ask which asset volatility brought such large profits, taking into account the losing trades that were covered.
How to avoid Forex scams. If possible, contact the signal provider personally and then decide based on the situation on hand. You can request an investor password and ask questions about the strategy. Use any means to make sure this is a real person with trading experience.
Offers from specific trading signal providers
For visual effect, the signal provider develops a website and offers paid signals from their brand. Alternatively, they supply signals to the broker’s website and get a commission. Occasionally you get recommendations from Forex brokers to use a specific signal provider.
Personal experience. Several years ago, while searching for a job on a local website, I came across an opening for a Forex Analyst. The employer was a developer of relatively simple platform which has a signal delivery function. The notifications look like this: “Expected/Probable price rise/fall upon rebound from resistance/support level.”
The platform is designed exclusively for graphical analysis: patterns, levels, trend lines. Assets include currency pairs, several indices, gold, and oil. The bare minimum.
My job is to give at least one signal with a graphical justification once every 30 minutes (no more, no less, permissible deviation is up to 5 minutes). Main requirements: generate signals constantly, show a beautiful convincing graphic picture. Then these signals with a picture were sent to brokers or signal providers. How exactly they did it was not disclosed. I asked: “Do you need a picture or a result?” and got the following answer: “We need a beautiful convincing picture and a recommendation. We are not interested in the result.” I didn’t pass the trial period then, but I got a clear picture showing the quality of the generated signals.
Unlicensed Brokers
An unlicensed Forex broker does not necessarily mean a scammer. But the lack of a license increases this likelihood, since the broker is unregulated. Sometimes licensed brokers also turn out to be scammers, but control by regulators reduces the possibility of scams to a minimum.
Forex broker having a license means:
this regulated Forex broker actually exists. The authorized capital has been contributed, the broker has a physical office address, and the personal data of the organizers has been provided to the regulator;
the account segregation rule is observed and monitored – client accounts are separated from brokerage accounts. The risk of abuse by the broker is reduced;
a legal broker is regularly audited.
If the broker has no license, it may turn out to be a fictitious website that could shut down at any moment or simply refuse withdrawals.
Checking the license on the website of the CySEC regulatory body
Find information about regulation on the Forex broker’s website. It can be in the page footer of the main page, the FAQ, or the “About the Company” section. Please note that registration and license are two different things. The broker is only regulated when it has a license.
Enter the license number on the main page of the regulator’s website.
Open the card and study the results. Pay attention to the following:
legal name on the regulator’s website is the same as in the offer (User Agreement). In one scam option, the broker offers you to enter into an agreement with another legal entity;
contact details, broker domains match;
countries in which the broker is allowed to operate;
types of financial and trading services permitted by the license.
Numerous reviews and “independent” rankings topped by brokers who are ready to share commission with the ranking website are a classic Forex scam. This is the promotion of affiliate links from which the rating is earned. Whether this can be called fraud is a moot point. But the attempt to mislead the user is a fact.
Recently, another type of fraud has become widespread – companies offer victims of fraudulent brokers to “help” return their money.
This scam works as follows:
The scammer creates a blog website with prepared reviews of scam brokers. They appear every year in the hundreds and go bankrupt at the same rate. Therefore, there is no shortage of material. The aim is to create the appearance of professionalism and the impression that the authors are “in the know.” The website also casually offers a paid service of returning from a fraudulent broker;
The victim usually does not know where to turn. As a rule, you need to contact the law enforcement authorities at the place of registration of the broker. But when one does, they encounter the language barrier and distance problems;
Instead of involving lawyers, translators, and preparing requests to regulators, the victim chooses a simple path and turns to those who promise to return the money.
The scammers extract as much money as possible from the victim for “operational services”, after which they report that nothing can be done or disappear.
Another version of this Forex scam:
scammers offer a refund service without prepayment and payment for “operational services”;
they explain to the client that the regulator, for example, the Central Bank, has a register of active and blocked brokerage accounts, which in fact does not exist. If there is evidence of the broker’s dishonesty, the regulator allegedly helps to return the money. The user needs to enter the registry and make a technical payment to activate an account in the system. Next, the “law firm” together with the regulator withdraws money from the broker’s accounts and returns it to the victim;
the victim receives a link to the registry, which leads to a phishing site.
At best, the victim loses money on the “technical payment”. At worst, they enter all the card details, essentially giving access to it to the scammers.
Forex Pyramid & Ponzi Schemes
Pyramids are companies or platforms that pay profits to current customers by attracting new ones. On Forex they exist in the following forms:
B-book brokers are platforms that do not display traders’ transactions, executing them within their system and often acting as a counterparty to them. Such a broker is not interested in the client’s success. Payments can be made from deposits of new traders.
Marketing platforms attract investors with some unique tools. For example, a proprietary advisor, a trading model, etc. They put together a website in a few hours with an attached payment gateway. At best, only the first investors get the promised profits. At worst, no one gets anything.
Here the scammers didn’t even bother to change the year and make sure the pictures are displayed correctly.
Pseudo management companies. These can be often found on Telegram. They pose as insider trading groups that supposedly have inside information and know where you can make good money if you invest right now. They attract traders with screenshots of payments from “successful” clients.
Scam is the deliberate deception of a potential victim. Pyramids are classified as scams, but there is an exception – High Yield Investment Program (HYIP). These projects are highly profitable platforms operating on a pyramid principle with one difference – the project warns in advance that it is a pyramid. HYIP organizers create a website using special engines, come up with a legend and promote the project using word of mouth.
Example of a legend. The platform makes money on Forex using a unique automatic trading algorithm. The higher the guaranteed profitability, the shorter the life of the project. Those who manage to withdraw money before the jig is up are the winners. There are even aggregators that tell users whether a particular hype project is still paying. Users take part in HYIPs voluntarily and perceive the investment process as a game of chance.
Hidden scams
Ponzi scheme victims are mostly novice traders and fans of get-rich-quick schemes. The rest see no license and a guaranteed income and close the website immediately. This type of scam has another hidden model.
Algorithm for the hidden scam model:
the broker gets a license from an offshore regulator (FSCA, SCB). On the one hand, this is technically a license. This has a positive effect on potential traders. On the other hand, offshore regulators do not require full disclosure of information;
the broker creates a high-quality website, gets a Metatrader license, attracts traders;
traders work, but positions are closed at a loss.
The reason is that the broker manipulates the spread and candlesticks behind the scene. The indicators are redrawn on the chart, showing the signal is false. Long shadows appear, the spread suddenly widens, and slippage appears. Trades are closed at the most inopportune moment, stop loss orders are not triggered, and leverage is changed unilaterally. Ultimately, the trader loses money.
The danger of trading within this scheme on the Forex currency market is that at first a person blames themselves for the loss and continues to deposit. Scripts and comparison of quotes help to identify manipulations on the part of the broker. But even in this case, it is difficult to prove the fact of fraud. Therefore, returning the money is off the table. The trader can only stop using the services of the scam broker, who will continue to attract new victims and take advantage of traders’ ignorance and lack of experience.
One way to identify and avoid Forex scams is to work with brokers licensed by strict regulators (CySEC, ASIC, FCA, BaFin, ESMA). For the US, these are the SEC and CFTC (Commodity Futures Trading Commission). You also need to monitor the accuracy of quotes and spreads. You can find many free tools for this online.
Managing traders
Another classic Forex scam, presented in several models.
Promotion of the managing trader
This scheme comes down to the use of marketing techniques from newsletters to individual offers to invest in a managing trader. Methods of persuasion may include phrases such as “1,000 traders trusted…”, “start trading without investment”, “return over the last year was 100%+, make sure of this by looking at the statistics.” And it doesn’t matter that the statistics are “drawn” on a demo account. Fake backtests are also common on accounts linked to MyFxBook.
On Telegram, the persuasion is even simpler. The trader is asked to view the history of successful signals, the “forecast” for which is written when the signal has already been processed.
PAMM accounts
The model involves transferring money to a PAMM trader on the broker’s trading platform.
PAMM accounts are a working model for passive investors and managing traders provided that the broker controls the actions of managers and forms their ranking responsibly. Unfortunately, scams are common here. A PAMM account can be created under the control of the broker, and the “manager” drains investors’ money in their favor.
What do you do? Do not transfer money to third parties, especially if they do not have the status of legal entities. Instead of PAMM accounts, use a copy trading service where an investor can disconnect from the trader’s account at any time.
Sale of trading software
Novice traders often fall for this type of scams expecting competitive advantages with unique software for fundamental or technical analysis, or algorithmic trading. Scammers offer trading advisors, indicators, and scripts. Backtests are offered for persuasion. However, in reality a paid advisor may turn out to be a slightly modified version of a free advisor, the backtest may be fake, and the software may not work.
What to do if you are a beginner:
do not rush to invest in something that looks too good at first glance;
do not blindly trust guarantees and promises of quick profits. Software that works on quotes history does not guarantee future results;
ask the seller as many questions as possible and try to find inconsistencies. If the conditions seem too good, there may be a catch;
look for reviews.
Reminder: before you buy something, consider whether the purchase will be worth the cost and look for free alternatives.
How To Identify Forex Scams
Detecting scams at an early stage not only saves you money and time, but also mental health. Spending 1-2 hours doing a full analysis of the product and the supplier is much better than desperately looking for ways to get back even some of the money transferred to the scammers. You can spot red flags in the first 5-10 minutes of research.
Guaranteed profitability
No investment asset can guarantee a stable income. Any trader has losing trades and losing periods. Therefore, when you see a promise of guaranteed income in a week or a month on the broker/platform’s website, it is most likely a pyramid scheme.
Important! Every regulator will warn you that investing is a risk. There can be no guaranteed income. If the broker or company contradicts the regulator, do not engage.
Unsolicited Contacts & Offers
Aggressive Marketing:
cold emails or calls with an offer to invest in an unknown company;
being added to a group in a messenger without your consent. Scammers find contacts in trading groups and send targeted offers with promises of wealth.
The latter model has recently become especially popular. Scammers take advantage of the fact that in messengers people often follow unfamiliar links or are automatically added to groups. After this they start receiving financial spam.
A more complex scheme can open access to the user’s contacts if they click on specific link. Then the scammer creates a fake account with an avatar of a person familiar to the user and convinces the user to invest on their behalf.
Important! No matter what the offer is, you always have unlimited time to think. If they indicate there is a rush to make a decision and use phrases like “the offer is valid only for 1 hour” and “there are only 15 places left in the group”, ignore it.
Suspicious Behaviors
Possible scams:
invitation to unfamiliar groups to which you did not apply. “Encrypted chats” where only group members can see the messages. If you cannot comment on posts in the group, this is another reason to suspect scam;
invitation to follow an unknown link with suspicious characters in it;
payments where the recipient is a third party.
persistent attempts to convince you to invest in the project by any means;
active advertising of affiliate programs. The more sellers promote referral links instead of promoting the product itself, the higher the likelihood that it is a pyramid.
Try to take everything with a big grain of salt. Consider your potential partner’s goals.
Important! The less transparency and the more marketing activity, the more likely you are to lose.
Website & Document Warning Signs
Signs of scam:
spelling and grammar errors on the website. Honest companies make sure their website is in order;
the company name is not in the top 10 positions in a direct search in search engines (search query: “XXX company website”);
lack of transparency in the offer. Lack of details, vague wording in the section on dispute resolution. Emphasis on the “Trader’s Responsibility” section (or analogous item);
differences in the name of the legal entity in the offer/User Agreement and the name indicated on the website;
broken links, layout errors.
If you see at least one of the signs listed, it means there is a possibility of scam.
Important! Suspicious details may be a sign of phishing – an attempt to copy the original website, its design or name. Never enter payment card or wallet details if you have any doubts about the website. Always read the User Agreement and look for pitfalls.
Protecting Yourself From Scams
Interesting statistics: in developed countries, 74% of victims of financial scams do not take any action. Here are possible reasons:
the victims are certain the scammers cannot be found and punished;
they do not want to waste their time;
they don’t know where to turn and what to do.
The remaining 26% of victims go to:
43% – the bank that carried out the transactions;
34% – the police, authorities working with economic crimes, and regulators;
19% – providers and mobile operators in order to obtain information about the scammers;
4% – to higher-level organizers. For example, the owners of the group on Telegram, where the scammer was a participant.
There aren’t really any statistics on how many applications were resolved in favor of the applicants. Therefore, preventing scams is much more effective.
Use Security Tools (VPN, Password Manager, Antivirus)
Scammers can gain access to your passwords, bank cards, and financial accounts if you’re careless. How to protect yourself:
use two-factor authentication. This is password confirmation using a code sent to your email or phone;
use different passwords and encryption methods for different software. Scammers gained access to your brokerage account? If the email password is the same, two-factor authentication will not help. Use password managers so you don’t have to write down each one;
use paid VPS. There are many examples of leaks of free VPS databases containing personal user data;
use antivirus software. Automatic malware scanning helps avoid bad websites and infected software in downloaded archives;
use a VPN. Constantly changing your IP address makes it impossible to track your location and complicates the work of scammers;
If you are working on someone else’s computer, do not save passwords in the browser. Make sure to disable this option.
Never click on unfamiliar links from email or instant messengers. If curiosity is stronger, copy the link to another computer with no access to data (for example, a child’s tablet with limited network access or an old spare computer).
Transaction Reversal Challenges
Chargeback is a procedure for returning money to the payer if they are not satisfied with the product or service that they paid for using a bank card (interbank transfer). It can be initiated for various reasons: scams, low-quality product or service, double debiting, unauthorized transaction, and so on. This procedure is regulated by the rules of payment systems such as Visa and Mastercard.
Chargeback only works if the money is transferred to the broker through a bank or payment systems and only if there is 100% proof of fraud. If these conditions are met, you contact the bank to report illegal actions. It may take more than 6 months to complete the paperwork, but you can get your money back almost in full.
Forex Market & Scam Summary
Forex is the largest financial market in the world, but it is decentralized. Unlike the stock market where all transactions go through the exchange and strict control of regulators, Forex, as a CFD market, doesn’t have complete transparency and sufficient regulation. According to statistics, every year more than 1,000 scam platforms appear on Forex and disappear with clients’ money.
Warnings by regulators are just warnings. Regulators do not have absolute power to force a scammer to stop collecting clients’ money and also cannot track the legitimacy of a trillion transactions a day. Besides, most traders do not go to regulators’ websites and do not read warnings. Hence the many scammers.
The scam problem on legitimate Forex has recently been complicated by the emergence of freely available artificial intelligence (AI) tools. With their help, scammers can generate content for mailing lists and multi-page websites in a few minutes. They can even write code. Therefore, it takes much less time and money to create fake groups simulating user dialogue, as well as fake websites and content for them.
With the help of AI, scammers have learned to create deepfakes that are almost perfectly similar to the original. When people see a video with “Elon Musk” or another influencer convincingly talking about investing in a no-name project, it often works on them.
Final Guidance
How to check in 20 minutes whether a broker or investment company is a scammer or not? Here is the algorithm and red flags to pay attention to:
1. Check their license. If the broker doesn’t have one, leave. If the broker is licensed and regulated, go to the regulator’s website and check the validity period using the license number and company name. Pay attention to exactly what services the company is allowed to provide.
2. Check their contacts. Scammers often get caught because:
they only have a postal address on the website. No phones, no email. A feedback form is provided for communication;
their physical address or phone number do not exist or are fake when checked. For example, there is a supermarket where the office should be, or the office address is in the US and the phone code is Nigeria.
3. Check the website registration date using a special platform. They are free. If the website was created a few months ago, and the company positions itself as having “more than 10 years of experience,” this is a red flag.
4. Look through the brokers’ trading offers. If the company guarantees profit and actively promotes affiliate programs, there is a possibility of scam. Also, scammers are in no hurry to reveal the essence of the proposed product. They mostly focus on advertising slogans, enticing phrases, past successes, number of current clients, and so on.
5. Investigate the website. Scammers can make a beautiful landing page but a further inspection may reveal that some pages have a layout failure, some external links do not open, and search windows do not work.
6. Chat with support. The chat may turn out to be a dummy, and the support may be a bot.
7. Look for company reviews. If this is an obvious scam, people may have already written about it.
Avoid promises of guaranteed returns. Doing due diligence will save you money in the long run.
Forex is a market of opportunity. It’s quite possible to make money and get adrenaline here. But remember to be careful.
The Japanese candlestick chart is popular among many traders in the market. This type of chart provides information about prices and gives trading signals, allowing traders to predict the future price movement of an asset.
Candlestick analysis includes various patterns, which can consist of one, two, three, or more candlesticks, such as the Morning star. This pattern combines three candlesticks: a large bearish candlestick, a smaller candlestick in the middle, and a large bullish candlestick.
The appearance of this bullish reversal pattern on the chart signals an upcoming upward price reversal and warns market participants that the bearish trend has ended.
You have probably encountered this pattern many times while analyzing asset charts. But what does it signal?
You will find out the answer to this and many other questions in this article.
Key Takeaways
What Is a Morning Star
The Morning star is a candlestick with a small body that forms at the bottom of the downtrend and signals an upward trend reversal. The pattern consists of three candlesticks: two large ones with different directions and a smaller candlestick between them.
The Morning star can also occur without a body. This pattern is called the Morning star doji. It provides a stronger signal for a trend reversal.
The key feature of the Morning star is that the candlestick’s body can be either bearish or bullish. In the classic example, when the pattern is formed, there should be gaps between the short and tall candlesticks.
Morning Star Pattern Formation
Let’s consider each stage in detail:
The first tall red candlestick indicates the sustained sellers’ prevalence in the market.
Next, a short candlestick with a small body forms, which alerts market participants. The construction of this candlestick signals diminishing bearish pressure, as buyers and sellers start to balance out over the session.
Then a large green candlestick begins to form, which finally confirms the bullish influence on the price. That is, quotes reach a critical level during the formation of a candle with a short body. Sellers are unlikely to push the asset’s price below this level.
The above chart shows the Morning star pattern, after which bulls attempted to reverse the trend. However, the price returned to the support level. Then Inverted hammer and Hammer patterns appeared on the daily chart of #DIS shares. Market participants received the final bullish signal for the upward price reversal and the uptrend’s beginning.
How to Identify a Morning Star
Each candlestick pattern has its distinctive features. Before identifying the Morning star pattern and opening a trade, make sure that the pattern is properly built.
The Morning Star pattern is formed after the downtrend end or during a long consolidation, precisely when the trading instrument hits the downtrend’s bottom.
The first Japanese candlestick should be bearish.
As a rule, a small gap between the first and the second candlestick, which characterizes the Morning star, should appear.
The second candlestick should have a short body of any color or be in the form of a doji, which has no body at all. This candlestick is the star. It shows that the strength of bears is fading.
After the middle candlestick has formed, a gap may appear. The second gap strengthens the level at which the Morning star is formed.
The third candlestick should be bullish and overlap the first bearish candlestick by at least half. In some cases, the green candlestick may significantly overlap the first one, strengthening the pattern and confirming that the buyers are gaining power.
The last candlestick is no less significant than the star itself. It shows the market’s bullish bias and readiness to open long positions.
After the Morning star pattern is built, the market continues growing in the next trading sessions. The price goes upward, resulting in the subsequent development of the uptrend.
Morning Star Example
The Morning Star pattern can be formed on different time frames and financial markets. Below are examples of the pattern for different trading instruments.
The chart shows a short-term downtrend. After breaking through the upper boundary, the price formed the Morning star pattern.
After the pattern was completed, the price reversed and started to grow. After the Bullish engulfing pattern, oil surged rapidly.
When the price hit the resistance of 79.82, bears started to sell the asset, and the Bearish marubozu pattern was formed. This became a signal to close long trades.
Before reaching a new high in mid-March, the Bitcoin price formed a Morning star pattern at the end of a short-term downtrend.
Notably, the pattern’s third candlestick failed to overlap at least half of the first bearish candlestick. Nevertheless, this pattern signaled a rally.
The upward reversal is also confirmed by the Three white soldiers uptrend continuation pattern.
After a sustained decline, the price kept trading within the large Double bottom pattern, exceeding the neckline.
In the area of the first bottom, several Morning star patterns were formed, providing a signal for a downtrend reversal.
Besides, the first pattern’s third long bullish candlestick opened with a large gap, giving a strong signal for a trend reversal.
Most often, such gaps can be found on stock charts.
How to Trade Morning Star
The Morning star pattern can be applied to many trading strategies. Let’s analyze the most effective of them.
1. Trading strategy using support levels
This strategy involves trading the Morning star pattern and opening trades at support levels.
Let’s take a closer look at this strategy on the hourly chart of Alphabet, Inc.
After the gap formed on the chart, the price continued to fall and reached the support level of 121.58, where the Morning star doji reversal pattern appeared. In addition, history shows that the gap will close sooner or later.
Therefore, it is possible to go long after the formation of the Morning star doji at the key support level.
The targets are 129.26, 135.15, and 140.67, i.e., the whole area of the gap. It is necessary to take profits partially at 129.26 and 135.15 and close the position completely at 140.67.
A stop-loss order should be placed below the support level and the Morning star doji pattern.
On the chart, after closing the gap at the resistance level of 140.67, the price began to form the bearish reversal patterns of Shooting star and Evening star and began to fall.
2. Trading strategy with Morning star confirmation using other candlestick patterns
On the four-hour chart, the EURUSD pair has dropped within the downward trend to the buy zone between 1.0667 and 1.0635.
The Bullish engulfing candlestick pattern offered the first confirmation of the upward reversal. Two Morning star patterns formed, which included the Hammer patterns. Another Hammer and Three white soldiers patterns also confirmed the reversal near 1.0734.
In this connection, long trades can be opened near 1.0734 after the Hammer pattern forms and confirms bullish momentum.
Targets are 1.0779, 1.0864, 1.0954, and 1.1007. Close your trade partially to maximize profits.
A stop-loss order is placed below 1.0667 and the second Morning star pattern.
The pair started a downward reversal at 1.1007 after the Shooting star bearish pattern, giving a signal to close the long trade.
3. Combined strategy for trading the Morning star pattern using technical indicators and large chart patterns
The combined strategy appears to be more effective as it involves the Morning star candlestick pattern, technical indicators, and large chart patterns.
This strategy depends on the instrument. Use different types of technical indicators such as :
The RSI, MFI, MACD, VWAP with SMA20 indicators can be used to analyze USCRUDE’s daily chart.
These indicators allow you to determine support/resistance levels, overbought and oversold zones, the strength of the current trend, and the expected price reversal levels.
In addition, it is necessary to use graphical and candlestick analysis to determine more favorable entry and exit points.
Technical analysis is as follows:
Determine the buy zone and support levels.
On the daily chart, the Symmetrical triangle patterns have emerged. The price can breach its upward or downward boundary. Nevertheless, the price is likely to increase.
The Hammer reversal pattern has also formed.
The Bullish engulfing pattern is following the Hammer.
Notably, several Morning star reversal patterns have completed.
The MFI rebounds upwards from the oversold boundary.
The RSI shows an upward reversal from the lower boundary.
MACD gave an earlier upward reversal signal by crossing the zero threshold from below when the price was inside the Symmetrical triangle.
When the triangle was violated, the MACD was rising rapidly in the positive zone, finally confirming the bullish trend.
Tick volumes began to grow intensively after the breakdown of the Symmetrical triangle’s upper boundary, indicating the mass opening of long trades.
The price crossed the VWAP and SMA20 lines from below, giving another confirmation of a bullish trend.
Buy after the breakout of the Symmetrical triangle pattern.
Stop-loss.
Target 1.
Target 2.
Target 3, close the trade completely.
The Marubozu bearish pattern, signaling a downward price reversal.
In general, the combined technical analysis gave more than 10 buy signals after the Morning star pattern formed and the triangle’s upward boundary was breached. In the long term, such a trade could generate a significant profit within 2-3 months. The asset has appreciated by more than 80% over this period.
Morning Star vs. Evening Star Patterns
The Morning star pattern has a bearish counterpart, the Evening star, which signals an imminent trend reversal at its peak.
Morning star
Evening star
The Morning star pattern is formed at the downtrend’s bottom.
The Evening Star pattern is formed at the uptrend’s peak.
Signals a downtrend reversal to the upside.
Signals an uptrend reversal to the downside.
The Morning star pattern’s first candlestick should be bearish, and the third one should be bullish. The second candlestick can be either bullish or bearish.
The first candlestick of the Evening Star pattern should be bullish, and the third candlestick is bearish. The second candlestick can be bullish or bearish.
A stop-loss order is set below the support level and the Morning star pattern.
A stop-loss order is placed above resistance level and the Evening star pattern.
Pros and Cons of Using Morning Star Pattern
Any candlestick pattern has its advantages and disadvantages.
Despite the fact that the Morning star pattern gives a strong reversal signal, it is necessary to follow the risk and money management rules when using it in trading.
Pros
The Morning star pattern indicates a potential trend reversal at the bottom, which allows you to open long positions at more favorable prices.
The pattern is formed in almost all financial markets, including Forex, cryptocurrency, stock, and commodity markets.
It can be used when trading on various timeframes from M5 to MN. The higher the time frame is, the stronger the Morning star signals are.
The Morning star pattern generates clear entry points, targets, and stop-loss levels.
The candlestick pattern is easy to identify on the price chart.
Cons
On lower time frames, the pattern may give false signals due to the increased level of market noise.
The pattern requires confirmation by other candlestick or chart patterns, as well as technical indicators.
Conclusion
The Morning star pattern is a classic Japanese candlestick pattern that signals the price reaching a low price area followed by a trend reversal.
The pattern is easy to recognize on a price chart and has effective trading criteria. Properly using the pattern will increase the profitability of your trades.
It is best to use the Morning star candlestick pattern with other chart patterns and technical indicators. This approach will allow you to conduct a more accurate technical analysis and open more profitable trades.
You can test trading the Morning star pattern for free on a loss-free demo account from LiteFinance, one of the best brokers in the market. The multifunctional online platform provides access to a wide array of trading instruments.
Gold (XAU/USD) plummeted this week, slipping below a key trendline at $2,360 and the 38.2% Fibonacci retracement of the 2024 advance at $2,335. With bearish momentum seemingly accelerating, sellers could soon make a move on the 50-day SMA at $2,310. On further weakness, the focus will be on the psychological $2,300 threshold, followed by $2,280, May’s swing low.
In case of a market rebound, resistance could manifest near the $2,375 zone. Surmounting this technical ceiling could prove challenging, yet a breakout could encourage buyers to launch an assault on $2,420. Additional gains beyond this point could set the stage for a rally towards $2,430, with the all-time high at $2,450 representing the next noteworthy bullish target to keep an eye on.
The European Central Bank is likely to reduce borrowing costs from a record high of 4% at its upcoming June meeting. However, the extent of additional rate cuts will depend on the inflation outlook. In this sense, the May Flash CPI report will be crucial, offering valuable insights into recent price trends within the regional economy, which will play a pivotal role in guiding the monetary policy trajectory.
Analysts expect Eurozone inflation to rise to 2.5% y-o-y this month from 2.4% in April, with the core gauge anticipated to remain steady at 2.7%. The slight uptick in the headline metric may not deter the ECB from pulling the trigger next month, but an upside surprise may prompt the institution to adopt a more cautious approach to future easing. In light of these developments, euro FX pairs may be subject to heightened volatility heading into the weekend.
Want to know where the euro may be headed over the coming months? Explore all the insights available in our quarterly forecast. Request your complimentary guide today!
US
Core PCE deflator data will also be released on Friday. Consensus estimates suggest a 0.3% increase in April, with the annual rate cooling to 2.7% from 2.8, marking a small but favorable directional move. A downward surprise could reignite optimism that the disinflationary trend, which began in late 2023 but stalled earlier this year, is back on track, strengthening the case for the FOMC to pivot to a looser stance at some point in the fall. This should be bearish for the U.S. dollar but positive for stocks and gold.
Conversely, if inflation numbers exceed forecasts, interest rate expectations could shift in a hawkish direction, delaying the Fed’s timeline for initiating rate cuts. In this scenario, November or December could become the new baseline for a potential move by the U.S. central bank. Such a development could propel bond yields and the greenback higher, creating a more challenging environment for equities and precious metals.
For an in-depth look at the variables that may impact financial markets in the coming week, explore the comprehensive forecasts and analysis offered by the DailyFX team. Our expert analysis may equip you to navigate the dynamic market environment and make smart trading decisions.
For an extensive analysis of gold’s fundamental and technical outlook, download our complimentary quarterly trading forecast now!
EUR/USD Drivers Remain Scarce as Markets Likely to Take its Cue from PCE Data
In the week just gone, the lack of high-profile US data led to lower volatility that favoured the dollar and treasury yields. During periods of lower volatility markets tend to follow the path of least resistance, more specifically, the FX market tends to favor higher yielding currencies over lower yielding currencies. With US PCE data only due at the end of the week, we could see a similar trading environment whereby the dollar continues to build on marginal gains until the big data point at the end of the week.
Better than expected survey data out of the University of Michigan consumer sentiment report on Friday revealed a step back in inflation expectations which spurred on temporary dollar weakness and a move higher for EUR/USD. The late partial recovery in EUR/USD provides a potential launchpad for EUR/USD bears at the start of the coming week.
Should inflation within the eurozone continue to weaken, starting with figures out of Germany, the euro may come under some pressure midweek. The pair may continue to ease into the June ECB meeting as a strong majority of ECB officials have communicated a preference for a 25 basis point cut next month. In contrast, the FOMC minutes from the May Fed meeting communicated a more hawkish approach and lack of confidence that inflation will move swiftly to the Feds 2% target – prolonging the ‘higher for longer’ narrative which naturally supports a stronger US dollar and US yields.
Lower German an EU inflation next week could see the pair trade lower, something that may be amplified by an underwhelming PCE print (stubborn inflation). Failure to make a new swing high at the start of the week opens up the rest of the week for a bearish move should the data comply. 1.0800 is the tripwire for a sell-off and the recent high of 1,0895 would need to be overcome on a daily closing basis to suggest a bullish continuation.
EUR/USD Daily Chart
EUR/USD is one of the most liquid currency pairs in the world, offering short-term trades with a cost effective and convenient market to trade. Discover the real benefits of trading liquid pairs and which pairs qualify:
Recommended by Richard Snow
How To Trade The Top Three Most Liquid Forex Pairs
Get My Guides
USD/JPY Uptrend Remains Intact after Weaker Japanese Inflation Data
During a week with fewer high-profile US economic data releases, the dollar was widely anticipated to recover, catering to the market’s inclination towards higher-yielding currencies in periods of reduced volatility.
Less than a month since Japanese officials were believed to have intervened in the foreign exchange market, the USD/JPY exchange rate has once again approached the 160 level, which initially triggered their response. However, the upward movement has been more gradual this time, lacking the volatility that prompted Japanese officials to take action.
The USD/JPY pair is currently trading above 157.00, having rebounded strongly off the 50-day simple moving average (SMA) in early May and subsequently surpassing the 155.00 level. The issue of Japanese yen weakness is likely to persist as long as the significant interest rate differential between the United States and Japan remains intact. The carry trade continues to exhibit strength.

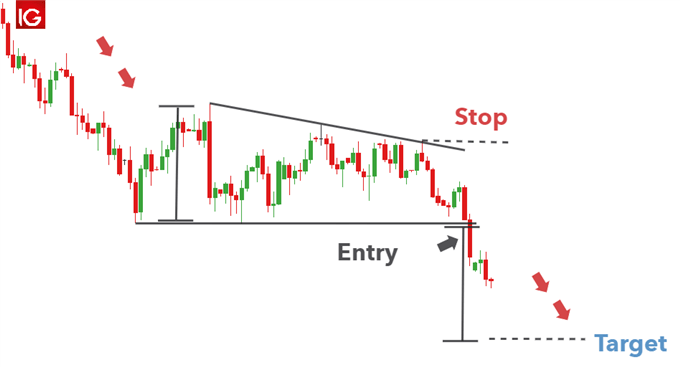
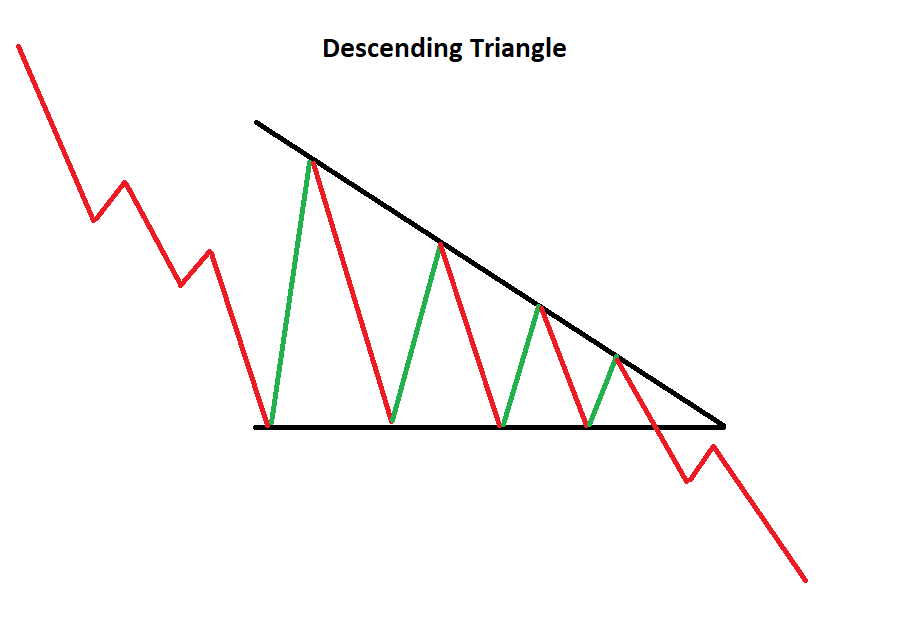
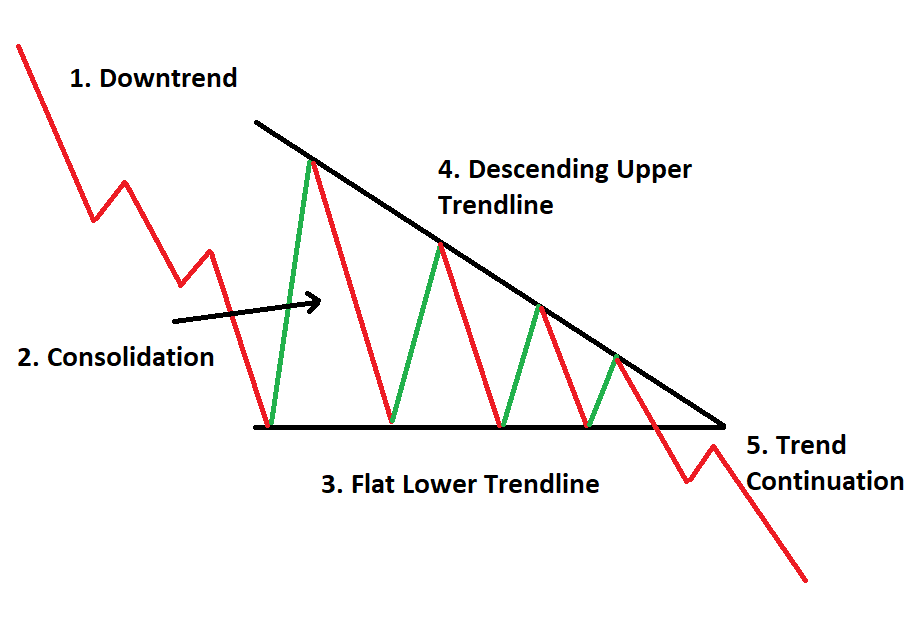
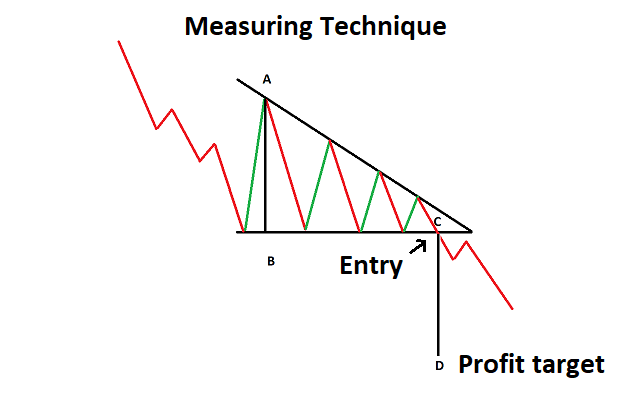
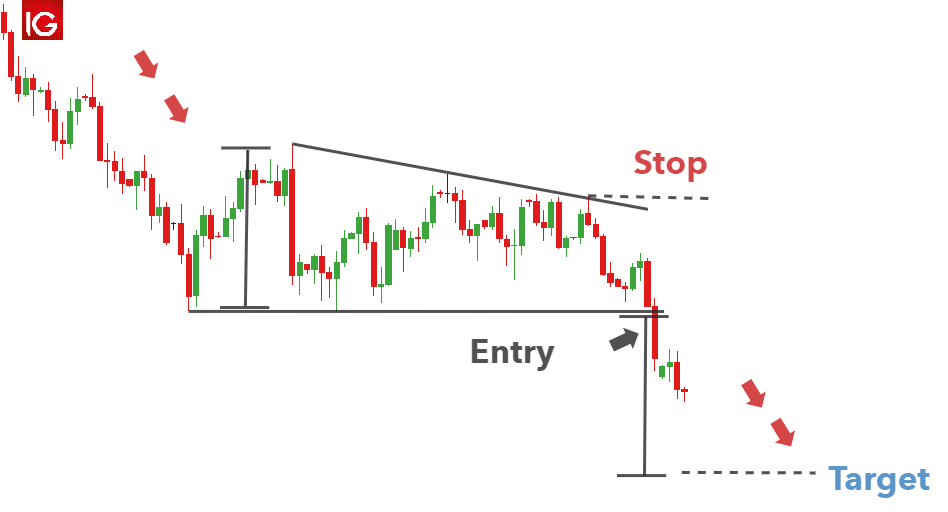


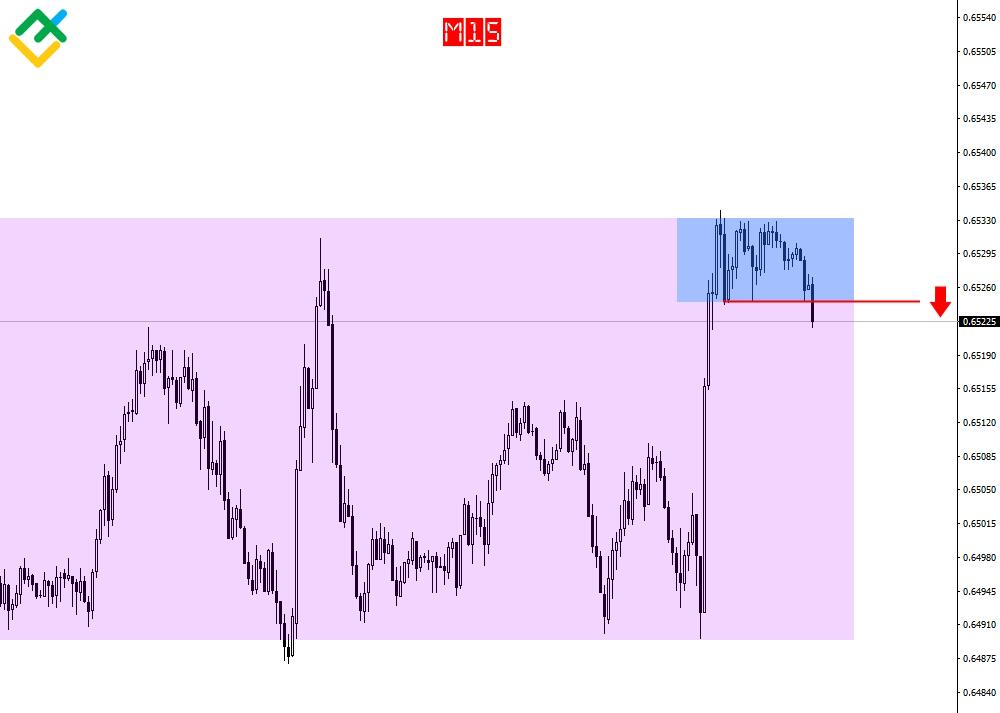







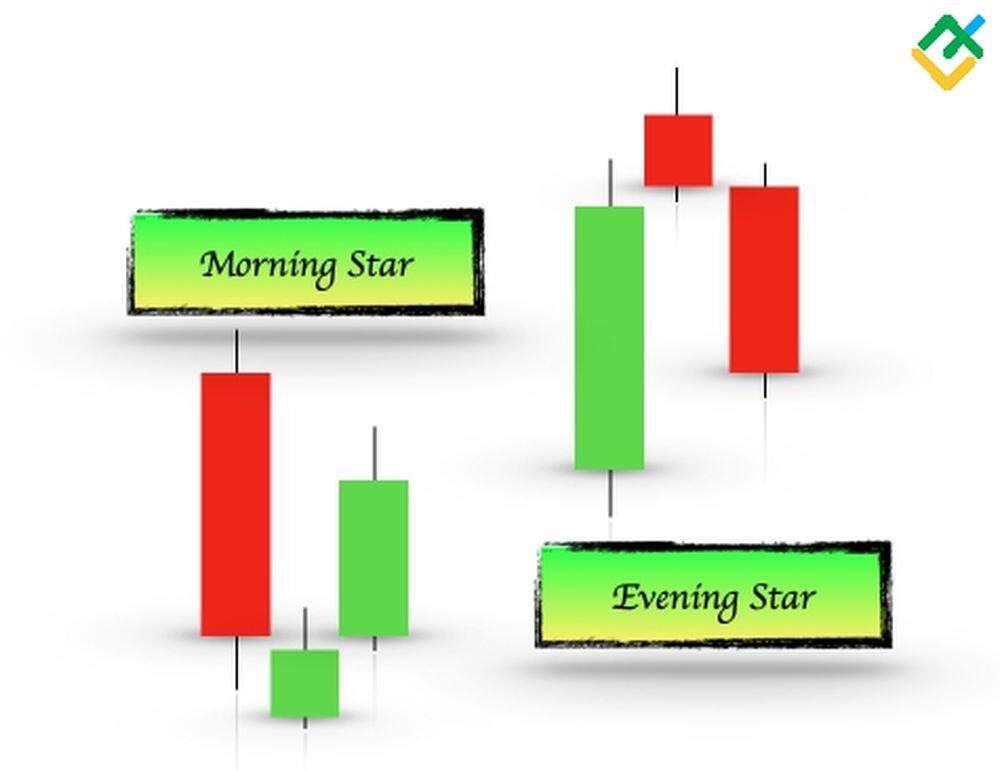



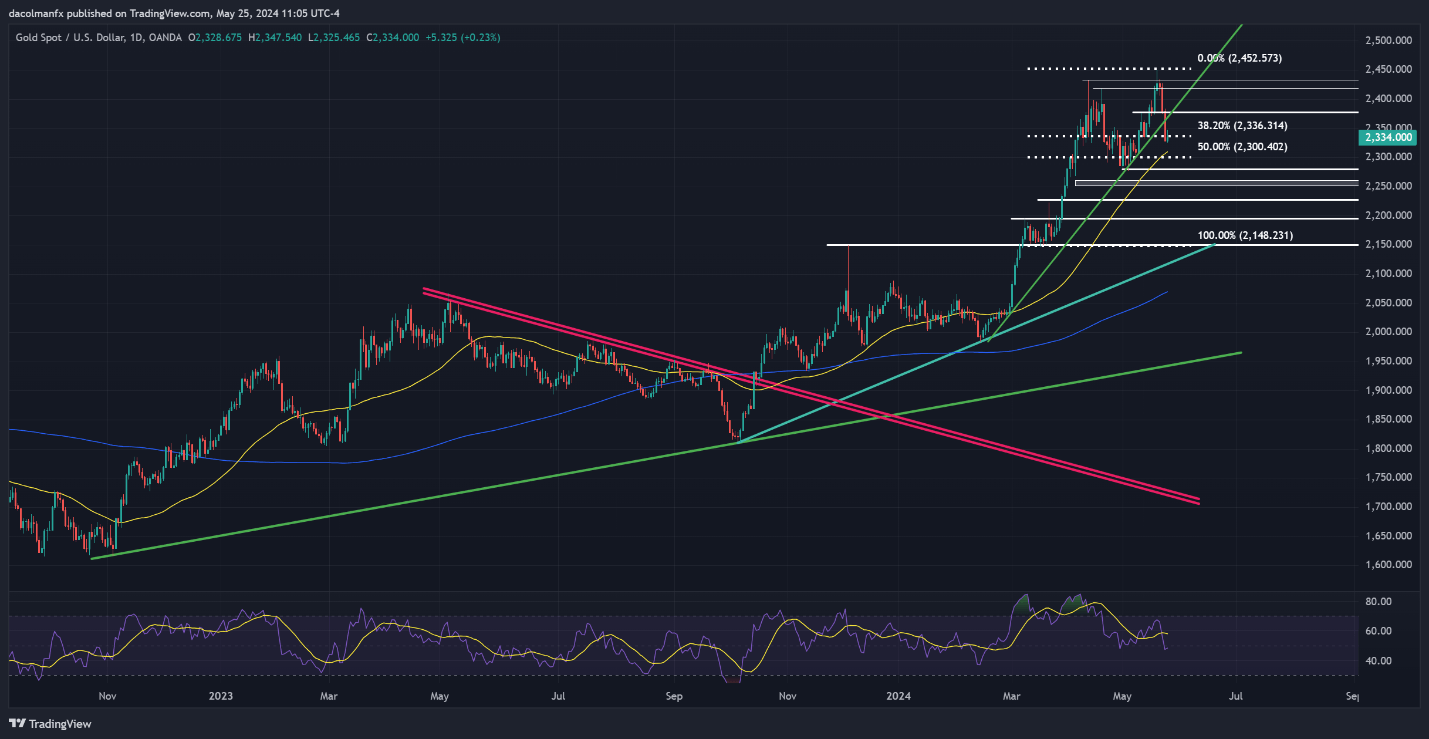


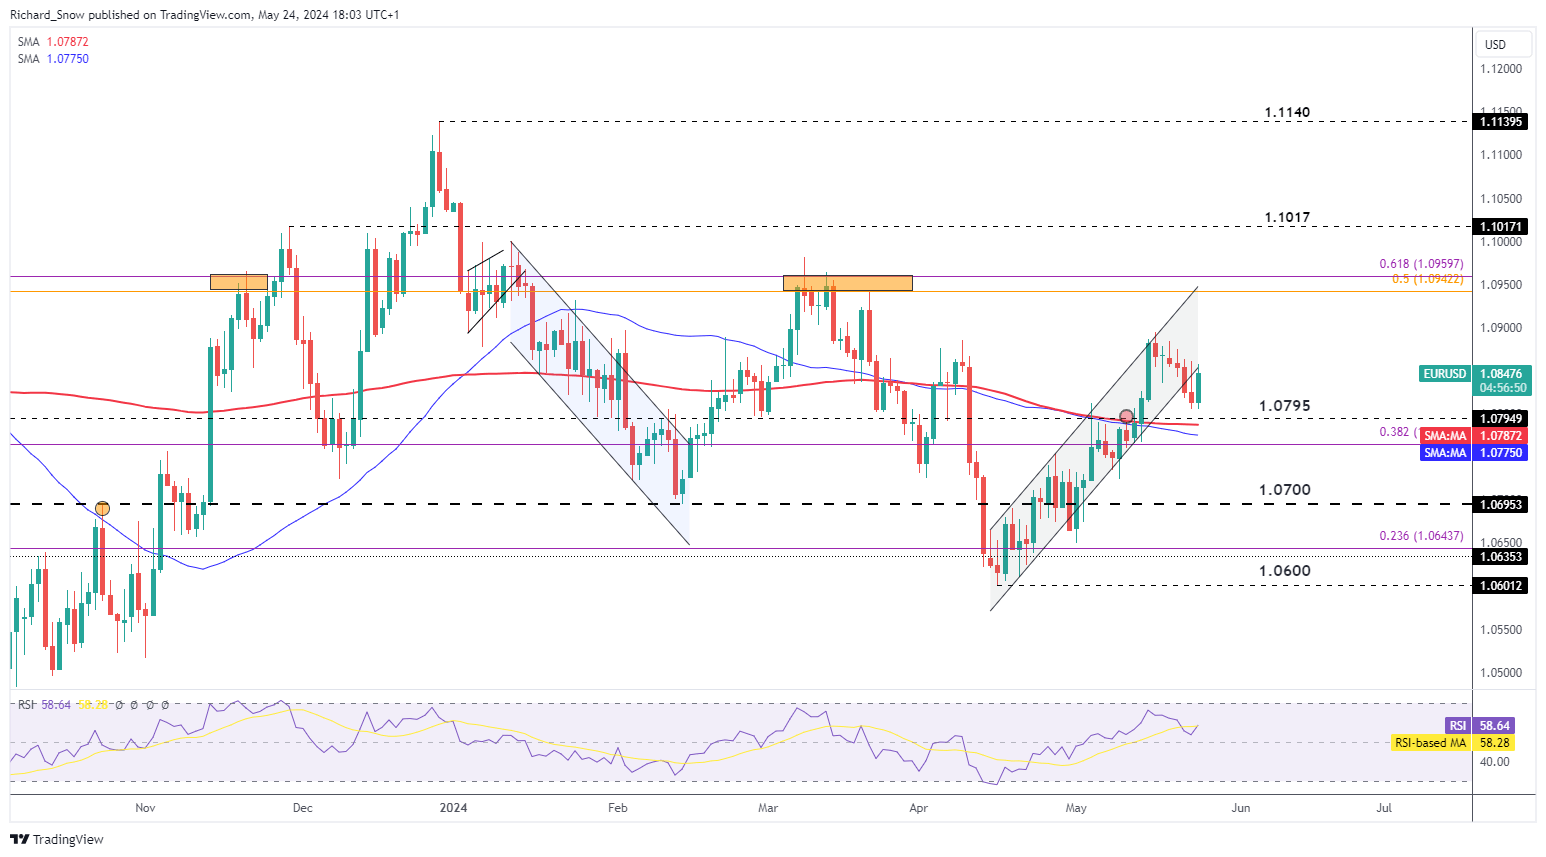

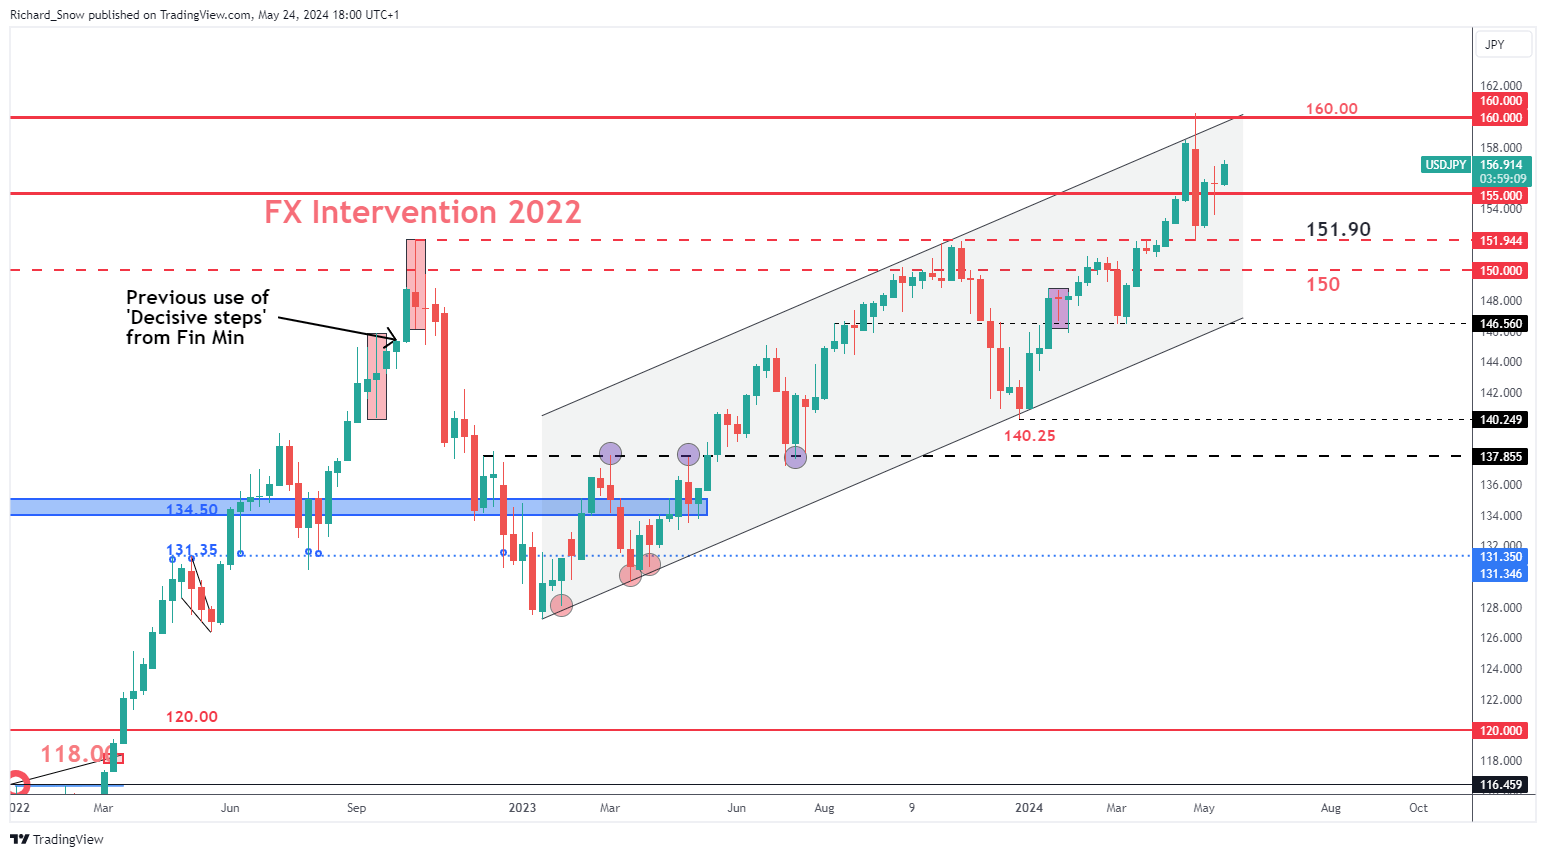
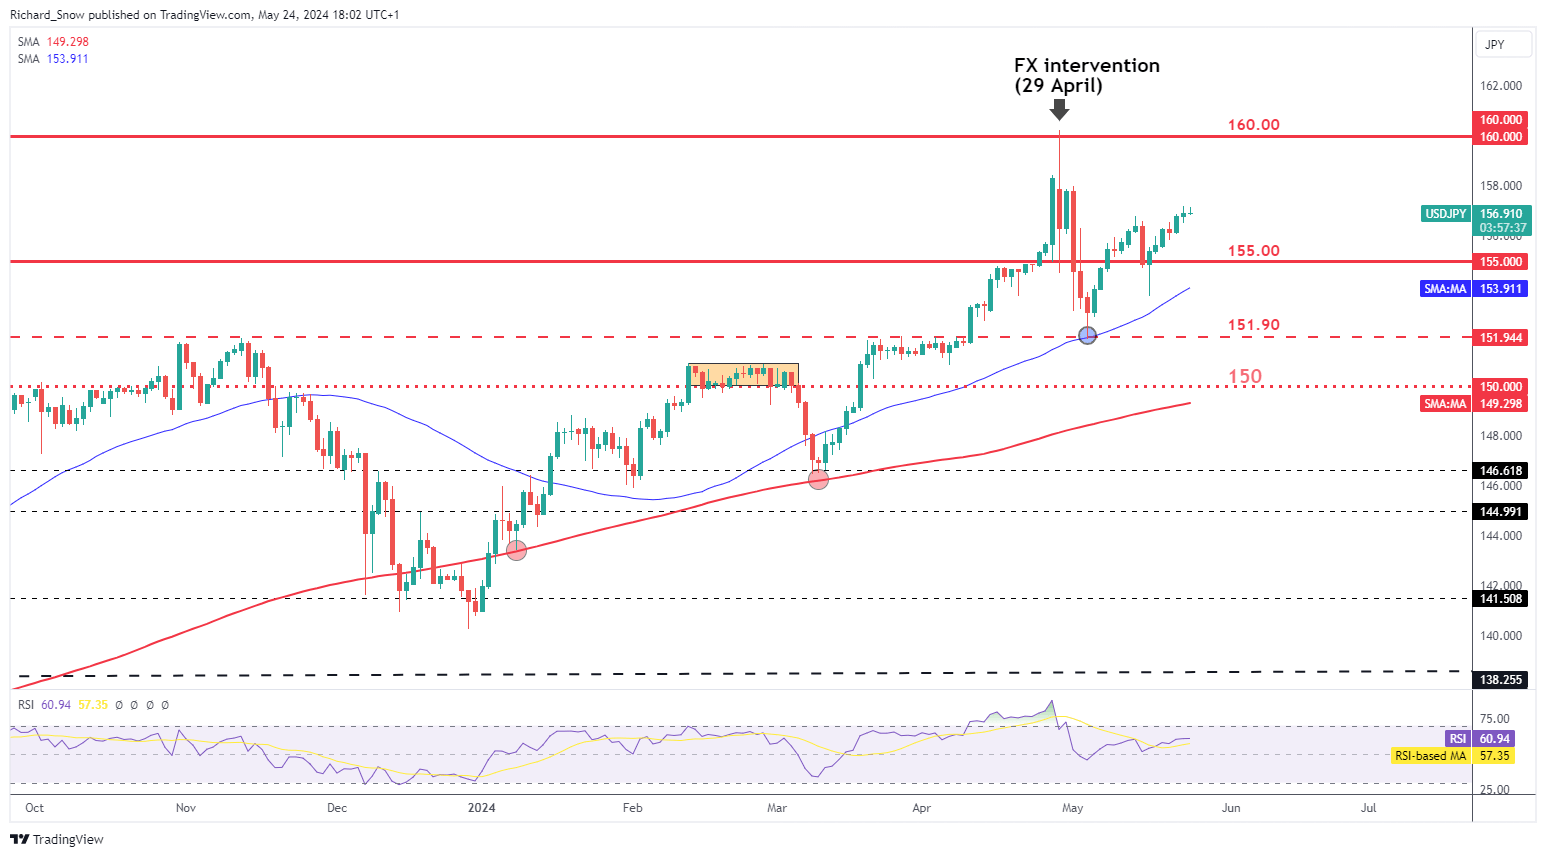
 Chat now!