Japanese Yen hangs near monthly low against USD; not out of the woods yet

Japanese Yen hangs near monthly low against USD; not out of the woods yet

The Japanese Yen (JPY) remains on the back foot against its American counterpart for the fifth straight day and drops to over a two-week low during the Asian session on Friday. The growing market conviction that the Bank of Japan (BoJ) will not raise interest rates at its upcoming policy meeting next week continues to undermine the JPY. Adding to this, expectations for a less dovish Federal Reserve (Fed) remain supportive of the recent move up in the US Treasury bond yields, which turns out to be another factor driving flows away from the lower-yielding JPY.

That said, a softer risk tone, along with persistent geopolitical risks and concerns about US President-elect Donald Trump’s tariff plans, offer some support to the safe-haven JPY. The US Dollar (USD), on the other hand, consolidates its weekly gains to a fresh monthly peak and fails to assist the USD/JPY pair to build on the momentum beyond the 153.00 mark. Traders also seem reluctant to place aggressive bets and might now opt to move to the sidelines ahead of next week’s key central bank event risks – the highly-anticipated FOMC and the BoJ policy meetings.

USD/JPY bulls have the upper hand, 153.70-153.80 confluene hurdle breakout in play
fxsoriginal

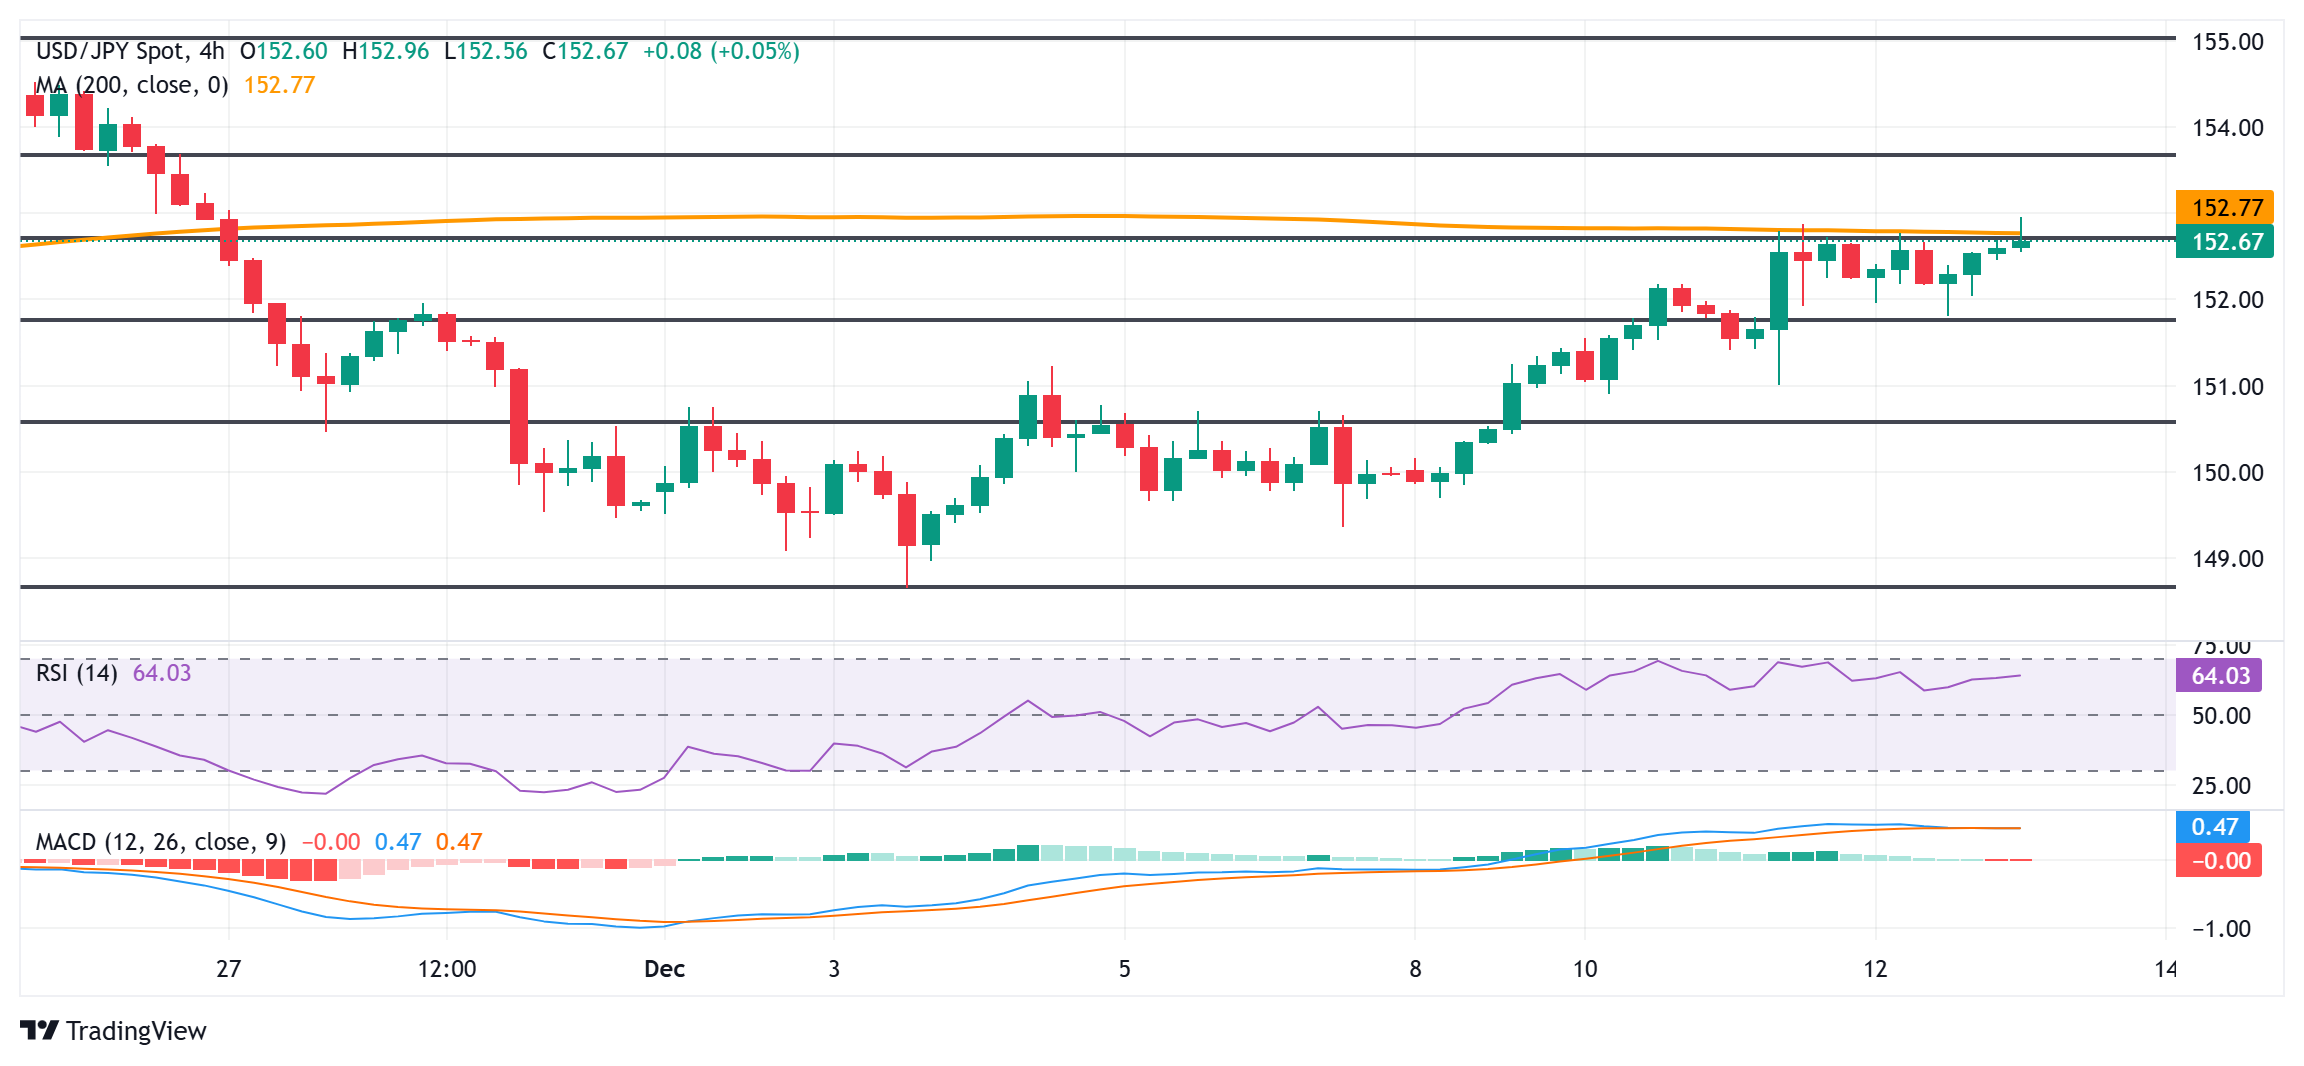
From a technical perspective, the lack of follow-through buying beyond the 152.70-152.80 confluence warrants some caution for bullish traders. The said area comprises the 200-period Simple Moving Average (SMA) on the 4-hour chart and the 50% retracement level of the recent pullback from the multi-month high. Given that oscillators on daily/4-hour charts are holding in positive territory, a sustained strength beyond could lift the USD/JPY pair to the 153.00 mark en route to the 153.65 region, or the 61.8% Fibonacci retracement level. The momentum could extend further and allow spot prices to reclaim the 154.00 mark.

On the flip side, weakness below the 152.00 mark might continue to find some support near the 151.75 area or the 38.2% Fibo. level. The said area nears the overnight swing low and should now act as a key pivotal point. Some follow-through selling could make the USD/JPY pair vulnerable to weaken further below the 151.00 round figure, towards the 150.50 intermediate support before eventually dropping to the 150.00 psychological mark.

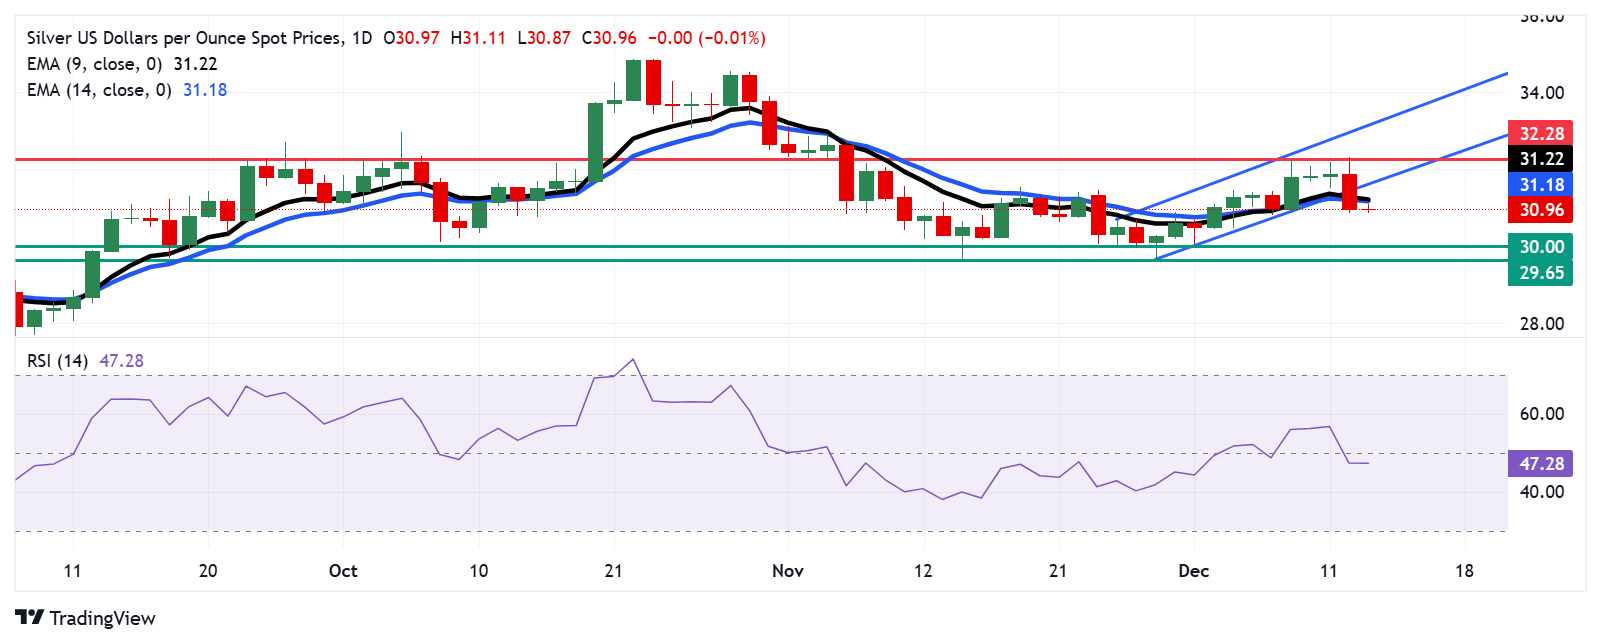
Silver Price Forecast: XAG/USD falls to near $31.00 after breaking below ascending channel

Silver Price Forecast: XAG/USD falls to near $31.00 after breaking below ascending channel

Silver price (XAG/USD) extends its losses for the second session, trading around $30.90 per troy ounce during the Asian hours on Friday. The daily chart analysis indicates a momentum shift to bearish from bullish bias as the pair has broken below the ascending channel pattern.

The XAG/USD pair moves below the nine- and 14-day Exponential Moving Averages (EMA), indicating an ongoing bearish outlook and signaling to weaken short-term price momentum. This points to increasing selling interest and raises the likelihood of further price depreciation.

Additionally, the 14-day Relative Strength Index (RSI) falls below the 50 mark, further confirming the emergence of the bearish bias.

On the downside, the XAG/USD pair could navigate the region around the psychological level of $30.00, followed by a “throwback support” level at its three-month low of $29.65, which was recorded on November 28.

The immediate barriers appear at the 14-day EMA at $31.18, followed by the nine-day EMA at $31.22. A break above these levels could cause the bullish bias to re-emerge and help the Silver price to return to the ascending channel pattern.

A return to the channel would support the XAG/USD pair to retest its five-week high of $32.28, followed by the ascending channel’s upper boundary at $33.00.

XAG/USD: Daily Chart

Australian Dollar extends losses as US Dollar remains solid due to US tariff threats

Australian Dollar extends losses as US Dollar remains solid due to US tariff threats

The Australian Dollar (AUD) continues to struggle against the US Dollar (USD) on Friday. The tariff threats from Trump’s administration have boosted the US Dollar (USD) across the board and created a headwind for the AUD/USD pair. Additionally, speculations about a potential 10% tariff on Chinese goods might drag the AUD lower as China has been the largest trading partner of Australia.

The AUD received support after the release of domestic mixed employment data on Thursday. The seasonally adjusted Employment Change rose by 35,600, bringing the total number of employed people to 14,535,500 in November. Meanwhile, the Unemployment Rate dropped to 3.9%, the lowest since March, lower than market estimates of 4.2%.

The US Dollar appreciated due to the hotter-than-expected US Producer Price Index (PPI) report released on Thursday. The US PPI jumped 0.4% MoM in November, the largest gain since June, after an upwardly revised 0.3% increase in October. This reading was better than the 0.2% expected.

The US Federal Reserve (Fed) interest rate decision will take center stage next week. Traders are now fully pricing in a 25 basis point rate cut on December 18, according to the CME FedWatch Tool.

Technical Analysis: Australian Dollar maintains its position above 0.6350, yearly lows

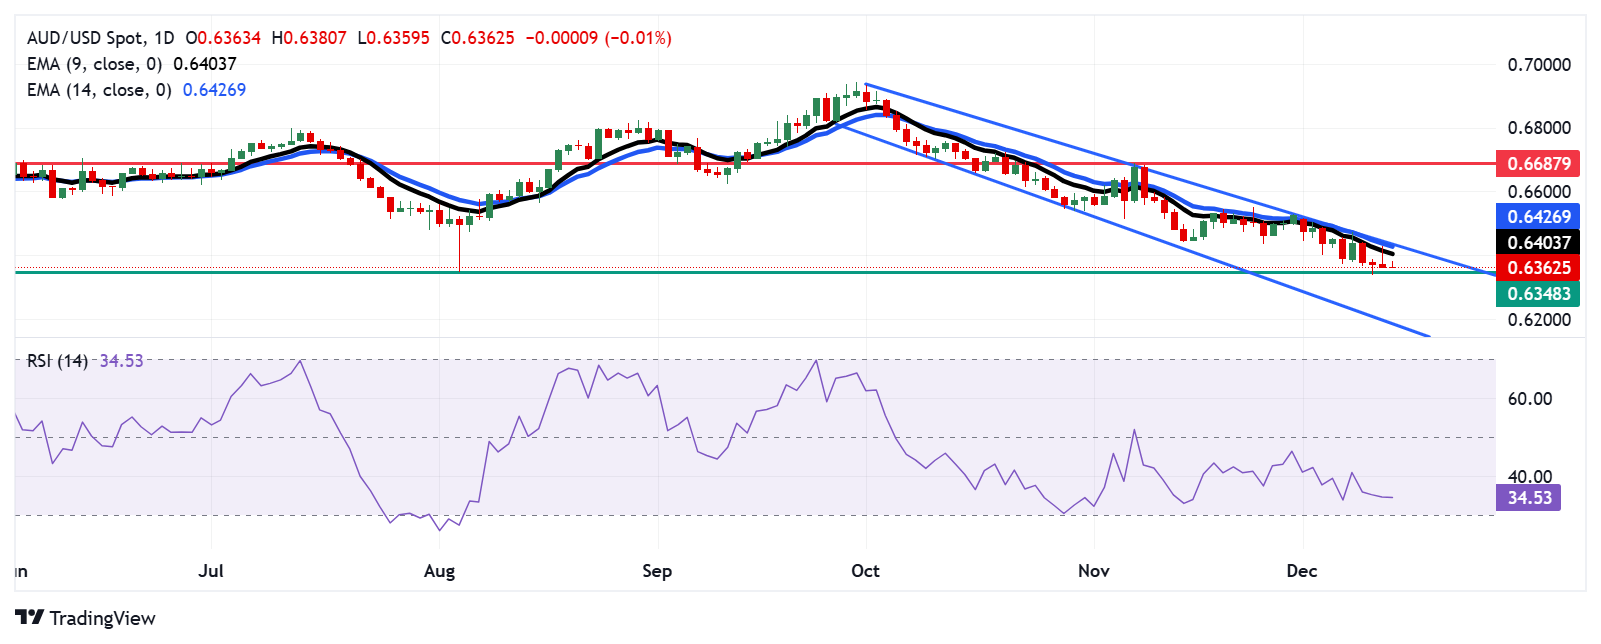
The AUD/USD pair hovers near 0.6360 on Friday. The daily chart analysis suggests a strengthening bearish bias as the pair moves downwards within a descending channel pattern. The 14-day Relative Strength Index (RSI) also remains slightly above the 30 level, indicating sustained bearish momentum.

The yearly low of 0.6348, last seen on August 5, serves as immediate support. A successful break below this level could strengthen the bearish bias and lead the AUD/USD pair toward the descending channel’s lower boundary around the 0.6190 level.

On the upside, the AUD/USD pair may find initial resistance around the nine-day Exponential Moving Average (EMA) at 0.6404. The next barrier appears at the 14-day EMA at 0.6427, which is aligned with the upper boundary of the descending channel. A decisive breakout above this channel could drive the pair toward the seven-week high of 0.6687.

AUD/USD: Daily Chart

USD/INR resists to rise further due to possible RBI intervention

USD/INR resists to rise further due to possible RBI intervention

The Indian Rupee (INR) extends losses for the second successive session, hovering near fresh record lows on Friday. The upside of the USD/INR pair could be attributed to the stronger US Dollar (USD) amid Trump’s tariff threats.

Asian currencies are under pressure amid a weaker offshore Chinese Yuan (CNH), driven by remarks from a senior trade adviser to US President-elect Donald Trump. The adviser warned China against currency manipulation, according to a Reuters report.

The INR may also face challenges following the appointment of bureaucrat Sanjay Malhotra as the next RBI Governor, which prompts traders to raise their bets on the interest rate cuts. Additionally, India’s retail inflation moderated to 5.48% in November, from October’s 14-month high of 6.21%, helped by slowing food prices, boosting expectations of an RBI’s interest rate cut in the February policy review.

The downside of the Indian Rupee might be capped by the foreign exchange intervention by the Reserve Bank of India (RBI). The Indian central bank often intervenes by managing liquidity, including selling USD to prevent steep INR depreciation.

Technical Analysis: USD/INR marks fresh highs near 85.00

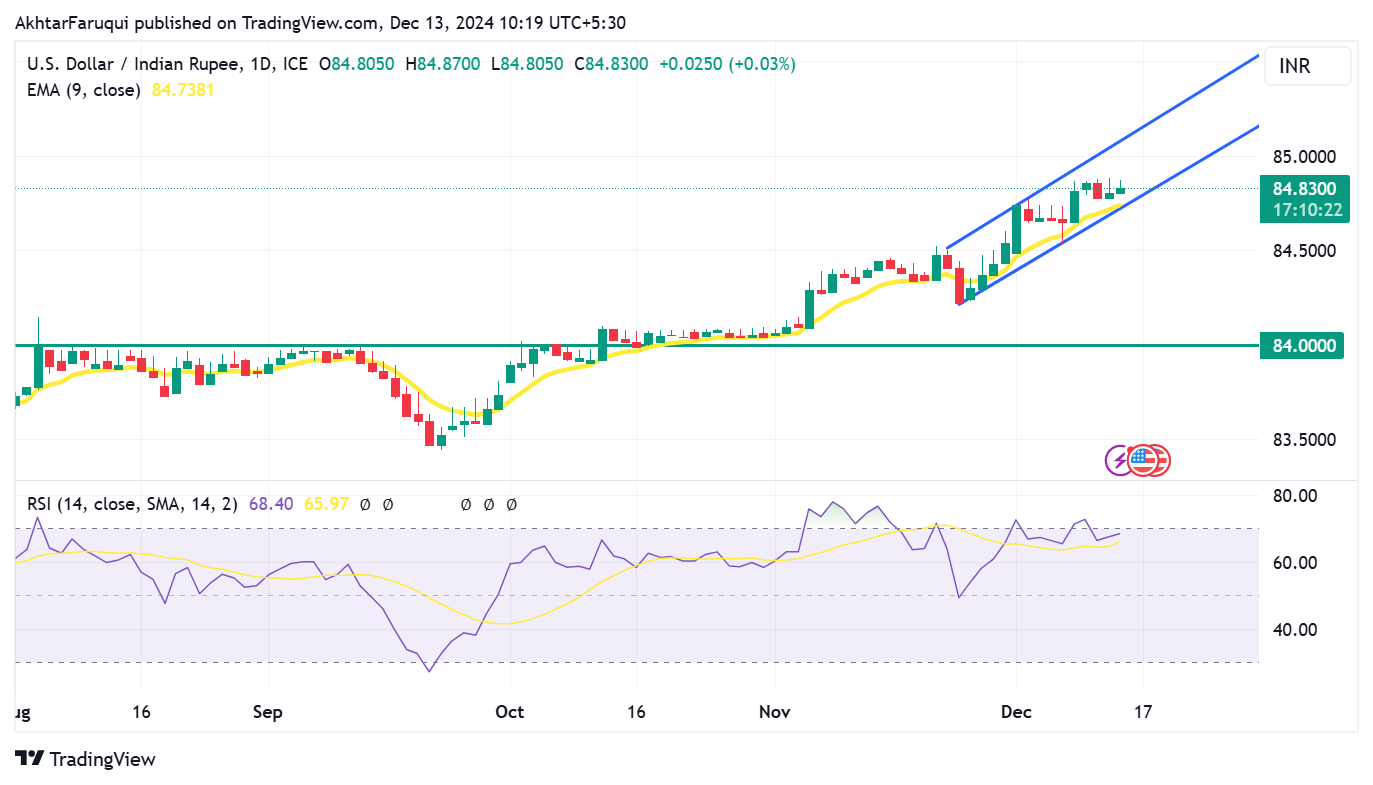
The Indian Rupee remains subdued near its all-time lows against the US Dollar on Friday. The USD/INR pair trades around 84.80 on Friday, with a technical analysis of the daily chart suggesting a strengthening bullish bias. The pair moves upwards within an ascending channel pattern, with the 14-day Relative Strength Index (RSI) positioning slightly below the 70 level.

The USD/INR pair may attempt to surpass its all-time high of 84.88, recorded on December 12. A breakout above this level could allow the pair to test the upper boundary of the ascending channel, situated near 85.10.

The initial support could be found at the nine-day Exponential Moving Average (EMA) of 84.73 level, which aligns with the lower boundary of the ascending channel near the psychological level of 84.70.

USD/INR: Daily Chart

GBP/USD depreciates to near 1.2650 ahead of UK monthly GDP

GBP/USD depreciates to near 1.2650 ahead of UK monthly GDP

GBP/USD holds losses for the third successive day, trading around 1.2660 during the Asian hours on Friday. The pair depreciates as the potential tariff threats from Trump’s administration have boosted the US Dollar across the board and created a headwind for the risk-sensitive British Pound.

GBP/USD registered small losses on Wednesday but didn’t have a difficult time holding its ground. The pair trades modestly higher on the day above 1.2750 on Thursday and the technical outlook suggests that the bullish bias remains intact in the near term.

The US Dollar outperformed its major rivals midweek following the inflation report. The Bureau of Labor Statistics (BLS) reported that the Consumer Price Index (CPI) and the core CPI both increased by 0.3% on a monthly basis, matching market forecasts.

Later in the day, the BLS will publish the Producer Price Index (PPI) data for November and the US Department of Labor will release the weekly Initial Jobless Claims figures. Markets expect the number of first-time applications for unemployment benefits to decline to 220,000 from 224,000. In case this data arrives above 230,000, the USD could come under pressure and help GBP/USD push higher.

Meanwhile, US stock index futures were last seen losing between 0.2% and 0.3%. A bearish opening in Wall Street could cap GBP/USD’s upside in the early American session.

Investors will also pay close attention to the European Central Bank’s (ECB) policy announcements. A dovish ECB surprise, be it a 50 basis points (bps) rate cut, or a 25 bps cut with a dovish policy statement, could trigger a Euro selloff. In this scenario, Pound Sterling could capture capital outflows out of the Euro and stay resilient against the USD.

China’s Commerce Ministry: Open to communication with Trump administration’s economic, trade team

China’s Commerce Ministry: Open to communication with Trump administration’s economic, trade team

Chinese Commerce Ministry said in a statement on Thursday that “China is open to contact and communication with the Trump administration’s economic and trade team.”

Commenting on Australian lobster imports, the Ministry said that “China and Australia are still in technical talks.”

Market reaction

AUD/USD stalls its recovery following these comments, currently trading at 0.6415, still up 0.75% on the day.

EUR/USD extends gains above 1.0500 ahead of ECB policy announcements

EUR/USD extends gains above 1.0500 ahead of ECB policy announcements

EUR/USD stretches higher above 1.0500 in the European session on Thursday amid a broad US Dollar retreat. However, the upside could be capped amid expectations for more ECB rate cuts in 2025. ECB policy announcements and Lagarde’s press conference are on tap.

EUR/USD was last seen trading near 1.0520, where the 100-period Simple Moving Average (SMA) on the 4-hour chart meets the Fibonacci 23.6% retracement of the latest downtrend. If this level stays intact as resistance, the pair could push lower toward 1.0440 (static level) and 1.0400 (end-point of the downtrend).

In case EUR/USD stabilizes above 1.0520, technical sellers could be discouraged and open the door for a leg higher toward 1.0600 (Fibonacci 38.2% retracement) and 1.0620 (200-period SMA).

EUR/USD extended its weekly slide and dropped below 1.0500 on Wednesday. Despite recovering back above this level, the pair struggles to gather momentum as investors await the European Central Bank’s (ECB) policy announcements.

The US Dollar preserved its strength and caused EUR/USD to stretch lower after the US Bureau of Labor Statistics reported on Wednesday that the Consumer Price Index (CPI) and the core CPI both rose 0.3% on a monthly basis in November, matching market expectations.

The ECB is forecast to lower key rates by 25 basis points (bps) following the last policy meeting of the year. In case the ECB opts for a 50 bps cut, the Euro is likely to come under heavy selling pressure with the immediate reaction. Similarly, a 25 bps cut, accompanied by a dovish language that suggests additional rate cuts will be on the table at the upcoming meetings, could cause EUR/USD to turn south.

On the flip side, EUR/USD could extend its recovery in case the ECB approaches further policy easing in a cautious way, voicing concerns over possible inflation shocks next year.

The US economic calendar will feature weekly Initial Jobless Claims and Producer Price Index data for November. Investors, however, are likely to stay focused on the ECB event and ignore these releases.

DXY: Head and shoulders pattern appears to have formed

DXY: Head and shoulders pattern appears to have formed

US Dollar (USD) traded a subdued range overnight in absence of key catalyst. Fedspeaks go into blackout so that puts the focus on data before FOMC next Thursday (19 December). DXY was last at 106.35, OCBC’s FX analysts Frances Cheung and Christopher Wong note.

A bearish setup arises on the charts

“This week, we have CPI on Wednesday and PPI on Thursday. A 25bp cut is more or less a done deal for December meeting unless US CPI unexpectedly surprises a lot to the upside. We would be keen to see the dot plot guidance for 2025. Fed fund futures are implying about 3 cuts for 2025, slightly less than the previous dot plot of 4 cuts that was penciled in for 2025.”

“Daily momentum is mild bearish while RSI is flat. Head and shoulders pattern appears to have formed with DXY testing the neckline (which was respected last Friday). This is typically a bearish setup. A decisive break below neckline should see bears gather momentum.”

“Support at 105 levels (38.2% fibo retracement of Sep low to November high), 104.60 (50 DMA) and 104.10 (200 DMA, 50% fibo). Resistance at 106.70 (second shoulder).”

NZD/USD hangs near two-week low touched on Monday, holds above 0.5800 mark

NZD/USD hangs near two-week low touched on Monday, holds above 0.5800 mark

The NZD/USD pair struggles to capitalize on the previous day’s bounce from the vicinity of the 0.5800 mark or a near two-week low and attracts fresh sellers on Tuesday. Spot prices retain intraday bearish bias through the first half of the European session and currently trade around the 0.5825-0.5820 region, within striking distance of a one-year trough touched in November.

The New Zealand Dollar (NZD) continues to be undermined by expectations for a more aggressive policy easing by the Reserve Bank of New Zealand (RBNZ). Adding to this, disappointing readings on China’s exports and imports added to worries about a fragile recovery in the world’s second-largest economy, which further undermined demand for antipodean currencies, including the Kiwi. This, along with a modest US Dollar (USD) uptick, exerts additional pressure on the NZD/USD pair.

In fact, the USD Index (DXY), which tracks the Greenback against a basket of currencies, looks to build on the post-NFP bounce from a nearly one-month low amid bets that the Federal Reserve (Fed) will adopt a cautious stance on cutting interest rates. Moreover, the worsening Russia-Ukraine war and persistent geopolitical tensions in the Middle East drive some haven flows towards the buck. This, along with concerns about US President-elect Donald Trump’s tariffs, weighs on the NZD/USD pair.

The aforementioned fundamental backdrop suggests that the path of least resistance for spot prices remains to the downside, though traders might await the release of the US consumer inflation figures on Wednesday. The crucial US Consumer Price Index (CPI) report will be looked for cues about the interest rate outlook in the US and guide Fed policymakers on their decision later this month. This, in turn, will influence the USD price dynamics and provide a fresh impetus to the NZD/USD pair.

GBP/JPY rises above 193.00 due to uncertain expectations surrounding BoJ rate hike

GBP/JPY rises above 193.00 due to uncertain expectations surrounding BoJ rate hike

GBP/JPY extends its gains for the second successive session, trading around 193.10 during the European hours on Tuesday. The recent upward movement in the GBP/JPY cross is likely driven by a weaker Japanese Yen (JPY), stemming from mixed expectations regarding a potential Bank of Japan (BoJ) rate hike in December.

BoJ Governor Kazuo Ueda recently indicated that the timing for the next rate hike is nearing, bolstered by strong underlying inflation data in Japan. This has fueled speculation about a possible rate hike during the BoJ’s December 18–19 policy meeting.

However, conflicting media reports suggest the BoJ might forgo a rate hike this month. Adding to the uncertainty, dovish BoJ board member Toyoaki Nakamura has cautioned against premature rate increases, further weighing on the Japanese Yen.

The Pound Sterling (GBP) gains ground against its major peers as investors become increasingly confident that the Bank of England (BoE) will maintain its current interest rates at 4.75% in the monetary policy meeting on December 19.

Most BoE officials are anticipated to vote for an unchanged interest rate, as UK headline inflation has risen again after briefly falling below the bank’s 2% target. The BoE had previously forecasted a rebound in inflation after it temporarily aligned with the desired range.