gold cot chart

Gold Price Forecast: US Jobs Report in Focus as Traders Digest FOMC

Gold prices are moderating after falling nearly 1% on Wednesday in response to the FOMC decision. The US central bank hiked its benchmark rate by 75 basis points in a widely expected move. Fed Chair Jerome Powell pushed back on the narrative that the Fed would pause rate hikes, stating: “It’s very premature, in my view, to think about or to be talking about pausing our rate hikes.” Mr. Powell went on to say that rates will most likely have to go higher than previously forecasted. Fed funds futures moved to price a 5% terminal rate at the May 2023 meeting.

Gold prices fell on those comments. Treasury yields and the US Dollar rose, reducing the yellow metal’s investment appeal. The US Dollar DXY Index and mid- to long-term Treasury rates remain below their recent highs despite a modest increase in Fed rate hike bets. Assuming the US Dollar and rates across much of the curve remain off their highs, bullion prices should hold above recent lows around 1,615 to 1,617.

Still, downside risks remain, and because the Fed’s outlook relies on economic data, gold prices are largely driven by how the market thinks the Fed will interpret and act on that data. A resilient US labor market has complicated central bank efforts to lower inflation. While interest rates take longer to affect the jobs market, data such as job openings and initial jobless claims have not yet signaled a turn. According to the Job Openings and Labor Turnover Survey (JOLTS) for September, job openings accelerated to 10.72 million, beating the +10 million estimate and up from an upwardly revised 10.28 million in August.

That said, the US non-farm payrolls report (NFP) on Friday offers gold’s next directional cue. According to a Bloomberg survey, analysts expect the US to add 200k jobs for October. That would be the weakest growth since December 2020, likely cooling Fed rate hike bets and dragging the USD and yields lower, a positive outcome for gold. The downside risk would be a stronger-than-expected number.

Gold – Speculator Positioning

Gold speculator trimmed their bullish bets on the metal, according to the latest Commitments of Traders report (COT) from the CFTC. For the week ending October 25, non-commercial shorts rose by 9,990, while longs held virtually unchanged. Those trades brought gold’s net long position to 59,342, the lowest since September, which was the weakest long position since April 2019.

Gold Versus Non-Commercial Long/Short Positions

gold cot chart

XAU/USD Technical Outlook

Gold is trading around 0.3% higher in Asia-Pacific trading, which trims the weekly loss to about 0.25%. A potential Double Bottom reversal is in play, which may mark the reversal point of a long-term downtrend. Prices need to break above resistance—the peak between the September and October troughs at 1,729.46—before a breakout is likely.

First, prices would need to clear the descending trendline and the 50-day Simple Moving Average (SMA). The measured move (distance between troughs and peak) puts the breakout target at 1,840.75. If prices fall below the troughs, it would invalidate the pattern. A positive divergence in the Relative Strength Index (RSI) lends support to a bullish outlook.

XAU/USD Daily Chart

Chart, line chart  Description automatically generated


Why Fed rate rises are a self-harming process

Federal Reserve interest rate hikes are painful for the economy. But they are also painful for the Federal Reserve itself. There are two elements here: 1. The return on the Fed’s bond holdings, and 2: Interest rate payments that the Fed itself needs to pay.

Both of these are off the charts and implicate the Fed in a self-harming process that’s far from complete. Let’s take these one at a time.

First to the Fed’s bond holdings. These have rocketed through various iterations of emergency bond buying (the Great Financial Crisis and the pandemic), and have left the Fed with a large bond portfolio on its hands. Total returns on bonds for 2022 are the worst on record for modern times, with Fed hikes a key driver. US Treasuries are running on returns of some -14% year-to-date. Applying this to the Fed’s holdings shows a remarkably large negative total return of approaching USD 1trn so far in 2022 (annualised) when the Treasury and Mortgage-Backed Security holdings are aggregated.

US Treasuries are down 14% so far in 2022

At first sight, this looks quite severe. However, for now, this is no more than a paper return and accounting treatment would determine whether the numbers are impactful or not. And they should not be, to the extent that bonds eventually roll off at par, and are held on an amortised cost basis. Another measure of pain in the book might be to look at the average price, which is currently at around 93 on the dollar, a 7% price discount. The longer-dated holdings are at a much deeper discount, but as long as coupons are paid and redemption is met by the US Treasury, there is no material issue.

The Federal Reserve’s net income for 2021 showed a figure of USD 108bn, up some USD 19bn from 2020, and the bulk of this increase was from interest income – effectively coupon payments – on its bond holdings. Even if bond prices fall, they will still pay coupon payments. And to that extent, the bond portfolio continues to make a net positive interest rate contribution. Consequently, it’s worth noting the valuations, but it should not prove to be destabilising and in many ways, it’s a reversal of the positive returns seen in previous years, as you can see in the chart below.

Estimated rolling total returns from the Fed’s holding of bonds

USD bn, annualised

Source: ING estimates, The Federal Reserve, Macrobond
Secondly, there are the payments the Fed makes to eligible counterparties that park cash with them. There are two main routes here. First is the rate paid on excess reserves. Before the Great Financial Crisis, only regulatory reserves were compensated. But that changed as the Fed used the rate on excess reserves as a means to control front-end market rates, helping to ensure that the effective funds rate continued to trade within the ceiling and floor funds rates. The cost of doing so was minimal, as rates were on the floor and the Fed started by paying 25bp on excess reserves.

Fast forward to today though and the rate paid on excess reserves is 3.15%. Moreover, it will be 75bp higher post the 2nd November FOMC meeting, and the market discounts that it gets will be quite close to 5%. On top of that, the volume of excess reserves is now massive, at around USD 3trn. On an annualised basis, the remuneration cost to the Fed at this window is approaching USD 100bn. At the beginning of the year, it was below USD 10bn.

The Fed is now paying $170bn on cash parked with it, up from below $10bn

Reserves are off their highs though, down from a peak in the USD 4trn area. But this has been facilitated by a rocketing in cash going back to the Fed on the reverse repo facility. That’s gone from practically zero at the beginning of the year to over USD 2trn currently. It gets renumerated at a rate of 3.05%, and again that continues to rise in line with official rates. Based on where we are now, the annualised remuneration in this window amounts to around USD 75bn. In total, the Fed is paying some USD 170bn on these windows combined, as we illustrate below.

USD bn, annualised

Source: ING estimates, The Federal Reserve, Macrobond
ING estimates, The Federal Reserve, Macrobond

On the other side of the balance sheet, the Fed can offset some of that through interest rate receipts on other facilities. In fact, the bond portfolio is the largest contributor. If we take a simple back-of-the-envelope average coupon of 2% on a combined USD 7.5trn bond portfolio, that would provide an interest rate receipt of some USD 150bn. That almost covers it. But note that if key rates head towards 5%, that will add an additional interest rate cost of some USD 100bn, which is approximately the size of the Fed’s total net income for 2021.

At the end of 2021, the Fed’s interest rate cost on the reserves and reverse repo windows was less than USD 10bn, and the Fed had a net income of USD 108bn for 2021. The simple running yield coming from coupon payments was in the region of USD 150bn. For 2022, that running coupon income is broadly similar, and actually a tad lower as USD 95bn per month of bonds is rolling off the front end. But the remuneration the Fed will pay out on the reserves and reverse repo windows rockets to an average of a little over USD 100bn for 2022 as a whole, moving the Fed into the red.

The Fed’s running payout on cash parked with it approaches $250bn by December

Moreover, it ends the year running at around USD 250bn, painting an even heavier picture for 2023. That’s an additional USD 150bn running cost to be paid versus now. Under Fed accounting rules they would build an equal and opposite offsetting deferred asset, which would be paid down once the Fed returns to a net income position. But it still flips the Fed from being in a comfortable black position to being deep in the red.

Does all of this matter? Well, the annualised journey over the next few months in terms of net income won’t be pretty. Putting some round numbers on it, the swing factor likely sums to an annualised running USD 100-150bn hole at the Fed. At least until the Fed cuts rates in 2023. We think they will, and that will help. The Fed’s ongoing roll-off of bonds from its balance sheet will also help, as it will reduce excess liquidity in the system, likely prompting less parking of cash at the Fed’s reverse repo window.


French new factory orders slump at fastest rate since May 2020 as uncertainty and inflation take their toll

French manufacturing sector business conditions
deteriorated at a faster pace at the start of the fourth
quarter, latest PMI
® data from S&P Global showed, as new
orders slumped to an extent rarely seen since data were
first collected in 1998. As a result, production volumes fell
sharply and businesses remained pessimistic towards the
year ahead. October survey data also highlighted a survey-
record accumulation of finished goods stocks as companies
struggled to ship their products.
Meanwhile, French manufacturers remained stuck with
elevated cost pressures. High energy prices were frequently
mentioned by survey respondents. Output price inflation also
remained historically high, despite slowing to a 14-month
low.
The seasonally adjusted S&P Global France Manufacturing
Purchasing Managers’ Index ® (PMI ®
) posted below the 50.0
no-change mark for a second month in a row, indicating
back-to-back deteriorations in the health of France’s goods-
producing sector. At 47.2 in October, the headline measure
fell from 47.7 in September to its lowest level in almost two-
and-a-half years.
French manufacturing output volumes declined in October,
extending the current downturn that began in June. The
rate of contraction was of a similar strength to that seen
in September, which was the sharpest since May 2020.
Companies that cut their output levels commented on weak
demand and persistent supply issues.
October survey data pointed to a rapid deterioration in
new factory orders across France. The decrease was
among the fastest seen since data were first collected in
1998, with panel comments attributing the sales slump to
subdued underlying demand conditions, high inflation and
overstocked clients. Weak economic conditions abroad also
drove a sharp decline in new export orders at the start of the
fourth quarter.

Shop Prices Grow At Fastest Monthly Rate

It has been a difficult month for consumers who not only faced an increase in their energy bills, but also a more expensive shopping basket. Prices were pushed up because of the significant input cost pressures faced by retailers due to rising commodity and energy prices and a tight labour market. Even the price of basic items went up, with the price of the humble cuppa rising, as tea bags, milk and sugar all saw significant rises. While some supply chain costs are beginning to fall, this is more than offset by the cost of energy, meaning a difficult time ahead for retailers and households alike. With Christmas fast

AUD/USD and NZD/USD Fundamental Daily Forecast – NZ Jobless Rate Stays Near Record Low, Wages Rise

The New Zealand and Australian Dollars are inching higher early Wednesday as investors adjust positions ahead of today’s major U.S. Federal Reserve monetary policy and interest rate decisions.  The announcements will be made at 18:00 GMT.

The Fed is widely expected to raise interest rates by 75-basis points and then signal that it could reduce the size of its rate hikes starting as soon as December. The key word is “could”. This means traders are going to have to interpret the tone of the Fed, which could be the source of volatility later in the session.

Trading Derivatives carries a high level of risk to your capital and you should only trade with money you can afford to lose. Trading Derivatives may not be suitable for all investors, so please ensure that you fully understand the risks involved, and seek independent advice if necessary. A Product Disclosure Statement (PDS) can be obtained either from this website or on request from our offices and should be considered before entering into a transaction with us. Raw Spread accounts offer spreads from 0.0 pips with a commission charge of USD $3.50 per 100k traded. Standard account offer spreads from 1 pips with no additional commission charges. Spreads on CFD indices start at 0.4 points. The information on this site is not directed at residents in any country or jurisdiction where such distribution or use would be contrary to local law or regulation.

At 02:51 GMT, the NZD/USD is trading .5862, up 0.0023 or +0.39% and the AUD/USD is at .6410, up 0.0017 or +0.27%. On Tuesday, the Invesco CurrencyShares Australian Dollar Trust ETF (FXA) settled at $63.33, up $0.04 or +0.06.

New Zealand also released key employment data earlier in the day. The reports showed New Zealand’s job market remained tight in the third quarter, with the unemployment rate remaining near record lows and wages soaring.

New Zealand’s Job Market Remains Tight in Third Quarter

According to Stats NZ in a report released early Wednesday, New Zealand’s jobless rate stood at 3.3% in the third quarter, unchanged from the second quarter, while labor underutilization eased slightly.

The underutilization rate, a broader measure of spare labor capacity, dipped slightly to 9.0%, from 9.2% last quarter.

The labor force participation rate rose to 71.7% and the employment rate rose to 69.3%. Both are the highest rates recorded since the job market survey began in 1986, Stats NZ added.

Finally, over the year to the third quarter, the labor cost index increased 3.7%, compared with 3.4% in the prior quarter.

Daily Forecast

All eyes will be on the Fed at 18:00 GMT. We expect the Fed to follow-through with market expectations and announce a 75-basis point rate hike.

We also think Fed Chair Powell, in his post-meeting press conference, will say that policymakers discussed slowing the pace of rate hikes but did not commit to it. Furthermore, he may suggest that the decision to reduce the size of the December rate hike to 50-basis points will be data dependent.

This means traders will be flip-flopping between 75-basis points and 50-basis points in reaction to Friday’s Non-Farm Payrolls report and next week’s consumer inflation report. The Fed will also be monitoring growth data such as PMI and GDP reports.

We’re probably going to enter a period of heightened volatility because if the Fed can’t commit to a 50-basis point rate hike in December then investors are not likely to commit either until they see how the upcoming reports on labor and inflation play out.

image1.png

Crude Oil Forecast: Brent Bid on Possible Reduction in China’s COVID Policies, API & FOMC

BRENT CRUDE OIL FUNDAMENTAL BACKDROP

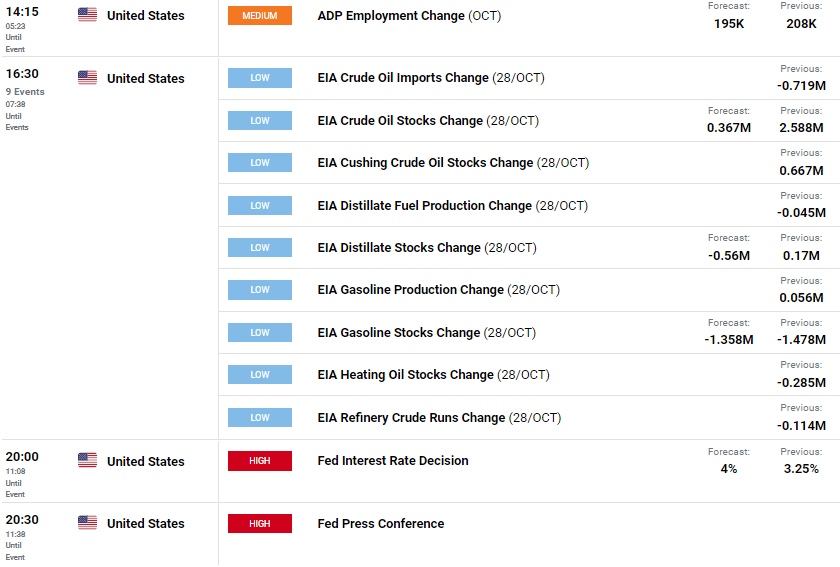
Brent crude oil received a significant lift as we enter November after a surprise miss on the API crude oil weekly stock report yesterday (see economic calendar below). The data showed a decline in inventories by 6.53m barrels per day against a projected increase of 0.267m barrels per day. The EIA release later this evening shows a similar increase estimate with another disappointing print likely extending brent price appreciation.

image1.png

Source: DailyFX economic calendar

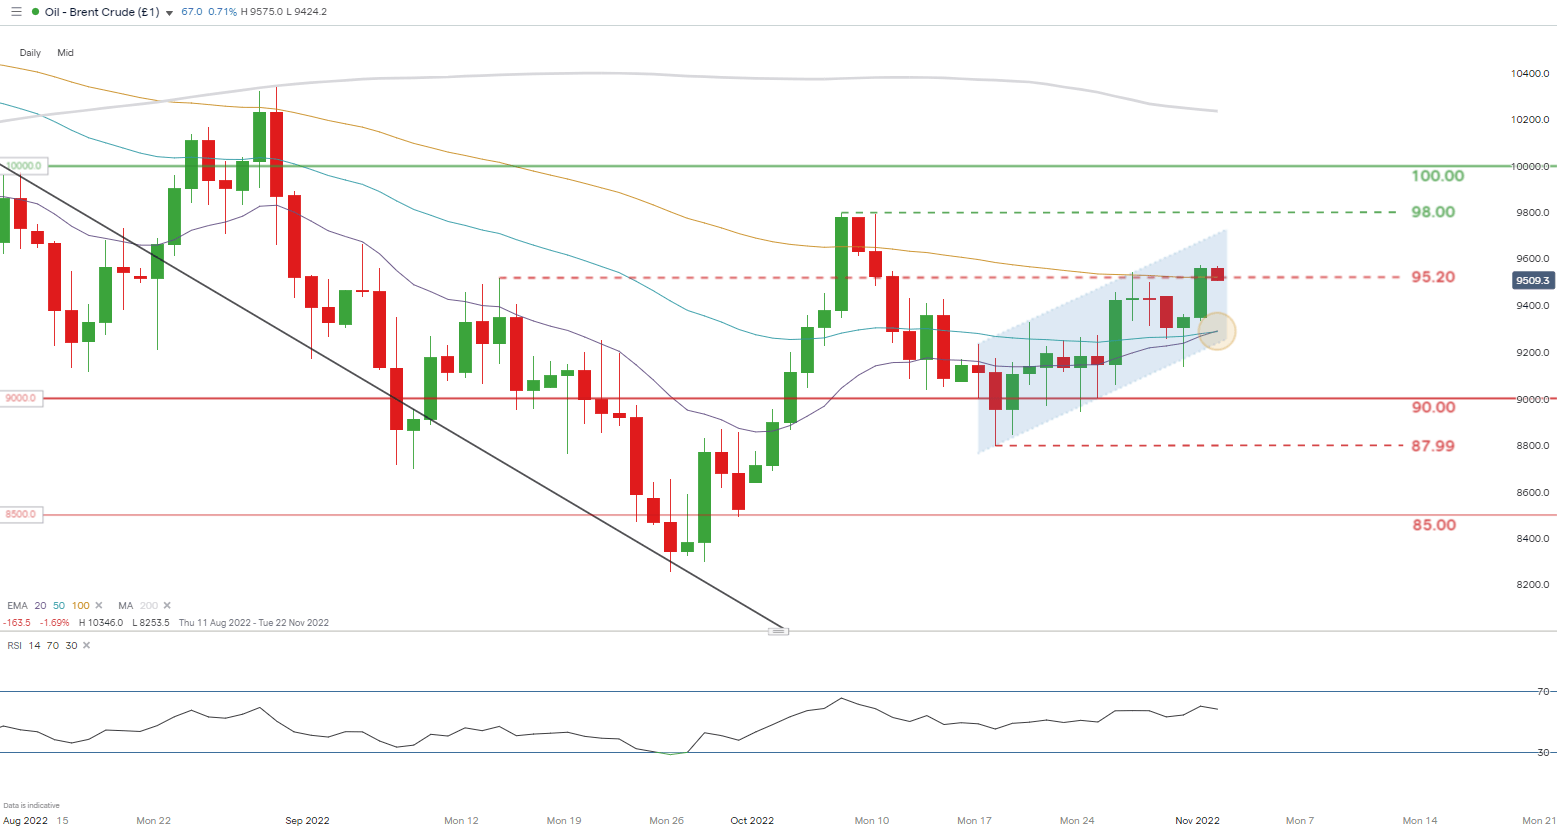
Brent prices gained further traction this morning on the back of unconfirmed news that China may look to ease their ‘zero tolerance’ COVID-19 rules that have plagued the economy as well as contributing to demand destruction limiting upside on global commodities including brent crude.

image2.png

From a dollar perspective, and the focus for today is the Fed’s interest rate decision. Money market are pricing in a 75bps incremental hike with a high degree of probability (98.4%) but markets will shift their attention to the post-announcement press conference. Forward guidance will likely be delivered from this platform and with much talk around a Fed ‘pivot’, any dovish slant to the speech could see the dollar decline giving brent some support.

FEDERAL RESERVE INTEREST RATE PROBABILITIES

image3.png

TECHNICAL ANALYSIS

BRENT CRUDE (LCOc1) DAILY CHART -UNDATED

image4.png

image1.png

USD/JPY Technical Outlook: Growing Chance Uptrend May Pause

USD/JPY SHORT-TERM TECHNICAL FORECAST – NEUTRAL

Tuesday’s retreat from key intraday resistance has raised the odds of a minor setback in USD/JPY.

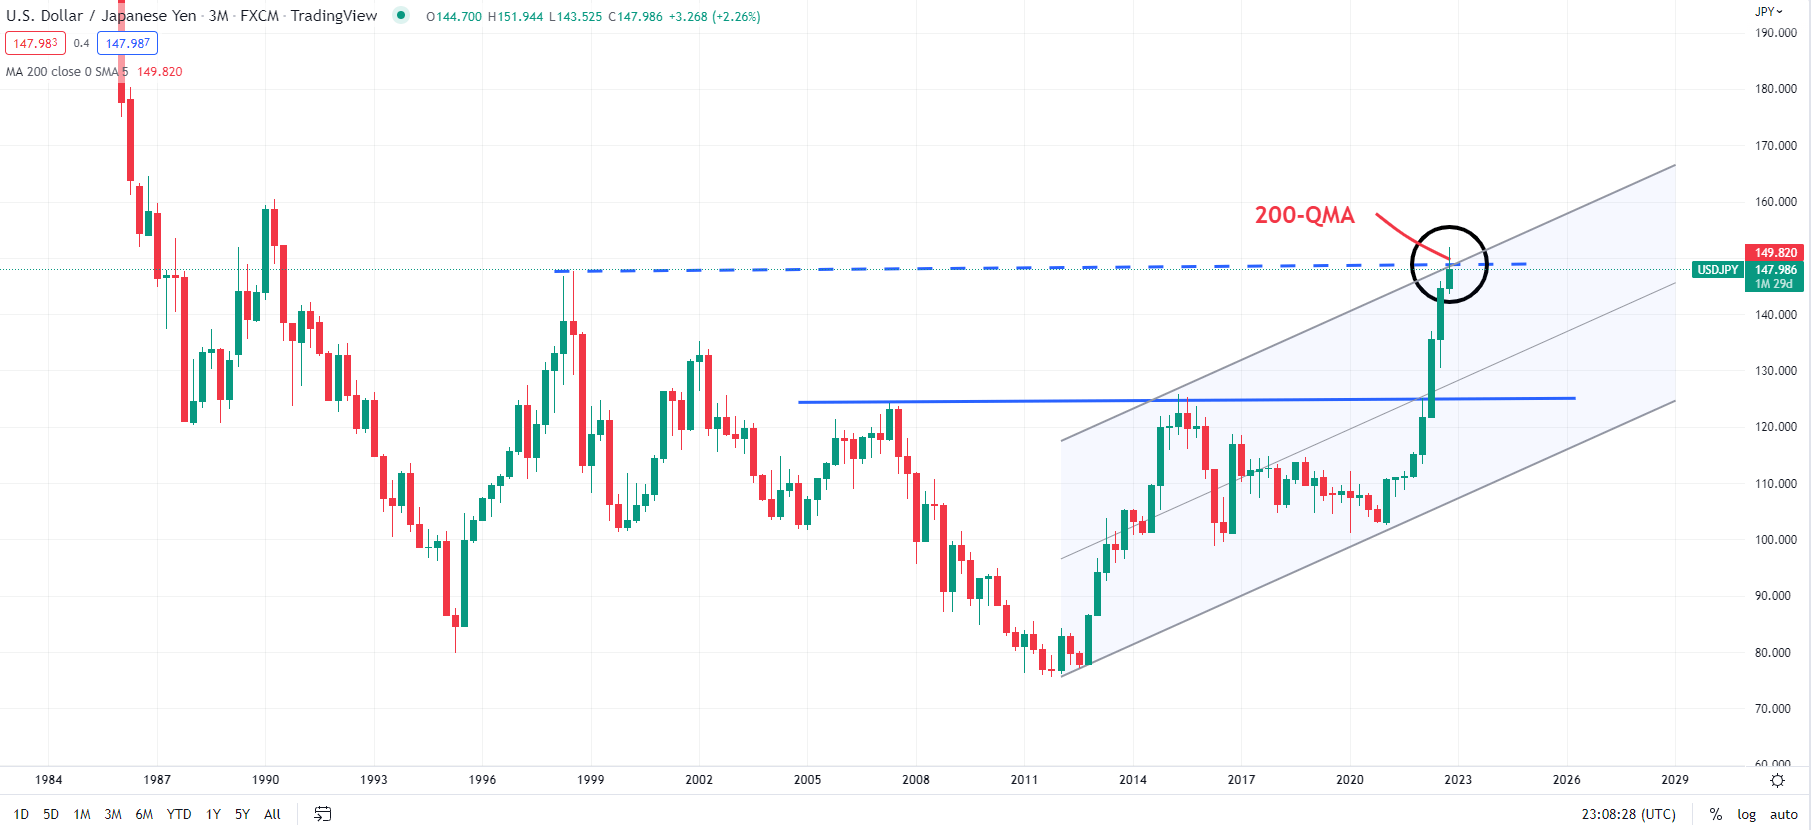
Notwithstanding the recovery in the New York session, USD/JPY continues to hold below key resistance at the October 25 high of around 149.00. This follows a solid bearish reversal on October 21, which came about from a major resistance area: the 1998 high of 147.65, coinciding with the 200-quarter moving average and the upper edge of a rising channel from 2012 (see chart).

USD/JPY Quarterly Chart

image1.png

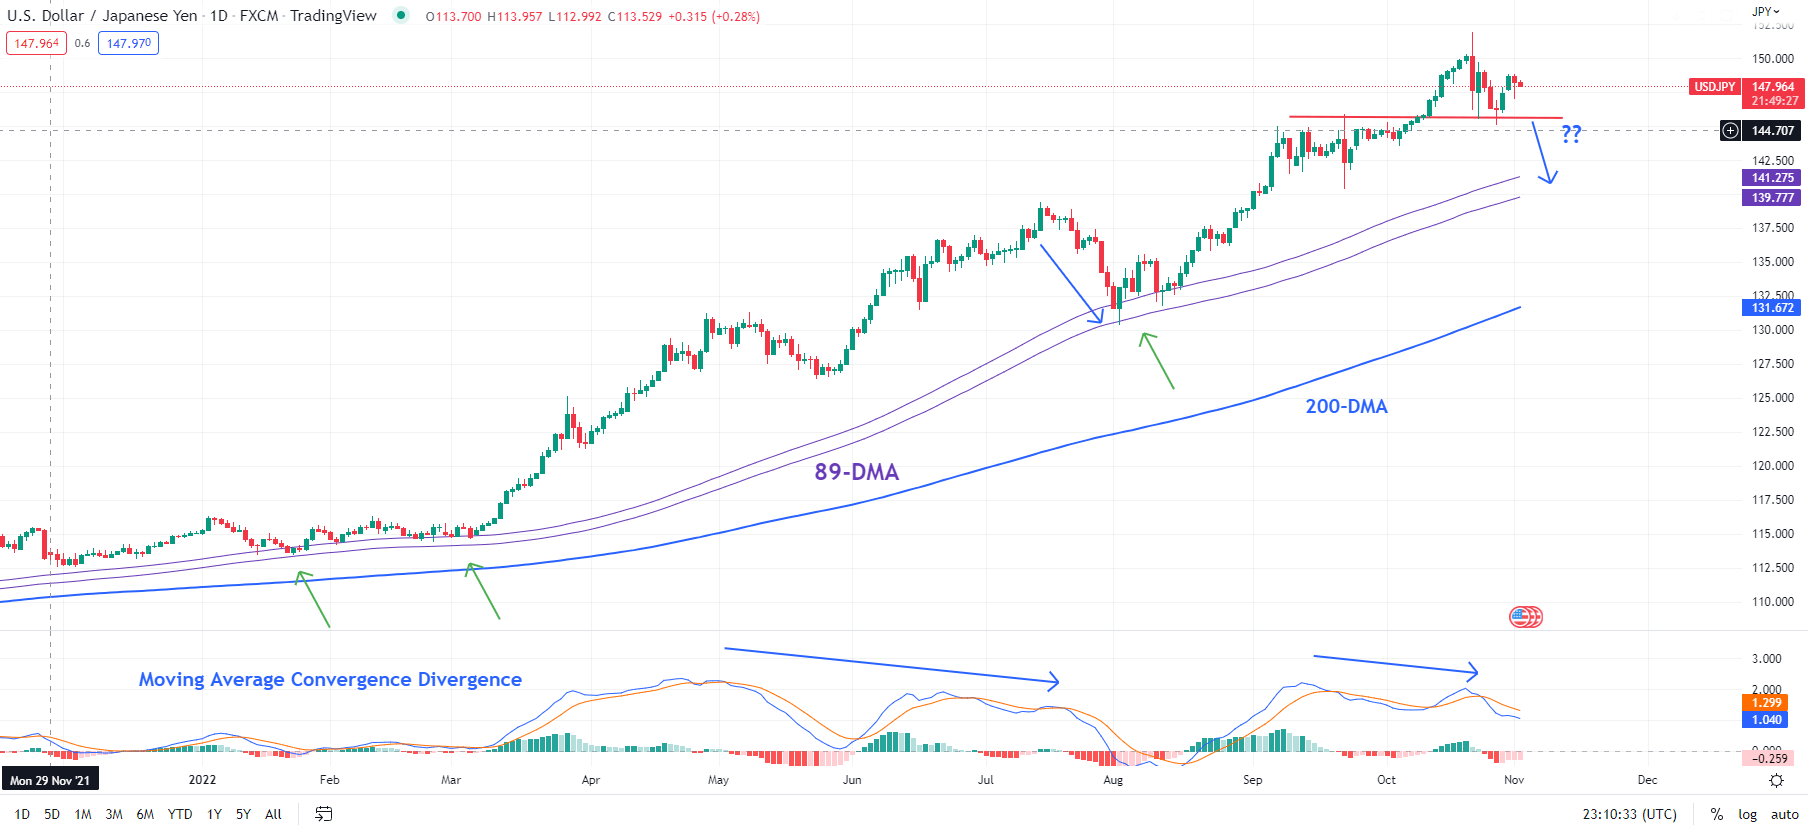
Furthermore, back-to-back long-legged candles on the weekly charts at the October highs reflect indecision at major resistance, especially given the context of the sharp gains in recent months. Greater conviction – that is, big candles with small wicks or none at all – tends to increase the probability of a resistance break. However, small candle bodies with long wicks telegraph reduced chances of an imminent break of resistance, as they tend to reflect a lack of confidence. This is further reinforced by negative divergence on the daily and weekly charts (rising price associated with stalling or declining momentum). That may speak to rally fatigue.

The focus is now on immediate support at the September highs of 145-146. A decisive break below this barrier would confirm that the short-term upward pressure had faded, raising the prospect of some consolidation or a minor retreat. Any further downward pressure could open the way toward the September intervention low of 140.35 near the 89-day moving average (DMA) and the July high. As the chart below shows, the last time USD/JPY was decisively below the average was in early 2021 before the surge began.

USD/JPY Daily Chart

image2.png

Zooming out, any potential setback could be viewed as a correction within an overall uptrend. The upward momentum on longer-term charts, including monthly and quarterly, remains strong, and any retreat could be short-lived. In this regard, a key signpost would be the 89-DMA – USD/JPY would need to break below this threshold for an extended drop toward the 200-day moving average (now at 131.50).

GBP/USD Sentiment Outlook - Bearish

British Pound Outlook: GBP/USD, GBP/JPY May Fall as Retail Traders Boost Long Bets

The British Pound has been enjoying a push higher since prices found a bottom in the middle of September. As GBP/USD and GBP/JPY rallied, retail traders increased their downside exposure, perhaps hoping for a turn lower. This can be seen by looking at IG Client Sentiment (IGCS), which tends to function as a contrarian indicator. Recently, investors have been starting to increase upside exposure. Could this be a sign of weakness to come for GBP?

GBP/USD Sentiment Outlook – Bearish

The IGCS gauge shows that only about 59% of retail traders are net-long GBP/USD. Since most traders are net-long, this suggests that prices may continue falling. Upside exposure has increased by 1.86% and 7.45% compared to yesterday and last week, respectively. With that in mind, the combination of current sentiment and recent changes offers a stronger bearish contrarian trading bias.

GBP/USD Sentiment Outlook - Bearish

Daily Chart

GBP/USD faces the critical long-term falling trendline from the beginning of this year. That has been maintaining the broader downside focus. Meanwhile, near-term rising support from September seems to be offering an immediate upside bias. With that in mind, a breakout seems to be imminent. Clearing the 1.1639 – 1.1738 resistance zone opens the door to facing August highs. On the other hand, falling under rising support opens the door to revisiting the September low down the road.

image2.png

GBP/JPY Sentiment Outlook – Bearish

The IGCS gauge reveals that about 28% of retail traders are net-long GBP/JPY. Since most traders are net-long the currency pair, this suggests that prices may continue rising. The number of traders net-long is 2.56% and 28% higher compared to yesterday and last week, respectively. With that in mind, recent changes in sentiment warn that the price trend may soon reverse lower despite most people being net short.

GBP/JPY Sentiment Outlook - Bearish

Daily Chart

On the daily chart, GBP/JPY appears to be attempting to confirm a breakout under rising support from September. That may open the door to a reversal. Immediate support appears to be the former 167.63 – 168.72 resistance zone. Breaking under the latter may accelerate such a reversal toward the October low. Otherwise, extending gains places the focus on the 78.6% Fibonacci extension at 173.

Daily Chart


image1.png

Gold and Silver Technical Outlook: Upside Could be Capped

GOLD SHORT-TERM TECHNICAL OUTLOOK – NEUTRAL

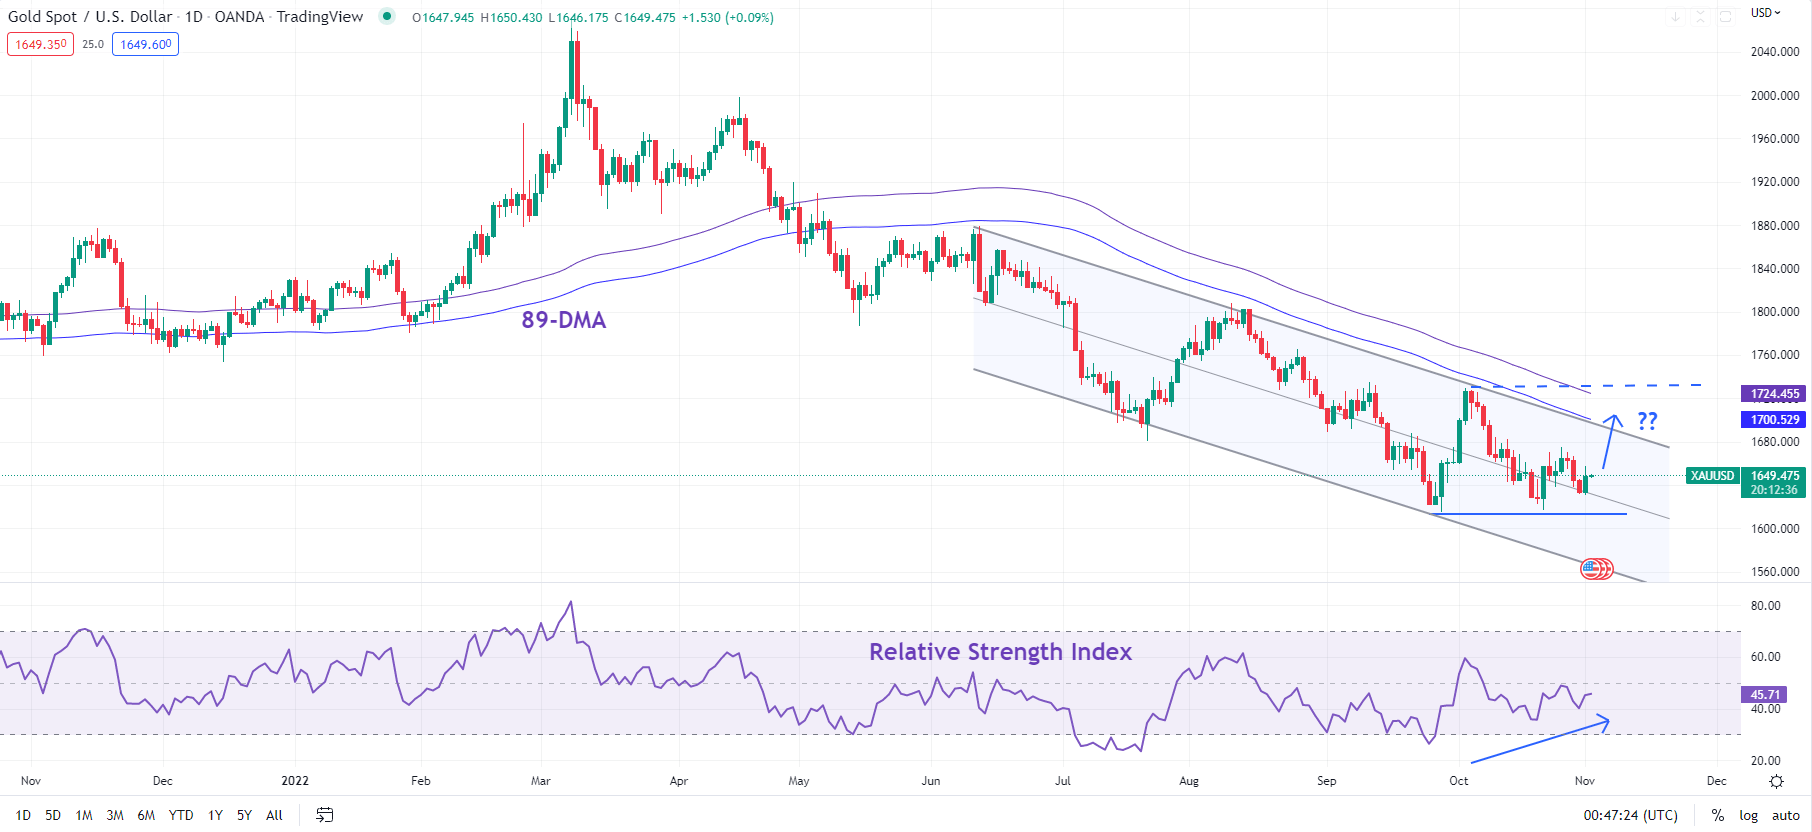
Gold appears to have found a short-term floor and could settle in a range with a modest upward bias in the coming days.

The yellow metal continues to flirt with key converged support: a horizontal trendline from 2021 at about 1675-1680, roughly coinciding with the 200-week moving average. While losses stalling recently could be interpreted as a sign of rejection at lower levels (that is, a lack of conviction below the September low of 1614), it could well be a matter of time before XAU/USD resumes its next leg lower. In this regard, tonight’s US Federal Reserve rate decision and the accompanying tone would be closely watched.

The Fed is widely expected to hike by another 75 basis points after the conclusion of its two-day meeting on Wednesday. If the US central bank doesn’t signal a slowdown in its aggressive monetary tightening cycle, gold could witness a minor relief rally. Markets have been expecting a pivot in the monetary policy after minutes of the last Fed meeting in September stated that participants observed it would become appropriate at some point to slow the pace of rate increases.

XAU/USD Daily Chart

image1.png

Broadly, XAU/USD continues to remain in a range,as highlighted two weeks ago. The upper end of the recent range is at 1725. The lower edge of the range is around 1614. Most recently, positive momentum divergence on the daily charts (falling/sideway price action associated with rising momentum) raises the odds that XAU/USD could rise toward the upper end of the range.

{{GUIDE|HOW_TO_TRADE_GOLD}}

SILVER SHORT-TERM TECHNICAL OUTLOOK – NEUTRAL

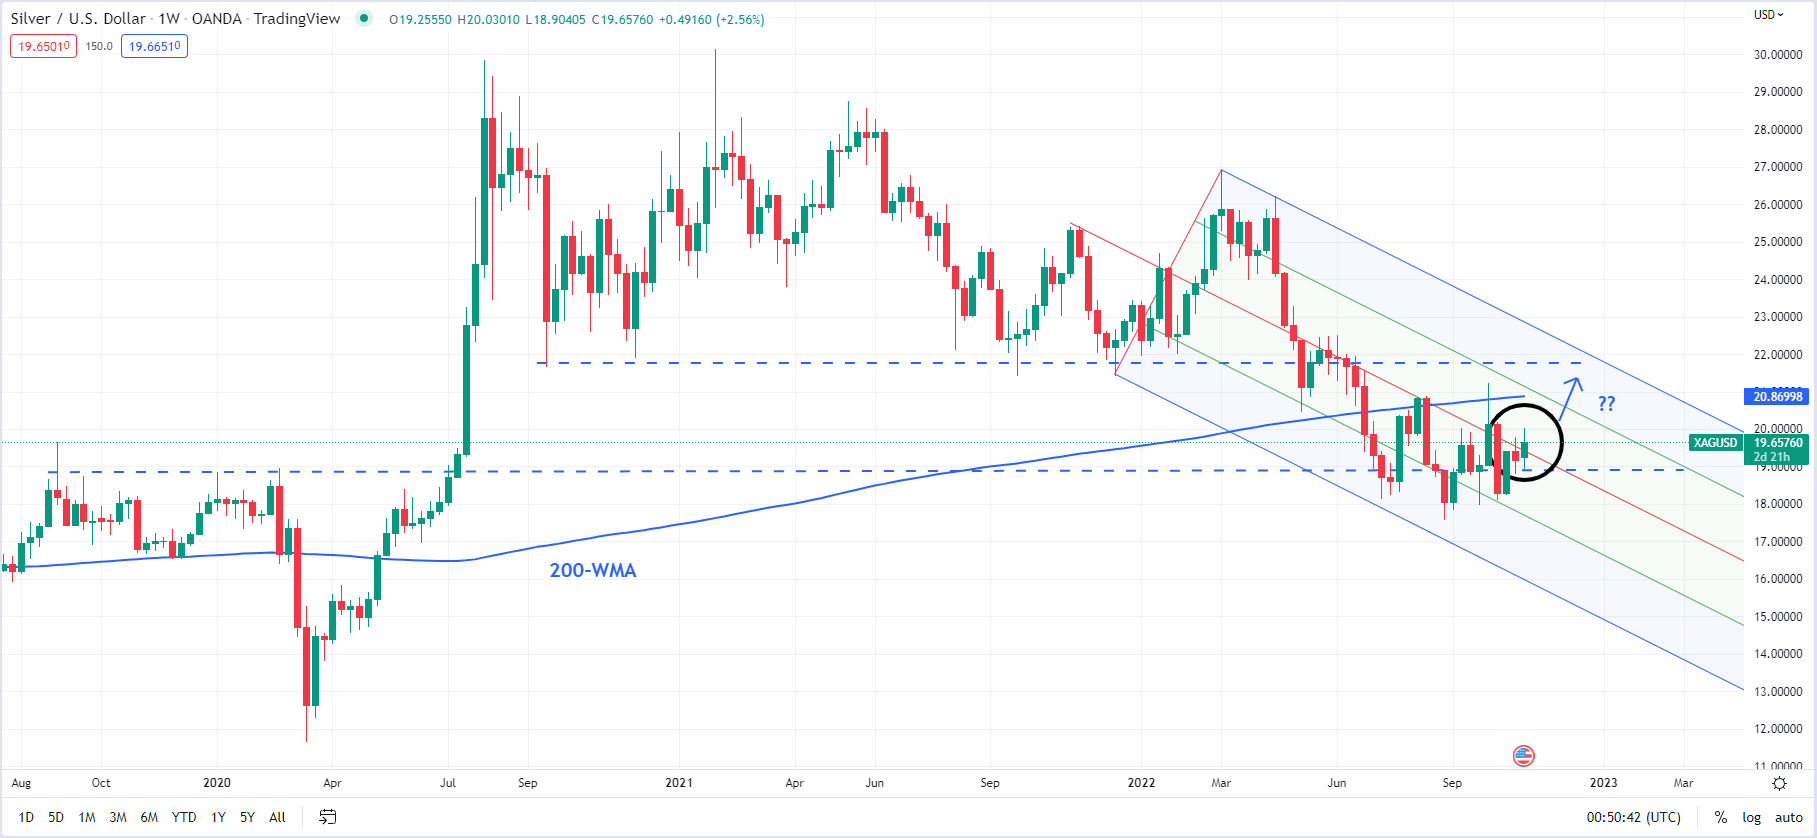
The range in Silver is perhaps more defined compared to gold. Since July, XAG/USD has been hovering in a 17.50-21.25 range, holding above horizontal trendline support from 2019-2020 highs, and the 200-week moving average to cap its upside.

XAG/USD Weekly Chart

image2.png

While the overall bias for Silver continues to be neutral, a minor rally toward the upper edge of the range is possible. After a failed attempt on Tuesday to break above immediate resistance at last week’s high of 19.80, Silver is yet again retesting the resistance. A decisive break above the resistance could push XAG/USD toward 21.25, close to the 200-day moving average (now at about 21.50).

Beyond the short term, however, the balance of risks is tilted towards the downside for XAG/USD. There is tough resistance at 21.25-21.50 (including the 200-day moving average), and Silver would need to break above this resistance for the medium-term downward pressure to fade.