Chart, histogram  Description automatically generated

US Dollar Technical Analysis Ahead of the FOMC Meeting

US Dollar Technical Analysis Ahead of the FOMC Meeting

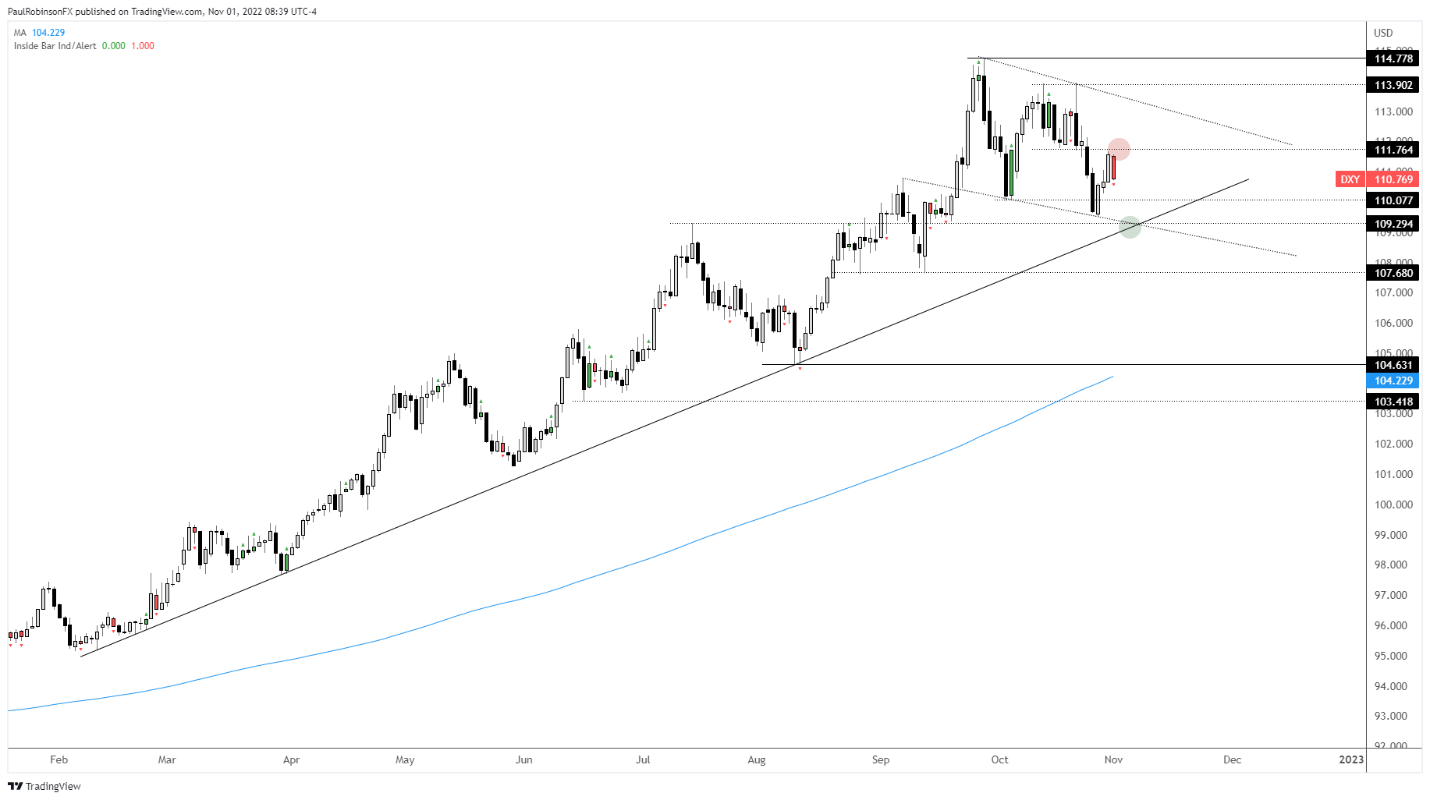
The US Dollar Index (DXY) continues to look vulnerable to more selling as the FOMC outcome nears tomorrow. The overall technical structure is still bearish within the context of a broader uptrend. How far the downward move continues will likely hinge on how support is treated.

Below the recent low there is a slope from early in the year that while not tested on numerous occasions does look sturdy. What helps fortify the trend-line in the low 109s as support is the July high at 10929 and a slope from late September.

A drop into the low 109s and strong rejection, or a breach that is quickly recovered, will keep the DXY downside in check and could signal that the correction is drawing to an end. However, should we see support break then the downside is likely to open up quite a bit.

A break of support could send the DXY down 3-4% more before it finds a low, an outcome we have to be prepared for given how extreme the trend and sentiment was prior to this bout of weakness. Overall, though, the broader uptrend is still up, nothing moves in a straight line.

For now, leaning towards lower levels and a support test at the least. Tomorrow’s Fed outcome could be rather significant in helping determine how levels want to play out.

US Dollar Index (DXY) Daily Chart

Chart, histogram  Description automatically generated


Chart, line chart  Description automatically generated

WTI Oil Poised for Triangle Breakout as Economic Headwinds Mount

Crude Oil is on the march higher this morning following yesterday’s less than stellar start to the week. Losses incurred yesterday were not enough to prevent WTI posting its first month of gains since May. Today’s rally coincided with better-than-expected Caixin Manufacturing PMI numbers out of China, potentially renewing hope around persistent demand concerns.

In a further boost from China in regard to its “Zero-Covid” policy, Chinese city Zhengzhou which plays host to Foxxconn’s iPhone factory announced the loosening of some covid controls from 6AM this morning. There still remains skepticism around demand from China as crude imports in the first three quarters of the year declined for the first time since 2014. YoY imports declining around 4.3%. This is undoubtedly an area of concern as WTI prices look to make their way higher.

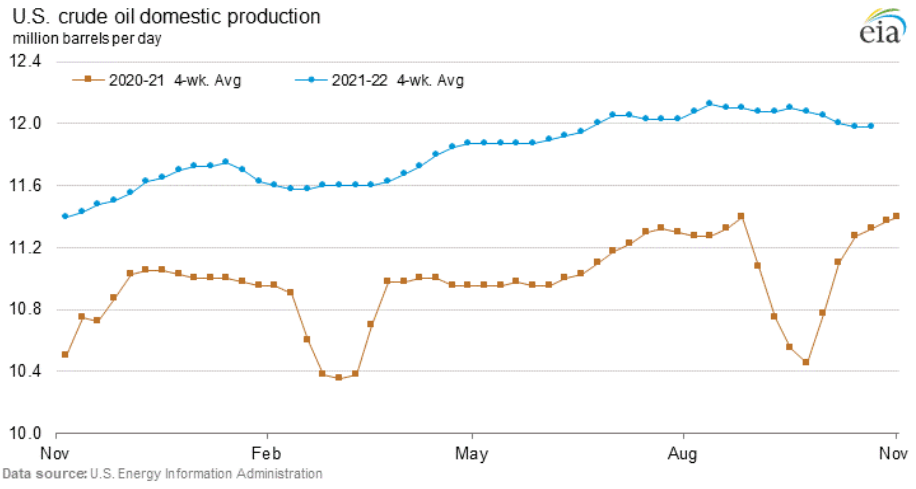
WTI Crude Oil-US Domestic Production

Chart, line chart  Description automatically generated

The continued back and forth between OPEC+ and the United States continues following the announced production cuts on October 5th. The US responded in kind with a 1.9 million barrels release from the strategic petroleum reserve (SPR) last week which did not seem to have the desired effect on oil prices. This comes as US crude production rose 0.9% in August to 11.98 million barrels a day, its highest since the beginning of the pandemic. OPEC+ for its part looks likely to announce further cuts to production moving forward as it expects a slowdown in demand from the Eurozone as a recession looms and winter approaches.

The remainder of the week brings a lot of promise in terms of volatility as well as in regard to WTI’s next move. We first have crude oil inventory data from EIA on Wednesday followed by the Federal Reserve meeting expected to provide clues as to the tightening cycle and US outlook for the rest of the year. Any hint of dovishness from Fed policymakers could propel WTI higher.

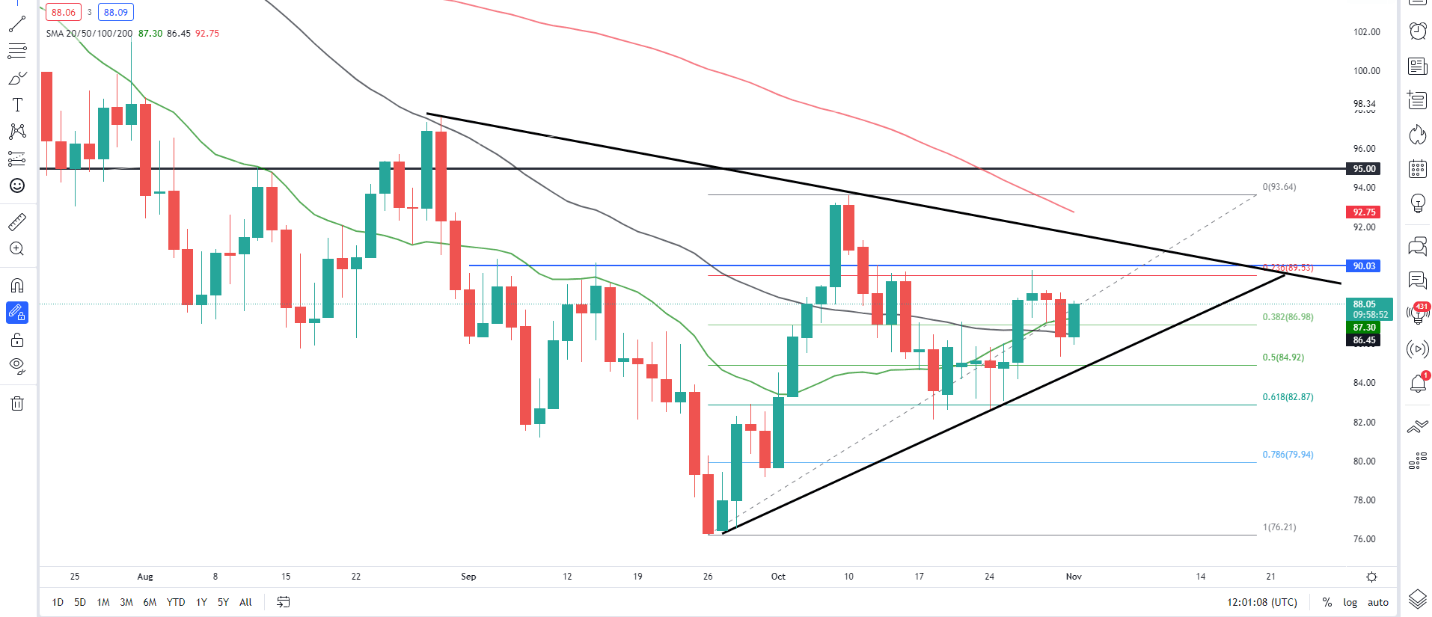
WTI Crude Oil Daily Chart – November 1, 2022


Chart, histogram  Description automatically generated

From a technical perspective, WTI arrested its slide on the monthly timeframe with its first month of gains since May. The positive month propelled the price back above the 20-SMA having dipped below it in September. The weekly reinforced the idea of higher prices with a bullish engulfing candle close above the 38.2% fib level.

The daily timeframe gives us a good view of the triangle pattern in play. A breakout could occur as early as this week given the host of data events expected. A bullish daily candle close should see price remain above the 20 and 50-SMA while maintaining momentum with the $90.00 psychological level back in play.

GBPUSD battles with descending trendline

GBPUSD has been in a prolonged downtrend since the beginning of the year, plummeting to an all-time low of 1.0324 in mid-September. Although the pair has been in a recovery mode since then and lately crossed above its descending trendline, its latest advance failed to strengthen further, with the pair retracing back to its bearish pattern.

The short-term oscillators are currently indicating a cautiously bullish near-term tone. Specifically, the RSI is hovering slightly above its 50-neutral mark, while the MACD histogram is softening above both zero and its red signal line.

To the upside, bullish actions could propel the price towards the recent resistance of 1.1645. Piercing through this region, the price could challenge the June support of 1.1763, which could now act as resistance. Even higher, the July peak of 1.2290 could curb any further advances before 1.2400 comes under examination.

Alternatively, should the positive momentum fade and the price reverse downwards, initial support could be met at 1.1260. Sliding beneath that floor, the bears might target 1.1060 before the spotlight turns to the October low of 1.0922. A violation of the latter could open the door for the all-time low of 1.0324.

Overall, GBPUSD appears to be losing steam after managing to break above its long-term restrictive trendline. Therefore, if the price falls again below the latter, the pair will most likely extend its downtrend, while a bounce to the upside could increase bulls’ bets for a sustained rebound.

USD/JPY Slips Back As Market Looks To Fed Chair Powell

USD/JPY, US Federal Reserve, Bank of Japan, Inflation—Talking Points

  • USD/JPY has seen record monthly levels of official intervention
  • However the Japanese Yen still lacks fundamental support
  • The Fed will provide near-term direction with markets expecting rate hikes, but less hawkish commentary

The Japanese Yen saw some modest gains in Tuesday’s trade in a market clearly settling down to hear what the United States Federal Reserve will do and, perhaps as importantly, say, at the end of its midweek meeting Wednesday.

The market is looking for another three-quarter point hike in US interest rates, the latest in a series aimed at bringing rampant inflation to heel. Assuming this is delivered, market attention will be firmly on the Fed’s tone. It’s widely expected by economists that the central bank will ratchet back from any aggressively hawkish commentary, emphasizing instead that future rate rises will depend squarely on how inflation now responds.

Rising US interest rates this year have of course lent the Dollar extraordinary support against all major currencies. The Yen has been particularly hard-hit, though with the Bank of Japan still unwilling to raise its own ultra-low borrowing costs. The resultant widening yield spread to the greenback’s advantage has seen USD/JPY rise back to levels around 150, not previously seen since 1990.

Japan’s Authorities Have Gone Big On Intervention

For their part, the Japanese authorities have opted to act in the market to try and cushion the Yen’s fall. Japanese Finance Minister Shunichi Suzuki reportedly said on Tuesday that the country’s interventions in the currency space have been ‘stealth operations’ in order to maximize their effects. This comment came after Tokyo spent a record $43 billion supporting the embattled Yen last month alone. It is likely to spend a lot more in the months ahead.

Long-serving Bank of Japan Governor Haruhiko Kuroda said on Tuesday that ultra-loose monetary policy must be retained to support a Japanese economy still struggling with the aftermath of Covid 19. With this in mind, the Yen looks likely to remain in the bears’ sights, at least while other central banks are tightening their own monetary screws. There may be some scope for a modest fightback if the Fed sounds more dovish than the market expects this week, but for now the Yen’s main fundamental hope probably lies in that aggressive but stealthy official intervention continuing.

USD/JPY Technical Analysis

The USD/JPY’s daily chart shows the pair has yet to recover from the strong falls seen at the end of last week, which were unusual and possibly bolstered by official action to bring the Dollar down a little.

Assuming that Dollar bulls are now on watch for this action on any approach to 150, the pair may well struggle for traction to the upside in the near term, although exploratory upward forays remain likely, targeting that key psychological level.

To the downside, meaningful support looks rather limited at current market levels, although a cluster of props from the trading action between September 6 and October 4 looks likely to guard the first, 23.6% Fibonacci retracement of the long rise up from the lows of August 2021 to last month’s historic peaks. That comes in at 141.611, the base of the red area on the chart, but the 142-145 region above it is likely to be sternly contested by Yen bears.

The market may return more durably to that region in a consolidation move before pushing on higher, however.

US data awaited ahead of tomorrow’s Fed decision

OVERNIGHT

Asian equity markets traded higher, led by the rebound in Chinese tech stocks, with the Hang Seng index gaining more than 5%. The Reserve Bank of Australia raised interest rates by 25bp to 2.85%, as expected. China’s Caixin manufacturing PMI rose more than expected but remained in contraction territory at 49.2 in October, likely reflecting ongoing economic dislocations from Covid lockdowns.

THE DAY AHEAD

Markets will likely be biding time ahead of policy updates from the US Federal Reserve tomorrow and the Bank of England on Thursday. The BoE’s active gilt sales (quantitative tightening) is scheduled to begin today. This morning’s UK October manufacturing PMI is expected to confirm the earlier ‘flash’ estimate showing output contracting for a fourth month in a row and a sharp deceleration in new orders. Due mostly to the drop in demand, the headline index fell to 45.8 from 48.4 in September, the weakest for 29 months during the early stage of the pandemic. Inflationary pressures eased slightly but remained elevated despite the weakening outlook for activity.

The US October ISM manufacturing survey is expected to fall towards the 50 no-change threshold. That would be broadly in line with the alternative S&P Global manufacturing PMI reading of 49.9 led by weakening demand and despite signs of improvement in supply chain disruptions. It would also be consistent with most regional Fed surveys. We forecast the ISM manufacturing to fall to 50.2 from 50.9 in September.x

Also out is US construction spending and the JOLTS survey. Construction spending in September is forecast to have contracted again on the back of a weakening housing market. Job openings, meanwhile, are expected to have fallen below 10 million in September for the first time since mid-2021, suggesting tentative signs of cooling of the buoyant labour market. The data releases are unlikely to change expectations for the Fed to raise interest rates by 75bp tomorrow.

MARKETS

US Treasury yields and the dollar edged lower overnight ahead of tomorrow’s Fed policy decision. The pound moved back above $1.15 and was marginally firmer against the euro. UK gilt yields closed higher yesterday but they remain well below levels during the aftermath of the mini-budget.

image1.png

Australian Dollar Dips After RBA Hike by 0.25% as Expected. Where to for AUD/USD?

The Australian Dollar toppled after the Reserve Bank of Australia (RBA) raised the cash rate target by 25 basis points (bp) as anticipated to 2.85% from 2.60%.

The currency had rallied into the decision on the back of a weaker US Dollar. It is still in the green on the day at the time of going to print.

In the accompanying Monetary Policy Statement (MPS) the bank changed their view on where inflation will peak, moving it to 8% from 7.75%. Despite the northward adjustment to CPI, they still expect inflation to slide dramatically lower in 2023.

Today’s decision comes after a blistering third quarter CPI published last week that saw the headline number come in at 7.3% year-on-year to the end of October, above the 7.0% forecast and 6.1% previously.

The RBA have a mandated target of 2% on average over the cycle. CPI dipped on the outbreak of the pandemic, but it has been above 3% since the second quarter of 2021.

The RBA’s preferred measure of inflation is the so called “trimmed mean” which is considered by many economists to be a superior measure of core inflation. Unfortunately for the RBA, it too re-accelerated in the third quarter to 6.1% year-on-year, way above 5.5% anticipated and 4.9% prior.

Retail sales were released yesterday and again, beat expectations for September, printing at 0.6% month-on-month, the same as August but above the 0.5% forecast.

Compounding the problematic outlook for price pressures is PPI climbing higher yet again in the third quarter. It was 6.4% year-on-year to the end of October, beating the previous read of 5.6%.

While there is much talk about the lead/lag effects of tightening monetary policy, PPI also takes some time to run down the pipe and hit CPI.

Companies that are facing higher input costs essentially have two choices. They can absorb the increase in the cost of doing business and see margin compression or they can pass on their higher costs to consumers.

The latter option presents a risk to CPI spiralling higher and inflation expectations becoming entrenched.

With CPI above PPI, the companies that are able to pass on the increases in costs are likely to do so, but this presents problems for a central bank trying to rein in CPI. If PPI continues to accelerate, it is hard to not see either higher CPI or lower earnings for companies on the ASX 200.

The implications for AUD/USD remain somewhat opaque with the Federal Reserve holding their Federal Open Market Committee (FOMC) meeting On Wednesday to decide on the scale of their uplift to their target rate.

The market is pricing in a 75 bp boost as they try to catch their runaway CPI train and the focus will be on any perceived pivot to their aggressive hawkish stance. The consequences of such a change in tack will have significant ramifications for the US Dollar and the Aussie is likely to get swept up in such a move to some extent.

Later today, RBA Governor Philip Lowe will be giving an address at a business forum in Hobart at 0820 GMT and his comments will be watched closely for hints of future rate moves.

The full statement from the RBA can be read

AUD/USD CHART

image1.png


UK manufacturing production falls as new order inflows contract at fastest pace since May 2020

The UK manufacturing sector started the final quarter of the year on a weak footing. Output contracted for the fourth successive month, as a steep drop in new work received, weak export demand and supply-chain disruption led to a scaling back of both production and employment. The seasonally adjusted S&P Global / CIPS UK Manufacturing Purchasing Managers’ Index® (PMI®) fell to a 29-month low of 46.2 in October, down from 48.4 in September but above the earlier flash estimate of 45.8. The PMI has remained below the neutral 50.0 mark for three consecutive months

image1.png

EUR/USD Stuck Below Parity, All Eyes Turn to The Fed

In an interview with the newspaper Delfi, ECB President Christine Lagarde said that the likelihood of a recession in the Euro Area has increased and that while uncertainty remains high, ‘a central bank has to focus on its mandate’. President Lagarde added, ‘The destination is clear, and we are not there yet. We will have further rate increases in the future. I’m not going to give you a number because we have turned our back on forward guidance in the current highly uncertain environment. We will decide on the future path and the pace of our rate increases on a meeting-by-meeting basis’. Ms. Lagarde’s comments come in the same week that Euro Area headline inflation hit 10.7% y/y, up sharply from 9.9% in the previous month.

The Federal Reserve is fully expected to announce another 75 basis point interest rate hike tomorrow, the fourth straight three-quarter point hike. The likelihood of a 5th 75bp hike at the December meeting is however in doubt. The latest CME Fedwatch tool shows an 86.2% chance of a 75 basis point hike by the Federal Reserve on Wednesday. The December 14 meeting looks tighter with both a 50bp or a 75bp hike priced in by around 45%. This recent pairing back of rate expectations has given risk assets a boost over the past 2-3 weeks.

ws the ongoing weakness in the pair with the Euro unable to move higher on any short-term US dollar weakness. While the pair is trying to break a series of lower highs and lower lows, EUR/USD will need to re-take 1.0093 to convince that the sell-off has been halted in the short-term at least. Wednesday’s Fed announcement and subsequent press conference will steer the pair over the short term.

EUR/USD Daily Price Chart November 1, 2022

image1.png

Retail trader data show 57.05% of traders are net-long with the ratio of traders long to short at 1.33 to 1.The number of traders net-long is 6.22% higher than yesterday and 10.23% higher from last week, while the number of traders net-short is 4.57% lower than yesterday and 16.62% lower from last week.

We typically take a contrarian view to crowd sentiment, and the fact traders are net-long suggests EUR/USD prices may continue to fall. Traders are further net-long than yesterday and last week, and the combination of current sentiment and recent changes gives us a stronger EUR/USD-bearish contrarian trading bias.

image1.png

US Dollar Down as Treasury Yields Slip, Risk Appetite Picks Up

The US Dollar is weaker against all developed market currencies today as Treasury yields softened throughout the Asian session. The moves unwound the previous day’s gains. The benchmark 10-year note is holding above 4% for now.

Some positive risk sentiment also emerged after solid Japanese and Chinese PMI numbers. The Jibun Bank Japanese manufacturing PMI was 50.7 and the Caixin Chinese manufacturing PMI was 49.2, above estimates of 48.5.

The Chinese Yuan is one of the few currencies to weaken against the ‘big dollar’. It is at its lowest level since early 2008, with USD/CNY trading as high as 7.3270. That’s a long way from the March low of 6.3035.

Japan’s Ministry of Finance (MoF) revealed that they had spent 6.3 trillion Yen (42.5 billion USD) in October on currency intervention.

The Kiwi Dollar has been the best-performing major currency so far after building approvals data there showed an increase of 3.8% month-on-month in September.

AUD/USD had a run up toward 0.6450 but backed away after the RBA hiked their cash rate target by 25 basis points (bps) to 2.85%. It appears to be a case of “buy the rumour, sell the fact.”

APAC equities are all in the green with Hong Kong’s Hang Seng Index (HSI) leading the way, up over 4% at one stage. US futures are pointing to a positive start to their cash session after yesterday’s declines.

US President Joe Biden said that record profits of oil companies are a windfall of war and that producers that don’t reinvest their gains to increase output could face an extra tax.

Crude oil edged higher with the WTI futures contract above US$ 87 bbl while the Brent contract has surpassed US$ 93.50 bbl.

More PMI data is due out today from Switzerland, the UK, Canada and the US. The latter will also publish analogous ISM figures. The market remains anxious ahead of the Fed rate decision on Wednesday.

The full economic calendar can be viewed here.

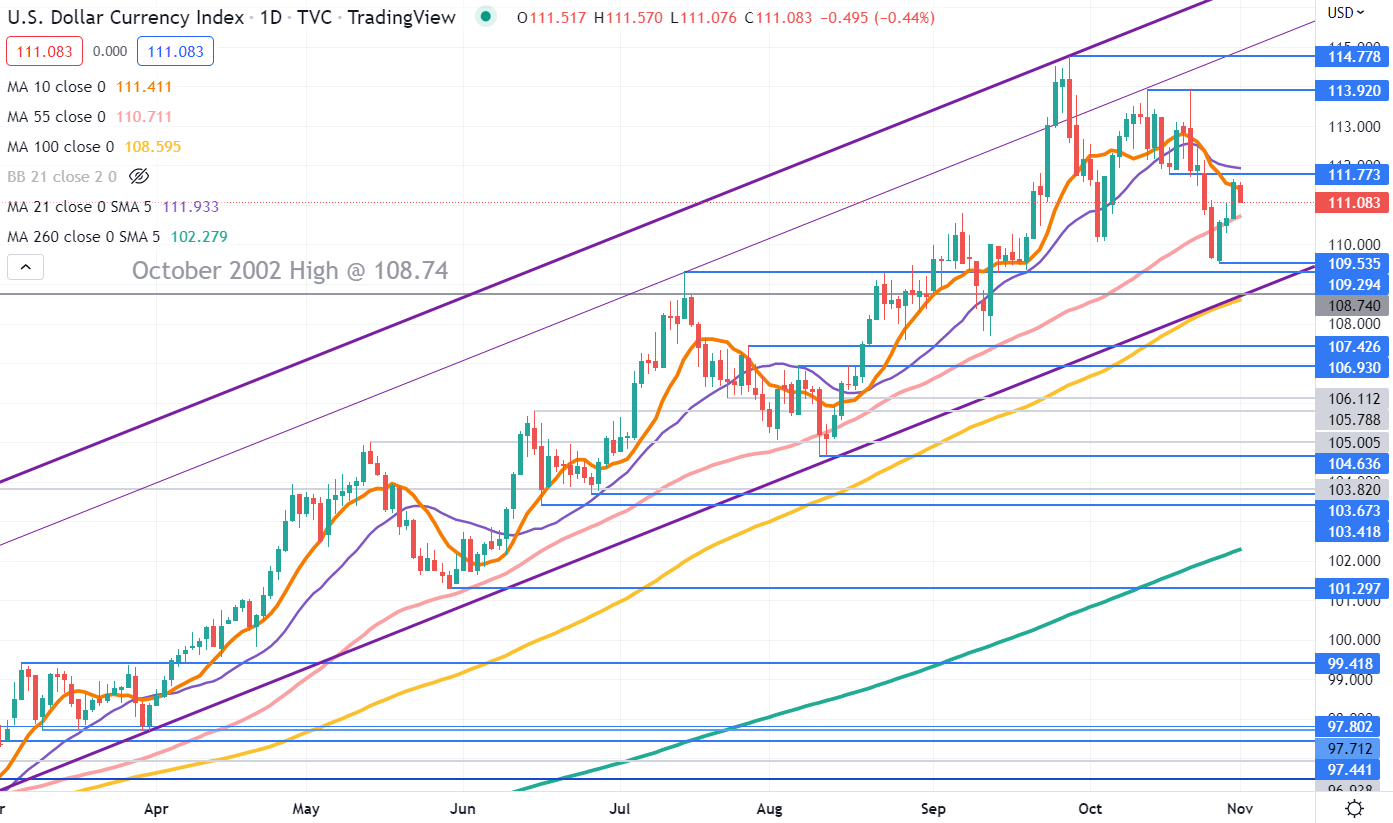
DXY (USD) INDEX TECHNICAL ANALYSIS

The DXY index remains with an ascending trend channel and might be regaining bullish momentum after crossing above the 55-day simple moving average (SMA).

The lower bound of the ascending channel coincides with the 100-day SMA, currently intersecting at 108.60 and this might provide support.

Ahead of that level, the recent low and the break point at 109.54 and 109.29 respectively may provide support.

On the topside, resistance could be at break point of 111.77 or further up at the previous peaks of 113.92 and 114.78.

image1.png


UK gilt/Bund yield spread tightest since Sept. 20

LONDON: British government bond prices rallied on Tuesday, pushing down yields on 10-year gilts so they offered the smallest premium over similar German government bonds since Sept. 20, before the announcement of an ill-fated package of unfunded tax cuts.

The yield spread between 10-year gilts and German Bunds dropped by 6 basis points (bps) on the day to 130.2 basis points, its narrowest since Sept. 20 according to Refinitiv data.

Ten-year gilt yields were down 11 bps on the day in outright terms at 3.41%, close to a one-month low.

Britain’s ‘mini-budget’ on Sept. 23 caused gilt yields to soar, pushing 10-year yields as high as 4.63% and the gilt/Bund spread as high as 229 bps, and forced the Bank of England to intervene to stabilise the market.

Europe’s debt market strains force some governments to rework trading rules

Late on Monday, a British finance ministry source said broad-based tax rises were likely to be necessary to stabilise the public finances when new finance minister Jeremy Hunt presents fresh budget plans on Nov. 17.