Canada CPI set to ease in April amid inflation uncertainty from US tariffs

Canada CPI set to ease in April amid inflation uncertainty from US tariffs

All eyes will be on Statistics Canada this Tuesday as it releases the April Consumer Price Index (CPI), a key inflation gauge that the Bank of Canada (BoC) closely tracks when setting interest rates.

Headline inflation is expected to have eased sharply, with annual CPI forecast to fall 1.6% from 2.3% in March. On a monthly basis, however, inflation is projected to have picked up slightly, rising 0.5% versus the previous 0.3% increase.

The Bank of Canada will also release its preferred core inflation measures, which aim to strip out volatile price swings for a clearer view of underlying trends. In March, the BoC’s core CPI CPI rose 2.2% from a year earlier.

While recent inflation data suggests price pressures are moderating, markets are expected to tread carefully. The figures do not yet reflect the full impact of US trade tariffs recently imposed under the Trump administration—an element that could complicate the inflation outlook in the months ahead. As a result, a cautious tone is likely to prevail among investors and policymakers alike.

What can we expect from Canada’s inflation rate?

The BoC held its benchmark interest rate at 2.75% last month, pausing after seven consecutive cuts and citing mounting uncertainty surrounding US trade policy as a key reason for withholding its usual economic forecasts.

Officials said the unpredictability of US-imposed tariffs and the potential for a broader global trade conflict made it impossible to provide a reliable outlook. Instead of its regular quarterly projections, the bank released two hypothetical scenarios to illustrate possible outcomes:

In the more optimistic scenario, most tariffs are eventually rolled back through negotiation. The Bank said this would likely result in a temporary slowdown in Canadian and global growth, with inflation dipping to 1.5% for a year before returning to the 2% target.

A more severe scenario envisions a prolonged global trade war. In that case, Canada would enter a deep recession, and inflation would surge past 3% by mid-2026 before gradually easing back to target levels. The bank acknowledged that other outcomes were possible, underscoring the high degree of economic uncertainty.

In its annual Financial Stability Report (FSR), the central bank acknowledged that the system remains resilient for now, but it also flagged rising vulnerabilities if trade tensions drag on.

Officials pointed to the tariffs imposed by US President Donald Trump on Canadian goods and Ottawa’s retaliatory measures as potential threats. They said that while the financial sector is currently holding up well, ongoing tariff battles could eventually hurt banks and financial institutions by making it harder for households and businesses to manage their debt.

The BoC noted that, in the short term, the unpredictability of US trade policy could trigger more market volatility and strain liquidity. In more extreme cases, that kind of turbulence could escalate into broader market dysfunction.

Over the medium to long term, the bank said, a full-blown global trade war could have severe economic consequences.

When is the Canada CPI data due and how could it affect USD/CAD?

Canada’s April inflation data is due out on Tuesday at 12:30 GMT, and markets are bracing for a mixed picture. While there’s a general sense that price pressures may have eased somewhat, the details could go either way.

If inflation comes in hotter than expected, it might prompt the BoC to take a more hawkish stance, which could give the Canadian Dollar a boost. On the flip side, softer numbers would likely reinforce expectations for more rate cuts, putting some pressure on the Loonie.

That said, a sharp jump in inflation isn’t necessarily good news either. It could raise red flags about the health of the Canadian economy, and ironically, that kind of surprise might end up weighing on the currency too. In short, markets are watching closely—not just for the headline number, but for the broader message it sends about where policy and growth are headed.

Senior Analyst Pablo Piovano from FXStreet pointed out that USD/CAD has moved into a consolidative range just below its critical 200-day Simple Moving Average (SMA) at 1.4012.

“If the Canadian dollar manages to clear its 200-day SMA, the near-term outlook should shift to a more constructive one, allowing at the same time for the recovery to gather pace. That said, the 55-day SMA at 1.4098 should offer interim resistance prior to the April high of 1.4414, set on April 1, with a further barrier at the March peak of 1.4542. A breakout above that level could bring the 2025 high of 1.4792, posted on February 3, back into view,” he added.

The resurgence of the bearish tone could motivate USD/CAD to embark on a potential visit to its 2025 floor at 1.3838, marked on April 11,” Piovano said. “That would be followed by the November 2024 low at 1.3817, with the next key support seen at the September 2024 trough of 1.3418.”

From a technical standpoint, Piovano flagged that USD/CAD is currently signalling some sidelined mood based on the Relative Strength Index (RSI) around the 50 threshold. He added that the Average Directional Index (ADX) is easing toward 24 points to some loss of impetus of the current trend.

arr

The NZD/USD pair halts its two-day winning streak, trading around 0.5930 during the European hours

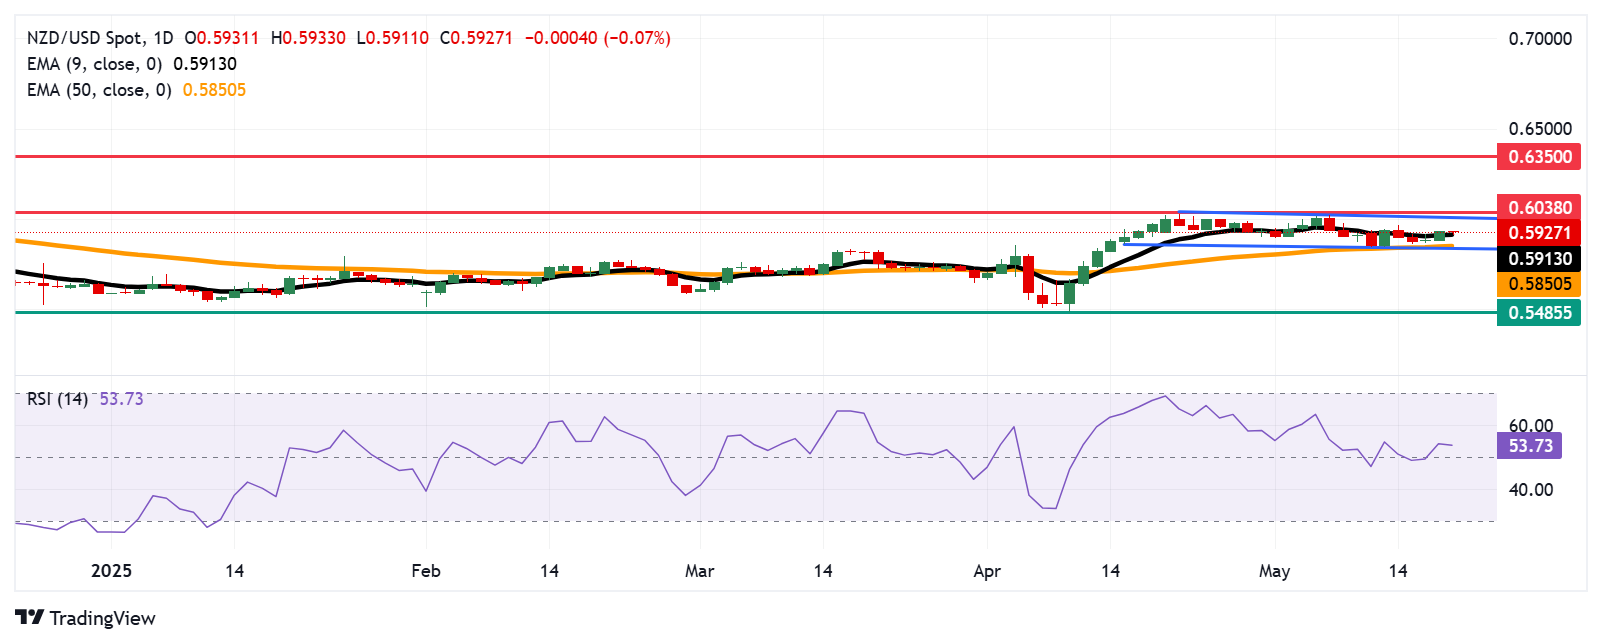
The NZD/USD pair halts its two-day winning streak, trading around 0.5930 during the European hours on Tuesday. Daily chart technicals suggest a neutral outlook, with the pair remaining confined within a consolidation rectangle.

The 14-day Relative Strength Index (RSI) hovers just above the 50 mark, suggesting a slight bullish inclination. Meanwhile, the NZD/USD pair trades near the nine-day Exponential Moving Average (EMA), indicating neutral short-term momentum.

The NZD/USD pair may aim for the upper boundary of the consolidation range near 0.6000, with the next target at the six-month high of 0.6038, last reached in November 2024. A decisive break above this key resistance zone could pave the way for a move toward the seven-month high around 0.6350, marked in October 2024.

On the downside, initial support for the NZD/USD pair lies around the nine-day EMA at 0.5913. A break below this level would signal weakening short-term momentum, potentially driving the pair toward the 50-day EMA at 0.5850, which aligns with the rectangle’s lower boundary. A sustained move beneath this critical support zone could further erode medium-term momentum, opening the door for a deeper decline toward 0.5485 — a level not seen since March 2020.

NZD/USD: Daily Chart

usdchef

EUR/USD holds higher ground above 1.1250

EUR/USD recaptures 1.1250 in the European session on Tuesday, extending the previous gains. Renewed US Dollar weakness on fiscal and economic concerns amid US tariffs uncertainty underpins the pair. Speeches from ECB and Fed policymakers eyed amid a data-light calendar.

Last Friday, the Moody’s ratings agency downgraded the United States (US) by removing its final AAA rating on Treasuries, citing increasing US debt and long-standing government deficits that various presidential administrations either neglect or fail to manage effectively. While initial investor reactions were shaky, sentiment quickly stabilized and the impact on US creditworthiness was largely dismissed. However, the Treasury markets have their challenges: 30-year yields surpassed 5% on Monday, and 10-year yields exceeded 4.5%.

This week, Federal Reserve (Fed) officials have been actively working to manage market expectations regarding potential rate cuts. Fed policymakers are consistently reminding investors that ongoing tariff and trade policies in the US complicate forecasts of the domestic economy, which in turn influences policy rate adjustments.

image-1747706853583

Japanese Yen remains on the front foot amid hawkish BoJ expectations; USD/JPY seems vulnerable below mid-144.00s

The Japanese (JPY) retains its positive bias heading into the European session and climbs to a nearly two-week high against a mildly softer US Dollar (USD) in the last hour. The growing acceptance that the Bank of Japan (BoJ) will raise interest rates again in 2025 turns out to be a key factor underpinning the JPY. Apart from this, hopes for a US-Japan trade deal lend support to the JPY.

Meanwhile, hawkish BoJ expectations mark a sharp divergence in comparison to bets that the Federal Reserve (Fed) will lower borrowing costs further this year. This keeps the USD bulls on the defensive and further benefits the lower-yielding JPY, which seems rather unaffected by the receding safe-haven demand on the back of the latest optimism led by the US-China trade truce for 90 days.

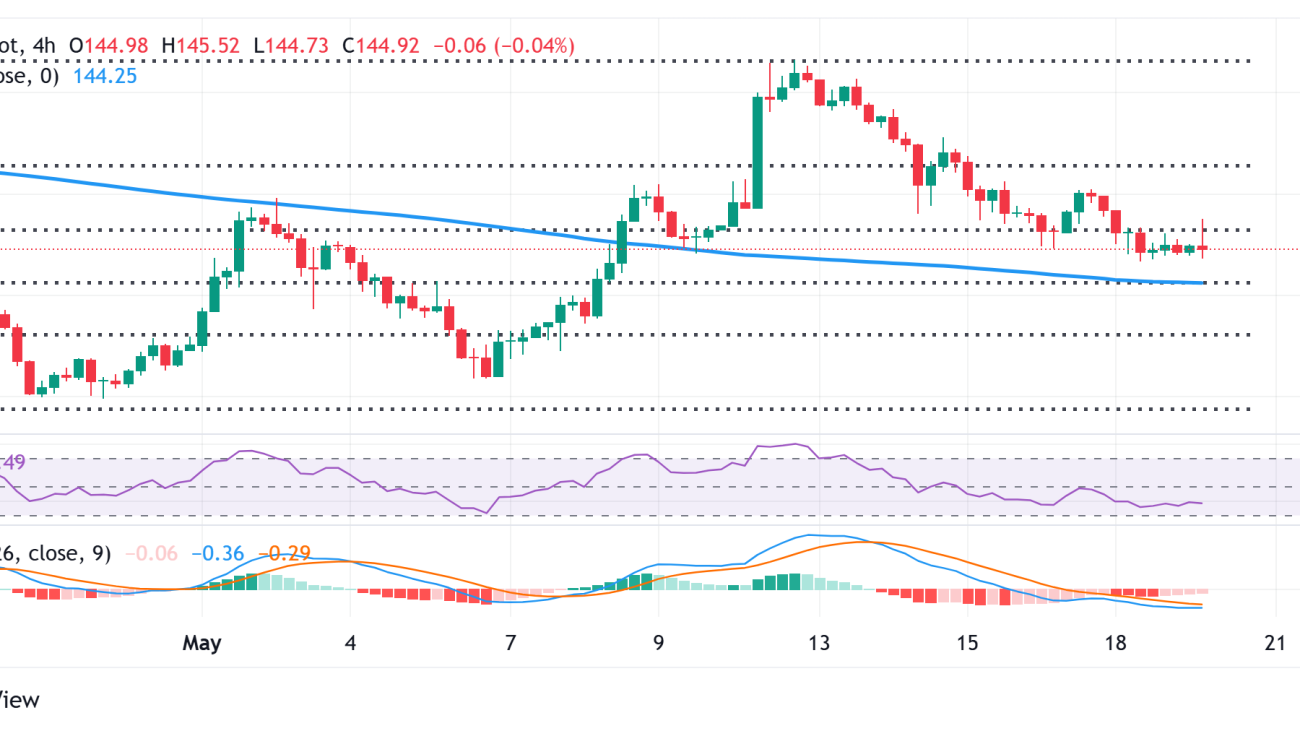
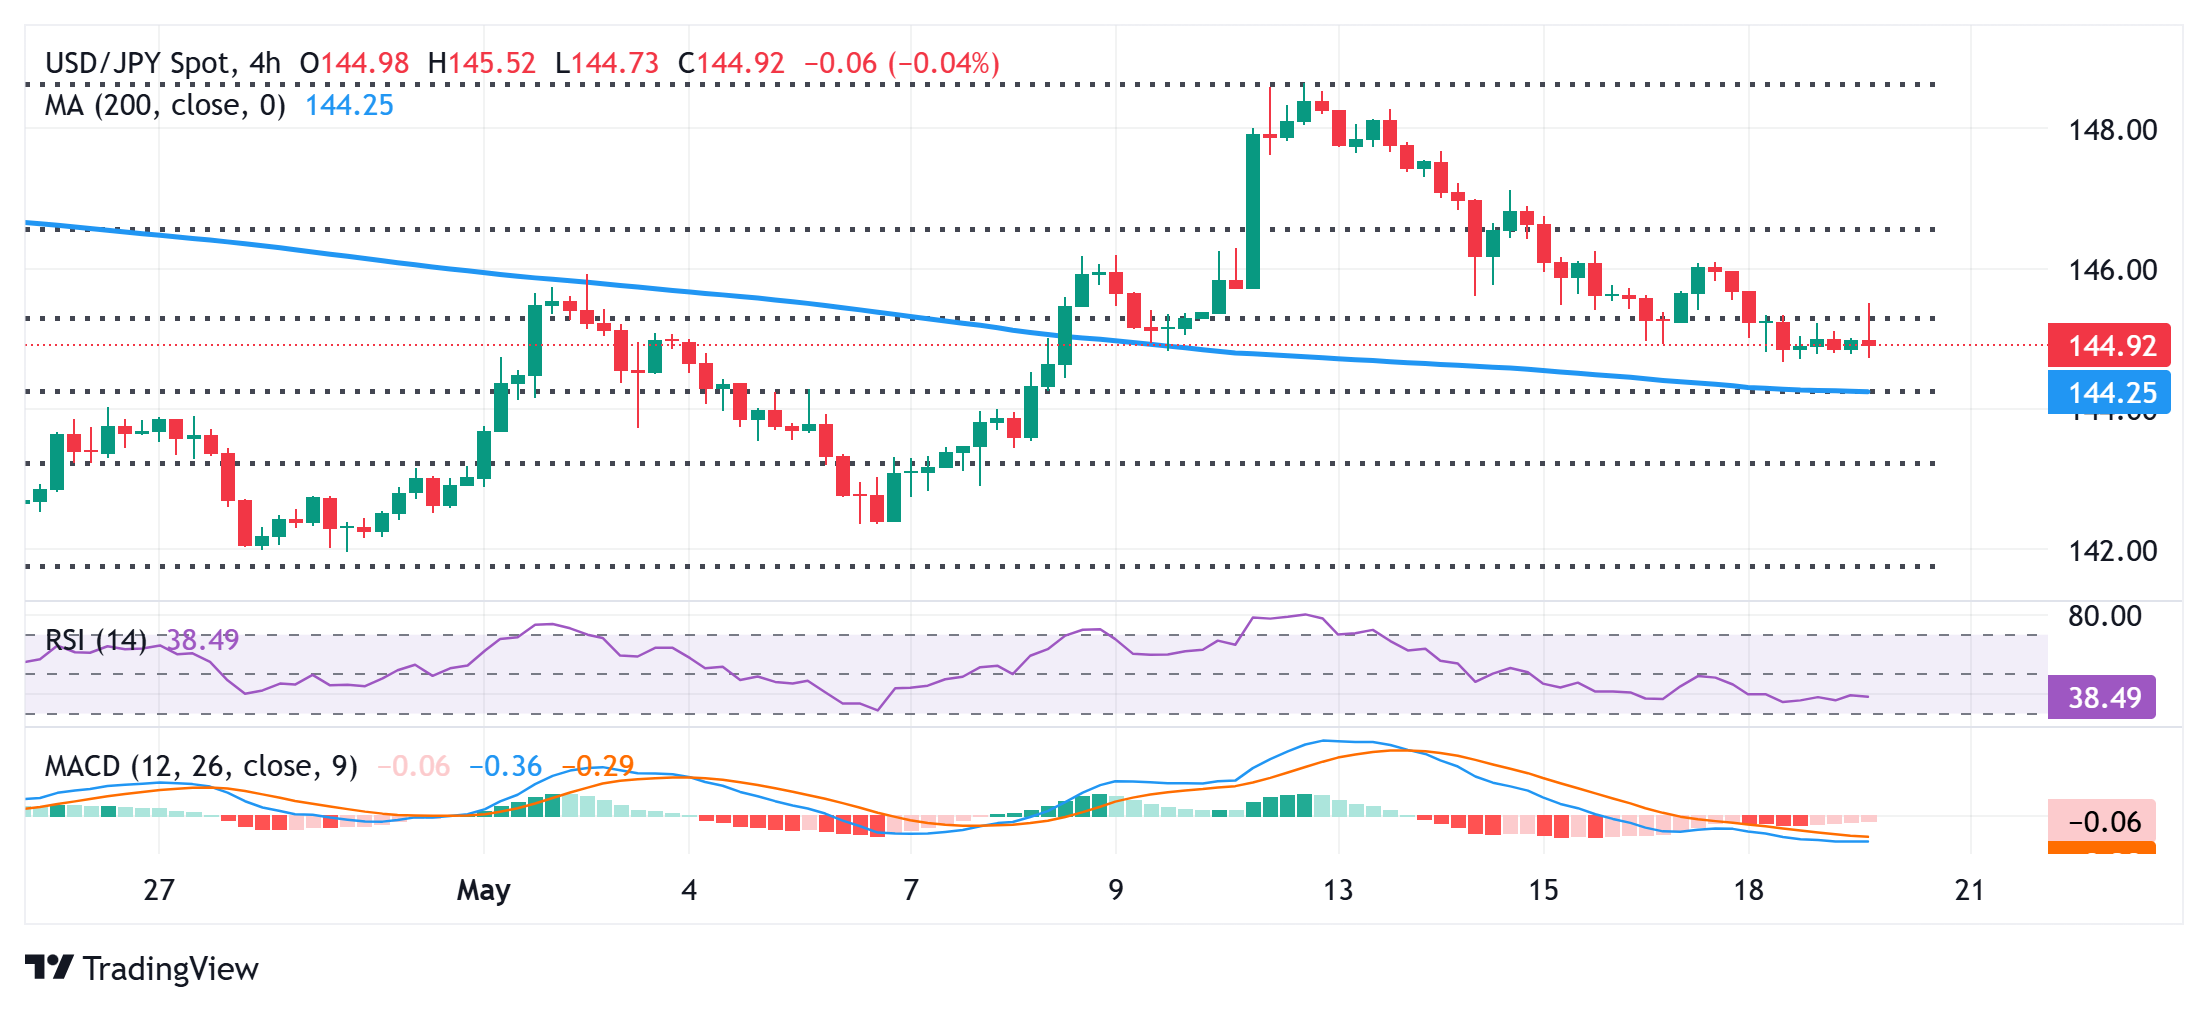
USD/JPY could accelerate the fall once the 144.30 confluence support is broken

From a technical perspective, acceptance below the 38.2% Fibonacci (Fibo.) retracement level of the April-May upward move and negative oscillators on hourly charts favor the USD/JPY bears. Hence, any subsequent move up might still be seen as a selling opportunity and remain capped ahead of the 146.00 round figure. A sustained strength beyond the latter, however, might trigger a short-covering move and lift spot prices to the 146.60 area, or the 23.6% Fibo. level, en route to the 147.00 mark.

On the flip side, the 144.65 area, or over a one-week low touched on Monday, now seems to protect the immediate downside. This is closely followed by the 144.30-144.25 confluence, comprising the 200-period Simple Moving Average (SMA) on the 4-hour chart and the 50% retracement level. A convincing break below will be seen as a fresh trigger for bearish traders and drag the USD/JPY pair below the 144.00 mark, towards the next relevant support near the 143.75-143.70 region.

Untitled

GBP/USD Forecast: Pound Sterling closes in on key resistance

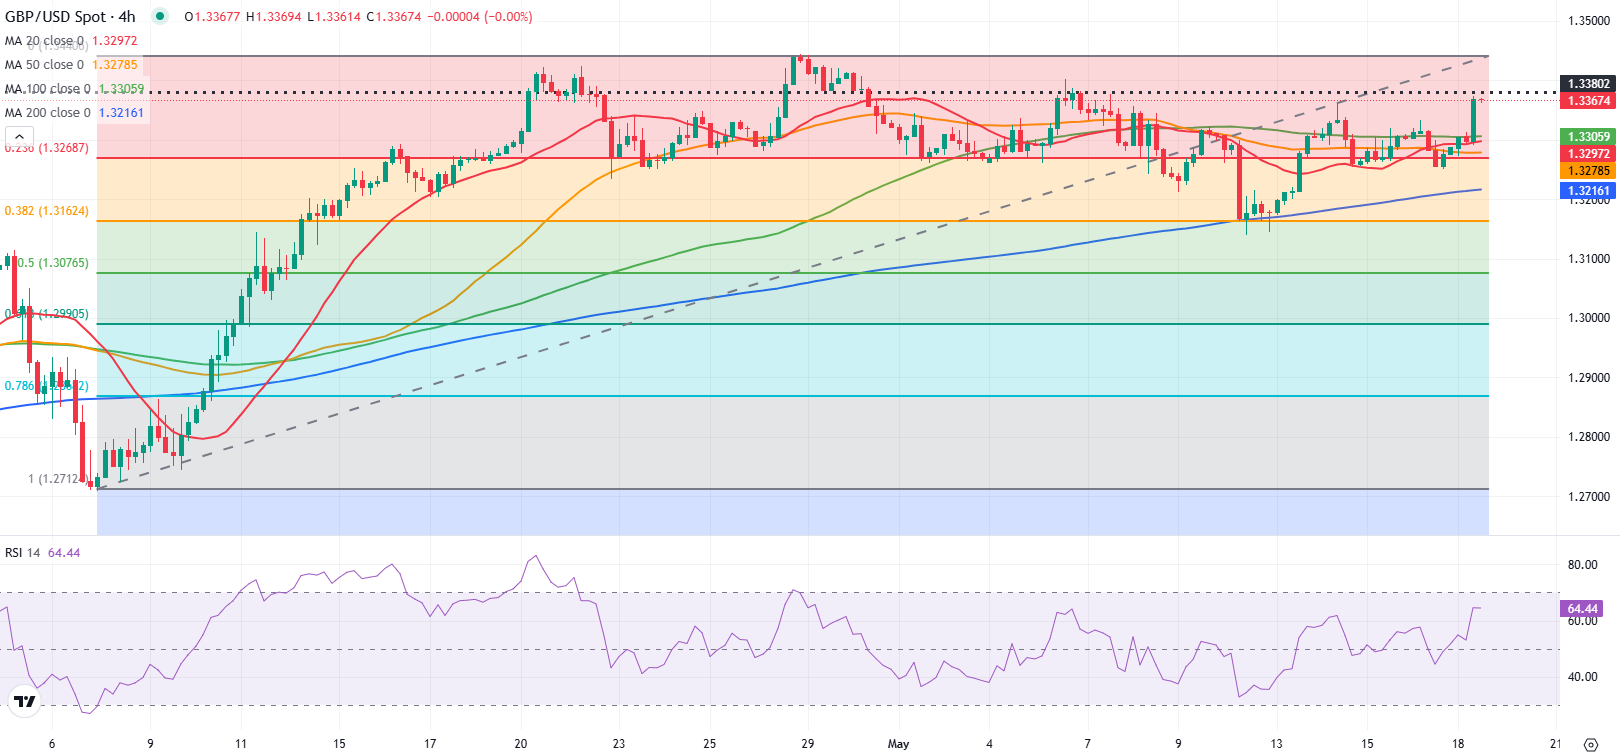
GBP/USD gathers bullish momentum in the European session and trades at its highest level in nearly two weeks above 1.3350. The technical outlook suggests that the pair has more room on the upside before turning technically overbought.

The broad-based US Dollar (USD) weakness fuels GBP/USD’s rally at the beginning of the week as markets react to Moody’s downgrade of the United States’ credit rating late Friday.

Moody’s announced that it downgraded the US’ credit rating to ‘AA1’ from ‘AAA’, citing concerns about the growing $36 trillion debt pile. Moody’s explained that the fiscal proposals under considerations were unlikely to lead to a sustained, multi-year reduction in deficits, and added that it forecasts the federal debt burden to rise to about 134% of Gross Domestic Product by 2035, compared with 98% in 2024, per Reuters.

The US economic calendar will not feature any high-impact data releases in the second half of the day. Hence, investors will pay close attention to comments from Federal Reserve (Fed) officials.

The University of Michigan’s preliminary Consumer Sentiment Survey for May showed that consumers’ one-year inflation expectation jumped to 7.3% from 6.5% in April. In case Fed officials hint that they could refrain from lowering the policy rate multiple times, citing heightened concerns about the inflation outlook, the USD could gather strength against its peers and make it difficult for GBP/USD to extend its rally.

Atlanta Fed President Raphael Bostic said last Friday that he expects the Fed to lower the policy rate once this year. According to the CME FedWatch Tool, markets are currently pricing in about a 70% chance of the Fed cutting the policy rate at least twice this year.

GBP/USD Technical Analysis

The Relative Strength Index (RSI) indicator on the 4-hour chart climbed above 60, pointing to a buildup of bullish momentum. On the upside, 1.3380 (static level) aligns as immediate resistance before 1.3440 (upper limit of the latest uptrend) and 1.3500 (static level, round level).

Looking south, supports could be seen at 1.3300 (100-period Simple Moving Average (SMA), static level), 1.3270 (Fibonacci 23.6% retracement of the latest uptrend) and 1.3220 (200-period SMA).

image-1747386011131

EUR/USD Forecast: Euro sets trading range before next breakout

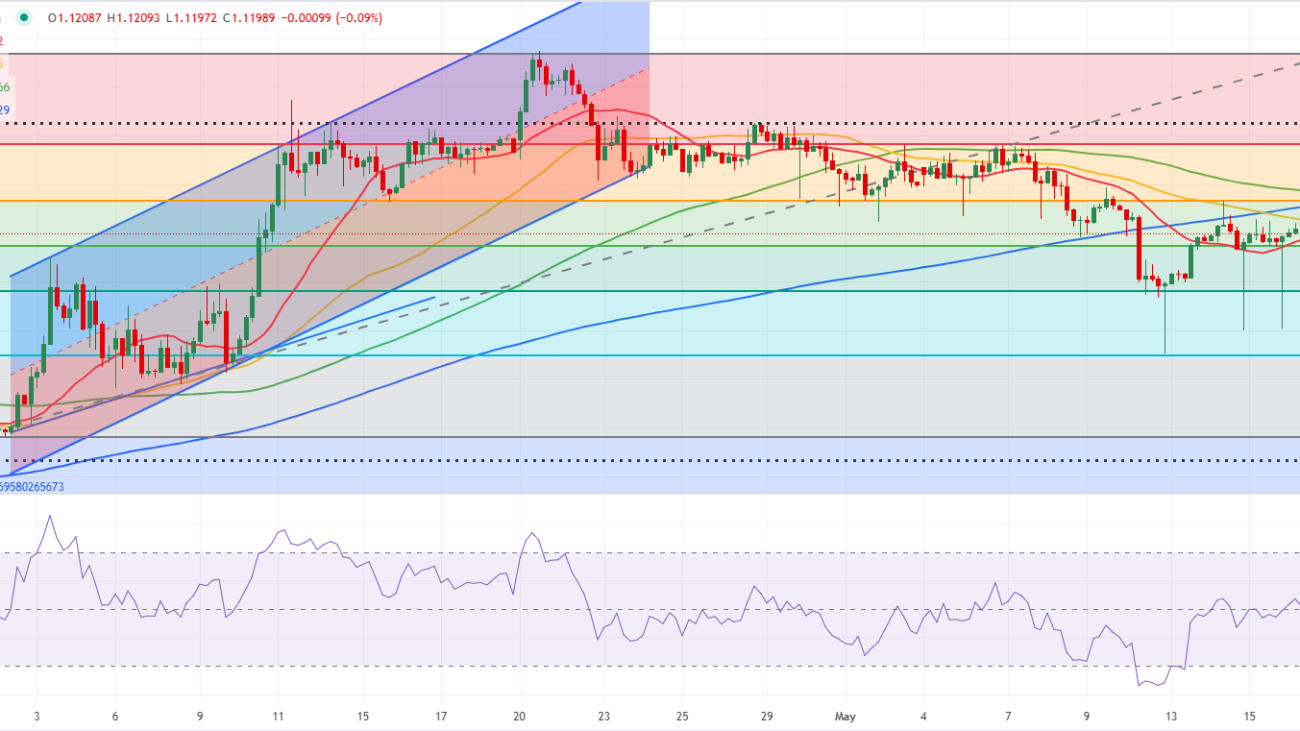
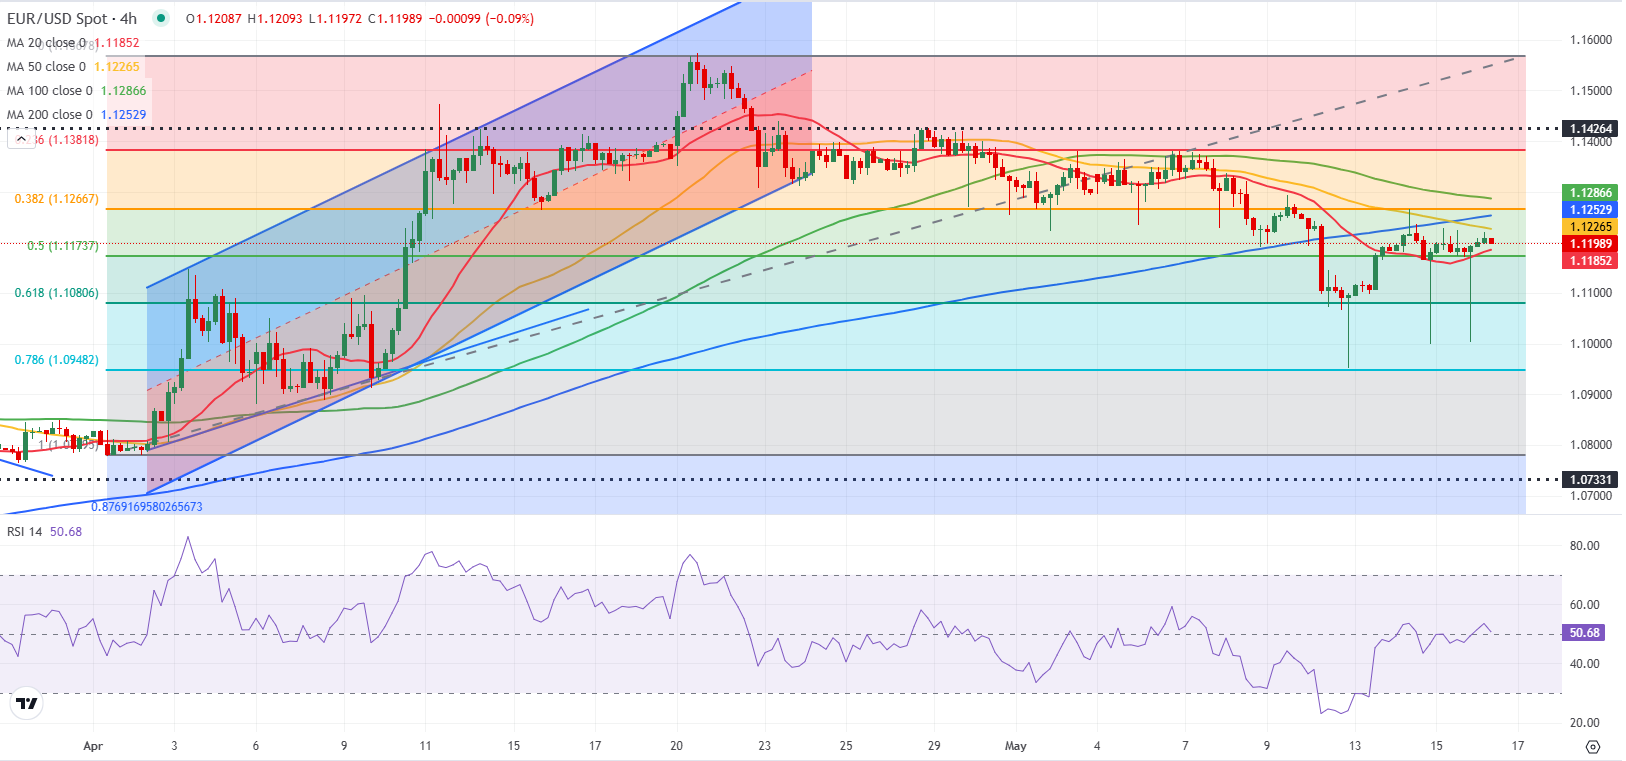
EUR/USD struggles to find direction early Friday and moves sideways at around 1.1200 after closing virtually unchanged on Thursday. The near-term technical outlook reaffirms the pair’s indecisiveness.

Euro PRICE This week

The table below shows the percentage change of Euro (EUR) against listed major currencies this week. Euro was the weakest against the Japanese Yen.

USD EUR GBP JPY CAD AUD NZD CHF
USD 0.45% 0.04% -0.65% 0.39% -0.18% 0.30% 0.12%
EUR -0.45% -0.28% -0.57% 0.43% -0.00% 0.34% 0.15%
GBP -0.04% 0.28% -0.10% 0.71% 0.29% 0.54% 0.42%
JPY 0.65% 0.57% 0.10% 1.05% -0.15% 0.10% 0.54%
CAD -0.39% -0.43% -0.71% -1.05% -0.31% -0.09% -0.29%
AUD 0.18% 0.00% -0.29% 0.15% 0.31% 0.24% 0.11%
NZD -0.30% -0.34% -0.54% -0.10% 0.09% -0.24% -0.22%
CHF -0.12% -0.15% -0.42% -0.54% 0.29% -0.11% 0.22%

The heat map shows percentage changes of major currencies against each other. The base currency is picked from the left column, while the quote currency is picked from the top row. For example, if you pick the Euro from the left column and move along the horizontal line to the US Dollar, the percentage change displayed in the box will represent EUR (base)/USD (quote).

The US Dollar (USD) failed to gather strength following the mixed macroeconomic data releases and allowed EUR/USD to hold its ground on Thursday.

The Bureau of Labor Statistics reported that annual producer inflation, as measured by the change in the Producer Price Index, softened to 2.4% in April from 2.7% in March. Other data from the US showed that Retail Sales increased 0.1% on a monthly basis in April, while the weekly Initial Jobless Claims came in at 229,000, matching the previous week’s reading and the market expectation.

The US economic calendar will feature Housing Starts and Building Permits data for April on Friday. More importantly, the University of Michigan (UoM) will publish the preliminary Consumer Sentiment Index data for May.

The UoM Consumer Sentiment Index declined for six consecutive months. If the data points to a further deterioration in consumer confidence, the USD could have a hard time finding demand heading into the weekend. On the other hand, a noticeable improvement could have the opposite impact on the currency’s valuation.

EUR/USD Technical Analysis

The Relative Strength Index (RSI) indicator stays near 50, highlighting a lack of directional momentum in the near term.

The Fibonacci 50% retracement level of the latest uptrend aligns as the first support level at 1.1170. In case EUR/USD falls below this level and starts using it as resistance, technical sellers could show interest. In this scenario, 1.1080 (Fibonacci 61.8% retracement) and 1.1000 (round level, static level) could be seen as next support levels.

On the upside, resistances are located at 1.1260-1.1270 (200-period Simple Moving Average (SMA), Fibonacci 38.2% retracement), 1.1290-1.1300 (100-period SMA, static level) and 1.1380 (Fibonacci 23.6% retracement).

dt

US Dollar Index falls below 100.50 following Moody’s downgrade of US credit rating

The US Dollar Index (DXY), which tracks the US Dollar (USD) against a basket of six major currencies, has retraced its recent gains from the previous session and is trading around 100.40 during the Asian hours on Monday.

The US Dollar faces challenges as Moody’s Ratings has downgraded the US credit rating from Aaa to Aa1, aligning with previous downgrades by Fitch Ratings in 2023 and Standard & Poor’s in 2011. Moody’s now forecasts US federal debt to rise to approximately 134% of GDP by 2035, up from 98% in 2023. The federal deficit is projected to widen to nearly 9% of GDP, fueled by mounting debt-servicing costs, increased entitlement spending, and declining tax revenues.

However, the Greenback received support from renewed optimism over a 90-day US-China trade truce and expectations of further trade agreements with other nations. Meanwhile, US Treasury Secretary Scott Bessent told CNN on Sunday that President Donald Trump plans to impose tariffs at previously threatened levels on trade partners who fail to negotiate in “good faith.”

Economic data released last week showed signs of easing inflation, with both the Consumer Price Index (CPI) and Producer Price Index (PPI) indicating a slowdown in price pressures. These figures have increased expectations that the Federal Reserve could cut interest rates further in 2025, adding to the downward bias on the Greenback. Moreover, weak US Retail Sales data has reinforced concerns about a prolonged period of subdued economic growth.

blog-eurusd-14-01-25

USD/CAD Price Forecast: Tests initial support near 1.3950, followed by nine-day EMA

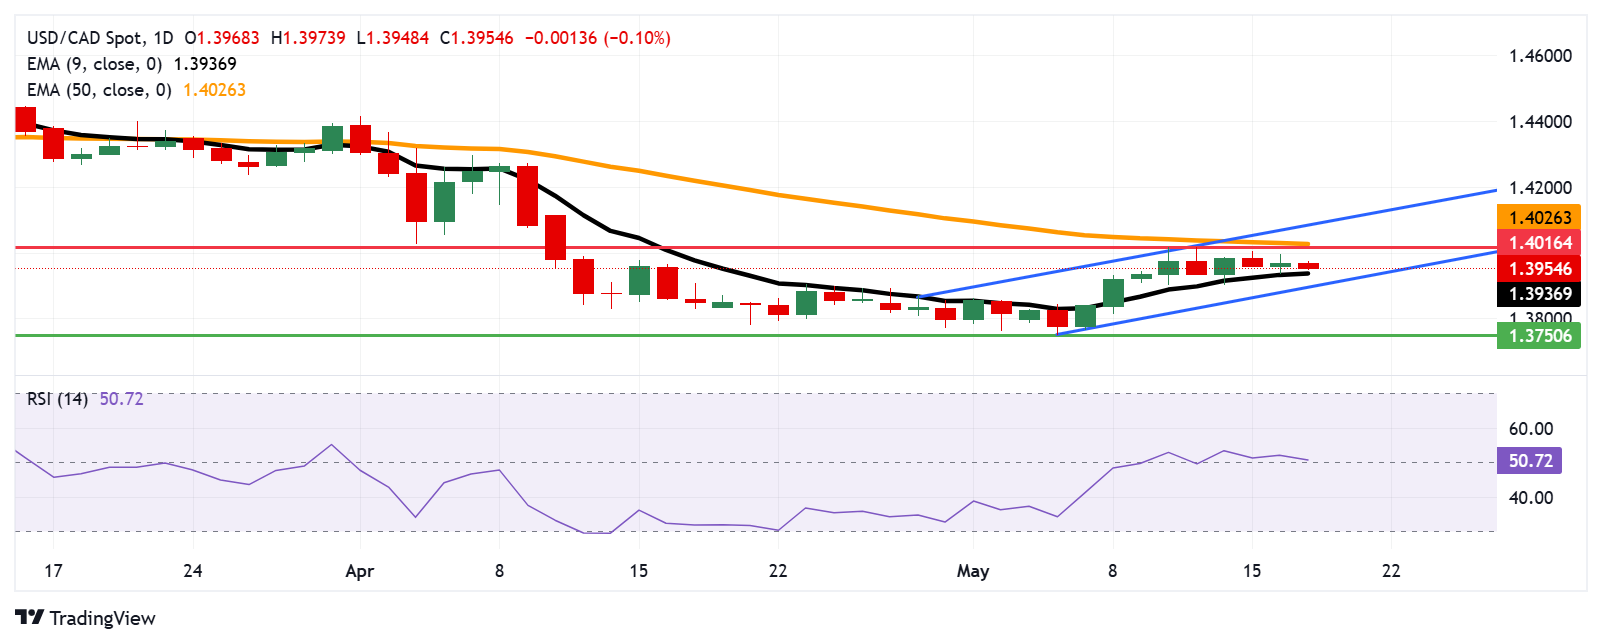
The USD/CAD pair is losing ground after registering gains in the previous session, trading around 1.3950 during the European hours on Monday. The daily chart’s technical analysis suggested a sustained bullish sentiment, as the pair continues to trade within the ascending channel pattern.

The 14-day Relative Strength Index (RSI) remains just above 50, indicating continued bullish pressure. Additionally, the USD/CAD pair is also remaining above the nine-day Exponential Moving Average (EMA), pointing to stronger short-term momentum.

The USD/CAD pair may encounter resistance at its six-week high of 1.4016, which was reached on May 13, followed by the 50-day Exponential Moving Average (EMA) at 1.4023. A break above this crucial resistance zone could improve the medium-term price momentum and support the pair to test the upper boundary of the ascending channel around 1.4100.

On the downside, the USD/CAD pair may find immediate support at the nine-day EMA of 1.3936, followed by the ascending channel’s lower boundary around the psychological level of 1.3900. A break below this crucial support zone would weaken the short-term price momentum and support the pair to navigate the region around the seven-month low of 1.3750, last seen on May 6.

USD/CAD: Daily Chart

mmm

EUR/USD advances above 1.1200 on intense US Dollar selling

EUR/USD ticks higher and regains 1.1200 in European trading on Monday. The relentless US Dollar selling on economic and fiscal concerns underpin the pair, despite a risk-off market mood. Focus now remains on Fedspeak and trade headlines for fresh trading incentives.

The Relative Strength Index (RSI) indicator stays near 50, highlighting a lack of directional momentum in the near term.

The Fibonacci 50% retracement level of the latest uptrend aligns as the first support level at 1.1170. In case EUR/USD falls below this level and starts using it as resistance, technical sellers could show interest. In this scenario, 1.1080 (Fibonacci 61.8% retracement) and 1.1000 (round level, static level) could be seen as next support levels.

On the upside, resistances are located at 1.1260-1.1270 (200-period Simple Moving Average (SMA), Fibonacci 38.2% retracement), 1.1290-1.1300 (100-period SMA, static level) and 1.1380 (Fibonacci 23.6% retracement).

The US Dollar (USD) failed to gather strength following the mixed macroeconomic data releases and allowed EUR/USD to hold its ground on Thursday.

The Bureau of Labor Statistics reported that annual producer inflation, as measured by the change in the Producer Price Index, softened to 2.4% in April from 2.7% in March. Other data from the US showed that Retail Sales increased 0.1% on a monthly basis in April, while the weekly Initial Jobless Claims came in at 229,000, matching the previous week’s reading and the market expectation.

The US economic calendar will feature Housing Starts and Building Permits data for April on Friday. More importantly, the University of Michigan (UoM) will publish the preliminary Consumer Sentiment Index data for May.

The UoM Consumer Sentiment Index declined for six consecutive months. If the data points to a further deterioration in consumer confidence, the USD could have a hard time finding demand heading into the weekend. On the other hand, a noticeable improvement could have the opposite impact on the currency’s valuation.

WTI extends winning streak on US-China trade truce

WTI extends winning streak on US-China trade truce

West Texas Intermediate (WTI), futures on NYMEX, extends its winning streak for the fourth trading session on Tuesday. The Oil price climbs to near $62.00 as the 90-day agreement between the United States (US) and China to reduce tariffs substantially by 115% has boosted its demand outlook.

On Monday, the US and China agreed to lower import duties to 10% and 30%, respectively, aiming to avert the trade war that led market experts to downgrade the global economic outlook. Signs of improving US-China trade relations have strengthened the Oil price, given that Beijing is the largest importer of energy in the world.

Meanwhile, the temporary truce between the US and China has diminished market expectations of interest rate cuts by the Federal Reserve (Fed) in the July meeting. Such a scenario could limit the upside in the Oil price. On Monday, Fed officials cheered the US-China deal and stated that the impact of tariffs will be lower than what they had anticipated earlier, but didn’t rule out fears of an increase in inflation.

According to the CME FedWatch tool, the probability for the Fed to cut interest rates in the July meeting has dropped to 38.6% from 78% recorded a week ago.

The next trigger for the Oil price will be a meeting between Russian leader Vladimir Putin and Ukrainian President Volodymyr Zelenskyy, if Putin agrees to it. Zelenskyy has insisted on meeting with Putin in Turkey on Thursday to discuss the war in Ukraine. Positive outcomes from the war talks would be favorable for the Oil price.