arr

Japanese Yen sticks to intraday losses; downside seems limited ahead of BoJ decision on Thursday

The Japanese Yen (JPY) remains depressed against its American counterpart heading into the European session on Wednesday as signs of easing US-China trade tensions undermine demand for safe-haven status. Furthermore, US President Donald Trump’s decision to give flexibility on tariffs to US carmakers remains supportive of the upbeat market mood. This, along with disappointing domestic data, turn out to be key factors weighing on the safe-haven JPY. The US Dollar (USD), on the other hand, attracts some buyers for the second straight day and lifts the USD/JPY pair back above mid-142.00s.

Any meaningful JPY depreciation, however, seems elusive as traders might refrain from placing aggressive bets and opt to wait for the crucial Bank of Japan (BoJ) policy decision on Thursday. The central bank is widely expected to keep interest rates steady amid heightening risks to the fragile economy from US tariffs. However, signs of broadening inflation in Japan keep the door open for further BoJ policy normalization. This marks a big divergence in comparison to expectations for more aggressive easing by the Federal Reserve (Fed), which should cap the USD and benefit the lower-yielding JPY.

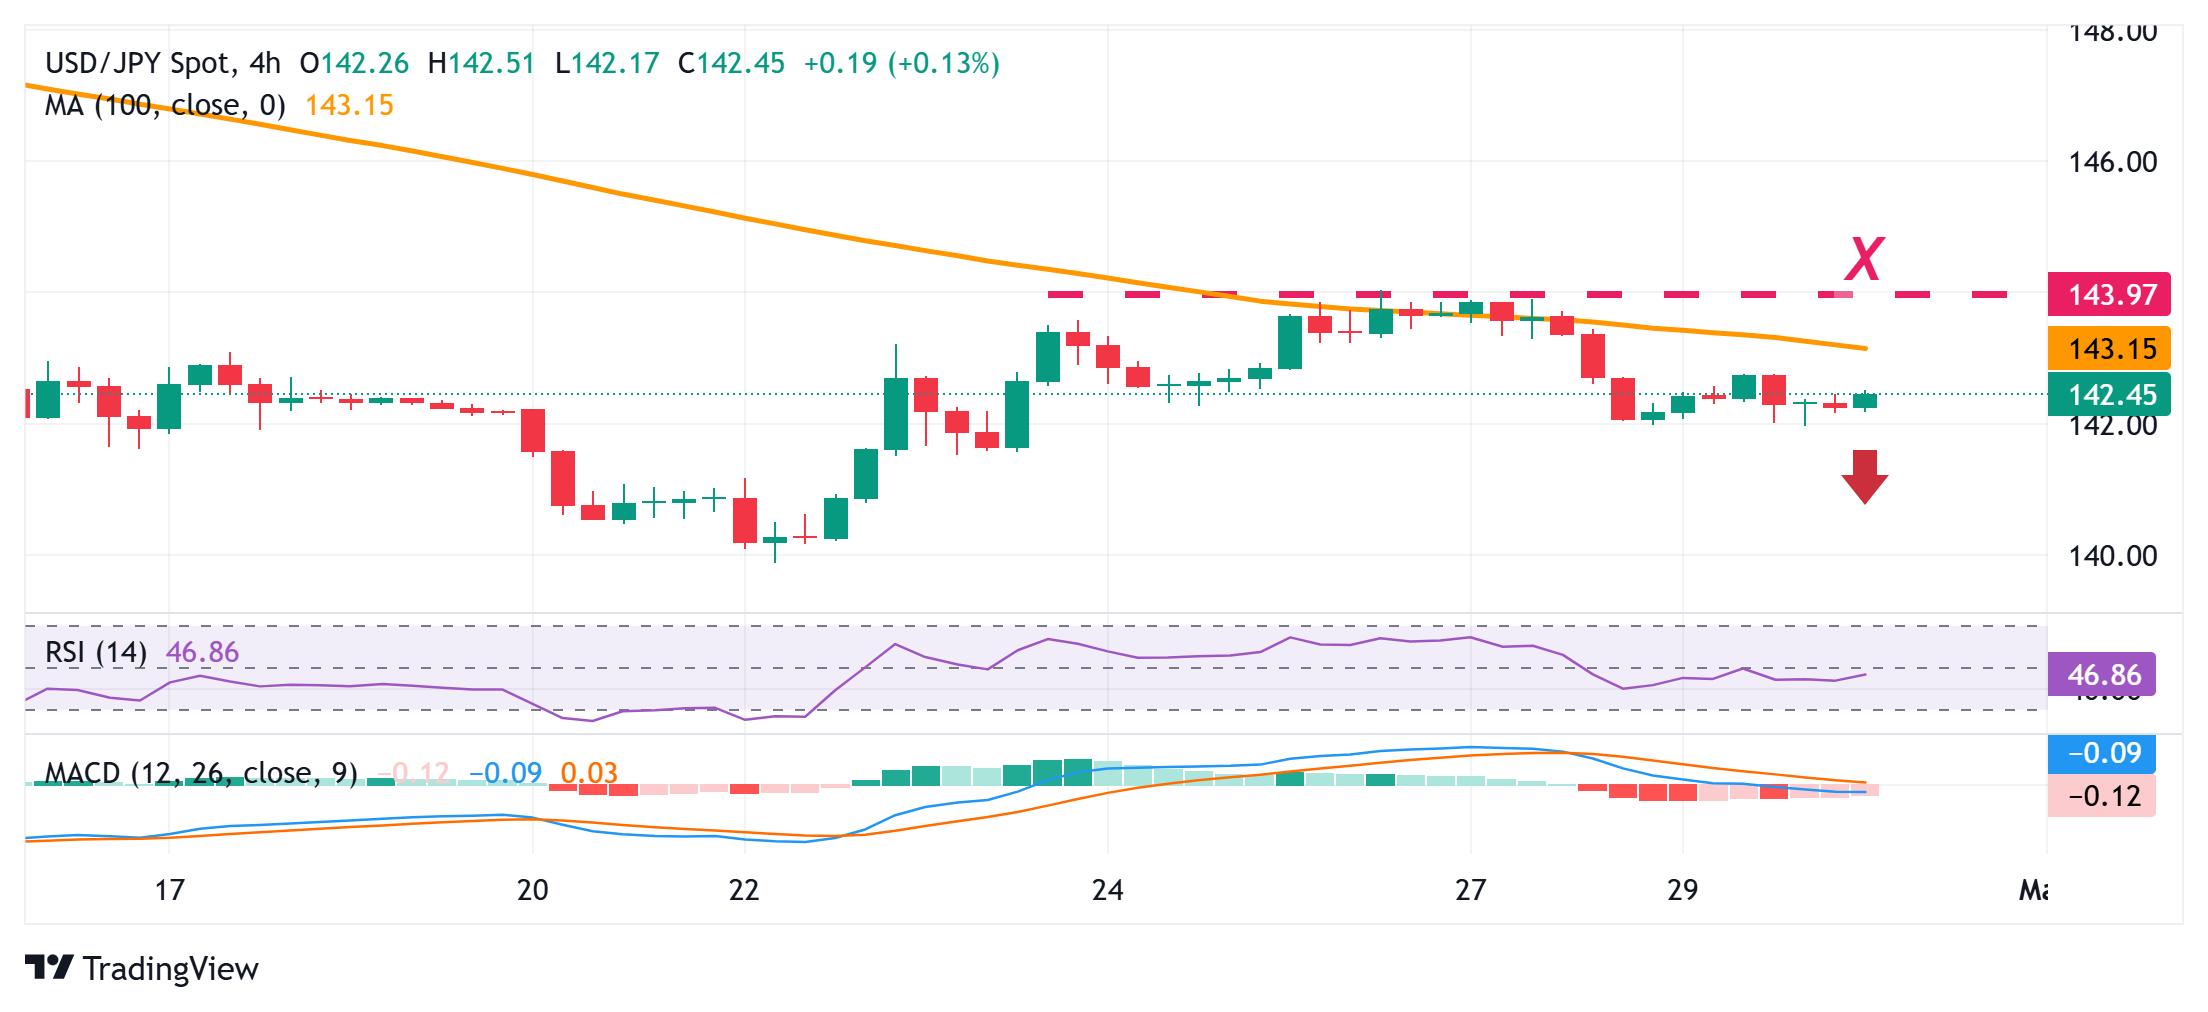
USD/JPY could accelerate the intraday positive move once the 142.60-142.65 immediate hurdle is cleared decisively

From a technical perspective, the USD/JPY pair earlier this week struggled to find acceptance above the 100-period Simple Moving Average (SMA) on the 4-hour chart and faced rejection near the 144.00 mark. The subsequent downfall and negative oscillators on hourly/daily charts validate the near-term negative outlook. That said, it will still be prudent to wait for some follow-through selling below the 142.00 mark before positioning for deeper losses. Spot prices might then accelerate the fall towards the mid-141.00s en route to the 141.10-141.00 region. The downward trajectory could extend further towards the 140.50 intermediate support before the pair eventually drops to the multi-month low – levels below the 140.00 psychological mark touched last week.

On the flip side, the 142.60-142.65 region is likely to act as an immediate hurdle, above which a bout of a short-covering could lift the USD/JPY pair beyond the 143.00 mark, towards the next relevant resistance near the 143.40-143.45 zone. A sustained strength beyond the latter should allow spot prices to conquer the 144.00 round figure. Acceptance above the latter would suggest that the currency pair has formed a near-term bottom and pave the way for some meaningful upside.

pop

EUR/USD flat lines below 1.1400 mark ahead of Eurozone/US macro data

EUR/USD holds the recovery below 1.1400 in early Europe on Wednesday, though it lacks any follow-through amid a modest US Dollar uptick. The pair remains confined in a familiar range held over the past week or so as traders aswait the top-tier German, EU and US GDP data for fresh impetus.

EUR/USD faces immediate resistance at the 2025 high of 1.1572, followed by the 1.1600 handle and the October 2021 top at 1.1692.

Interim support remains firm at the 55-day SMA at 1.0882, prior to the critical 200-day SMA at 1.0773, with a secondary floor at the weekly low at 1.0732.

Momentum remains skewed to the upside, with the Relative Strength Index (RSI) around 61 and the Average Directional Index (ADX) holding above 51—pointing to a strong underlying trend.

The European currency gave away part of Monday’s gains vs. the US Dollar (USD), motivating EUR/USD to retreat to the 1.1370 region following an early advance to the 1.1420-1.1425 band.

On the other side of the equation, the US Dollar Index (DXY) managed to regain some balance and approach the 99.40 zone, where that bullish attempt seems to have fizzled out.

Tariff hopes tempered by market scepticism
The firmer note around the US Dollar came in as investors continued to digest hints by the White House of a possible de-escalation of the trade conflict with China. However, investors remained cautious, with many expressing doubt over whether concrete progress is being made behind the scenes.

Central bank divergence remains well in place
The Federal Reserve (Fed) left its benchmark rate unchanged at 4.25%–4.50% in March, with Chair Jerome Powell emphasising the Fed’s continued commitment to fighting inflation. He reiterated that policy will remain data-driven, particularly as new tariffs raise concerns over potential stagflation.

Meanwhile, the European Central Bank (ECB) moved in the opposite direction, delivering a 25 basis-point rate cut to 2.25% and softening its language by removing references to “restrictive” policy. The dovish tone has raised expectations for another cut as early as June, further widening the policy divergence with the Fed.

Speculative bets continue to favour the Euro
CFTC data through April 22 revealed steady optimism toward the single currency, with net long positions easing a tad to around 65K contracts, or two-week lows. Commercial hedgers, meanwhile, maintained their short exposure around 118K contracts, while open interest increased to six-week peaks near 720K contracts.

eur_456

GBP/USD tests key resistance at 1.3430–1.3500

The Pound Sterling (GBP) is approaching a critical technical zone against the US dollar, challenging last year’s high and the top of a long-term ascending channel. While momentum indicators remain strong, the risk of a short-term pullback is rising if resistance near 1.3500 proves difficult to breach, Société Générale’s FX analysts note.

Support seen near 1.3230 if pullback occurs

“GBP/USD is challenging the peak of last year and the upper limit of an ascending channel drawn since 2023 at 1.3430/1.3500. Daily MACD is at a multiyear high denoting a stretched up-move. This is not a reversal signal, but a brief pullback can’t be ruled out in case the pair fails to establish beyond 1.3430/1.3500.”

“Recent pivot low of 1.3230 is likely to be an important support near term. Beyond 1.3500, next objectives could be located at projections of 1.3620 and 1.3740/1.3810.”

mmm

EUR/USD holds losses below 1.1400 amid US Dollar recovery

EUR/USD remains pressured below 1.1400 in the European trading hours on Tuesday. The Euro weakens amid rising expectations of further ECB interest rate cuts while the US Dollar draws support from some progress on US trade deals with its major global trading partners. US jobs data awaited.

The Relative Strength Index (RSI) indicator on the 4-hour chart stays slightly above 50, suggesting that sellers remain reluctant to bet on an extended slide despite the recent pullback.

In case EUR/USD drops below 1.1390-1.1400 (50-period Simple Moving Average (SMA), Fibonacci 23.6% retracement of the latest uptrend) and confirms this area as resistance, technical sellers could take action. In this scenario, 1.1300 (100-period SMA) could be seen as next support before 1.1270 (Fibonacci 38.2% retracement).

On the upside, interim resistance seems to have formed at 1.1430 (static level) before 1.1500 (static level, round level).

The data from the US showed on Monday that the Federal Reserve Bank of Dallas’ Texas Manufacturing Business Index slumped to its weakest level in nearly five years at -35.8 in April from -16.3 in March. This reading revived fears over an economic downturn in the US and caused the US Dollar (USD) to weaken against its major rivals.

In the second half of the day on Tuesday, JOLTS Job Openings for March and the Conference Board’s Consumer Confidence Index data for April will be featured in the US economic docket.

A significant decrease in the number of job openings could be seen as a sign of worsening conditions in the labor market and weigh on the USD with the immediate reaction. On the flip side, a positive surprise, with a reading above 8 million, could support the currency and cause EUR/USD to stretch lower.

The CME FedWatch Tool currently shows that markets see a nearly 60% probability of a rate cut in June after the Federal Reserve (Fed) keeps policy settings unchanged in May. In case disappointing data releases from the US allow investors to lean toward a rate reduction in June, the market positioning suggests that the USD has room on the downside.

Untitled

Gold steadies as traders look for direction on Trump tariffs

Gold’s price (XAU/USD) stabilizes and consolidates within a tight range near the $2,900 level at the start of the week. Traders are mulling over comments from United States (US) President Donald Trump after an interview on Fox News over the weekend. When asked about the US economy, President Trump said that the economy is in a ‘transition’ phase, while markets have already floated the idea that the US economy is in a recession scenario.

Meanwhile, Federal Reserve (Fed) Chairman Jerome Powell issued some remarks on Friday before the Fed’s blackout period started. That blackout period precedes the actual policy rate decision on March 19, where expectations are for keeping the policy rate steady. Powell said that the central bank does not need to do anything at this point and that the price for keeping its policy rate steady comes with a very small price against the chances of a policy mistake by changing interest rates preemptively.

Technical Analysis: Time to come off the boil

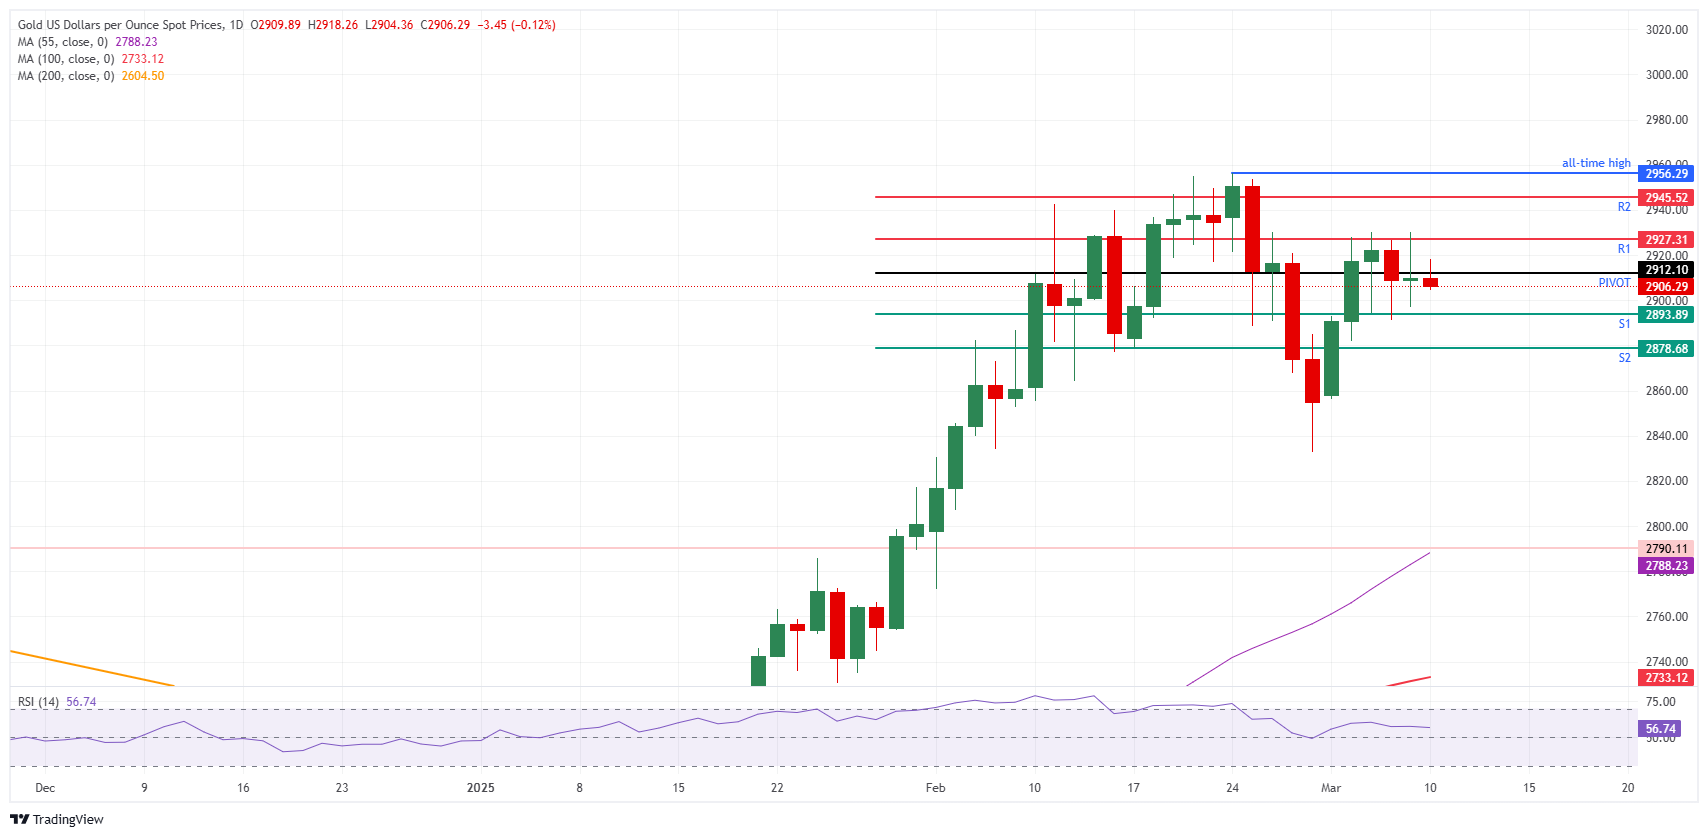
It is time for markets to settle down and see a pullback after stretched positions and moves on the charts. The same goes for Bullion, where the precious metal would benefit from a pullback. Should President Trump remain relatively quiet on any additional tariffs, the nervousness would start to settle and would see Gold dipping towards the S2 support of the daily Pivot Point near $2,878 or even lower, ideal for bulls to get back in before reciprocal tariffs are set to hit by next month.

While Gold trades near $2,905 at the time of writing on Monday, the daily Pivot Point at $2,912 and the daily R1 resistance at $2,927 are the key levels to watch for. In case Gold sees more inflows, the daily R2 resistance at $2,945 will possibly be the final cap ahead of the all-time high of $2,956 reached on February 24.

On the downside, the $2,900 psychological big figure and the S1 support at $2,893 acts as a double support barrier. If Bullion bulls want to avoid another leg lower, that zone must hold. Further down, the daily S2 support at $2,878 should be able to catch any additional downside pressure.

XAU/USD: Daily Chart

XAU/USD: Daily Chart

mun

EUR/USD: Likely to trade sideways between 1.0800 and 1.0890

Euro (EUR) is likely to trade sideways between 1.0800 and 1.0890 vs US Dollar (USD). In the longer run, uptrend remains intact, but it is unclear for now if EUR can reach 1.0945, UOB Group’s FX analysts Quek Ser Leang and Peter Chia note.

Uptrend remains intact

24-HOUR VIEW: “We highlighted last Friday that ‘the current price movements are likely part of a range trading phase, probably between 1.0740 and 1.0840.’ We did not expect the continued advance in EUR, as it rose to 1.0888 during the NY session and then pulled back to close at 1.0832 (+0.45%). Despite the rise, there has been no clear increase in upward momentum. Today, instead of continuing to rise, EUR is more likely to trade sideways between 1.0800 and 1.0890.”

1-3 WEEKS VIEW: “We shifted our view to positive early last week (as annotated in the chart below). Tracking the subsequent sharp rally, we indicated last Friday (07 Mar, spot at 1.0790) that ‘while the uptrend remains intact, at this stage, it is unclear for now if EUR can reach 1.0945.’ Although EUR subsequently rose to 1.0888, conditions are deeply overbought, and it remains unclear for now if it can reach 1.0945. Overall, only a breach of 1.0690 (‘strong support’ level previously at 1.0640) would suggest that the sharp rally is ready to take a breather.”

Pound Sterling grips gains against US Dollar as investors doubt US economic strength

Pound Sterling grips gains against US Dollar as investors doubt US economic strength

The Pound Sterling (GBP) clings to gains slightly above 1.2900 against the US Dollar (USD) in Monday’s European session. The GBP/USD pair strengthens as the US Dollar struggles to gain ground amid growing concerns over the United States (US) economic outlook. The US Dollar Index (DXY), which tracks the Greenback’s value against six major currencies, trades cautiously near the four-month low of 103.50.

Market participants have become increasingly worried over US economic prospects after comments from US President Donald Trump on Friday indicated that his “American First” policies could lead to economic turbulence in the near term.

US President Trump refrained from guiding the impact of his policies on the economy but said in the interview with Fox News that there is a “period of transition”, because what we are doing is very “big”. His comments came after being asked whether his policies could lead to a recession in the economy.

Donald Trump reiterated that reciprocal tariffs will be announced on April 2. Last week, Trump imposed 25% tariffs on imports from Canada and Mexico but exempted many products that come under the purview of the United States-Mexico-Canada Agreement (USMCA) for a month. He also increased surcharges on Chinese imports to 20% by imposing an additional 10%.

Market experts continue to believe that Trump’s tariff policies would be inflationary for the economy, but they have changed their perception of its impact on the economic outlook. At one point when Trump’s agenda was expected to accelerate economic expansion, it is now anticipated to fracture the economy. This has led to global brokerages revising their growth forecasts for the US economy. Goldman Sachs has downgraded its Q4 2025 Gross Domestic Product (GDP) growth forecast to 1.7%, from 2.2% previously anticipated, and raised its 12-month recession probability to 20% from 15%.

Investors also expect the Federal Reserve (Fed) would be forced to resume the policy-easing cycle as early as June. However, Fed Chair Jerome Powell reiterated in an economic forum at the University of Chicago Booth School on Friday that the interest rate policy is in “good shape” and the central bank wants clarity on Trump’s policies before making any monetary policy adjustment.

Technical Analysis: Pound Sterling stays above 200-day EMA
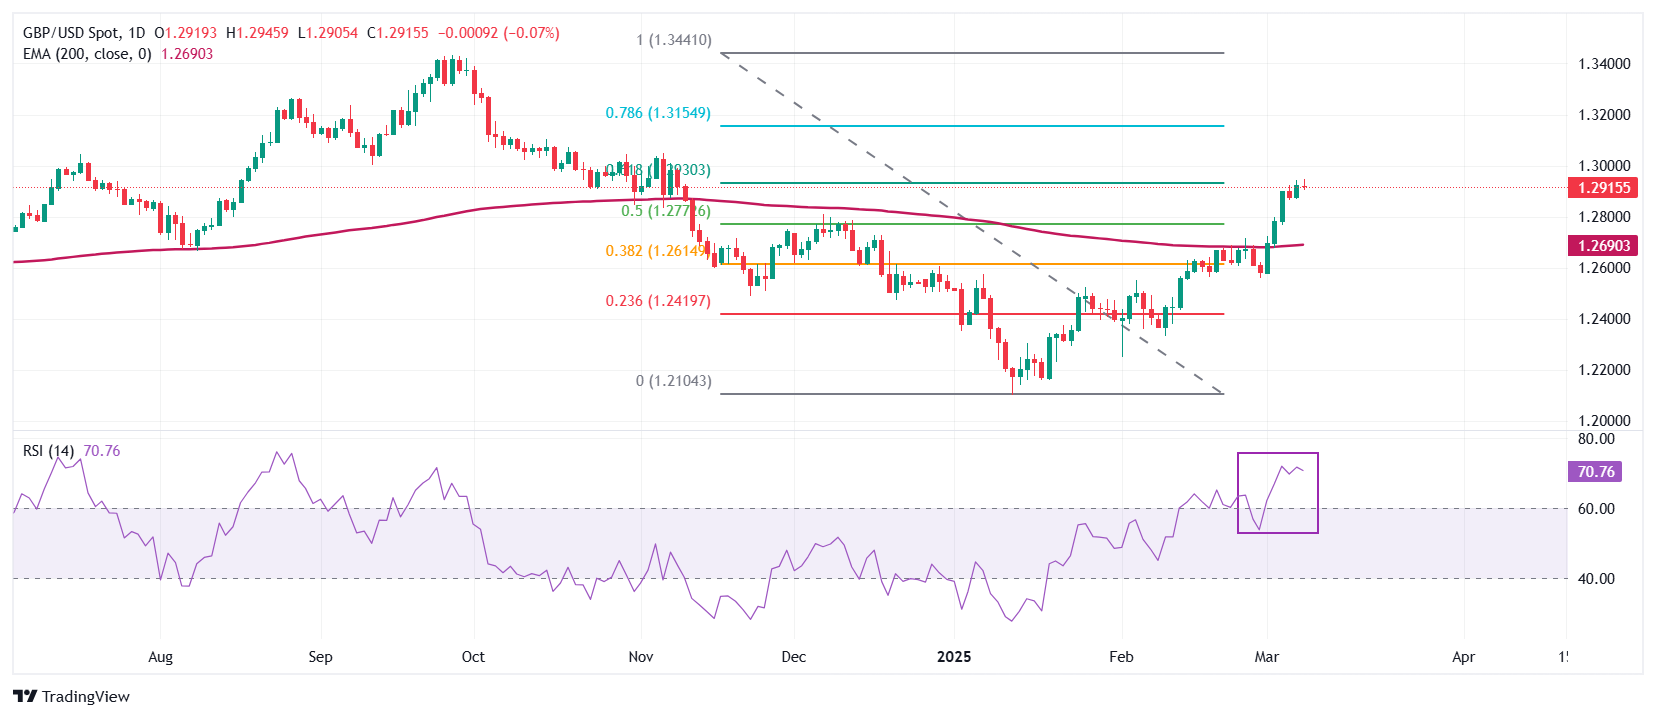
The Pound Sterling strives to break above the 61.8% Fibonacci retracement plotted from the late September high to mid-January low around 1.2930 on Friday. The long-term outlook of the GBP/USD pair has turned bullish as it holds above the 200-day Exponential Moving Average (EMA), which is around 1.2690.

The 14-day Relative Strength Index (RSI) climbs above 70.00, suggesting a strong bullish momentum.

Looking down, the 50% Fibo retracement at 1.2767 and the 38.2% Fibo retracement at 1.2608 will act as key support zones for the pair. On the upside, the psychological 1.3000 level will act as a key resistance zone.


mmty

US: An underwhelming jobs report with government shrinkage featuring in Feb payrolls

The latest US Employment Situation report by the Bureau of Labor Statistics (BLS) last Fri (7 Mar) was weaker than expected as jobs creation came in below projections with a surprise uptick in the unemployment rate while wage growth was within estimates, UOB Group’s Senior Economist Alvin Liew notes.

US reports a slightly weaker-than-expected jobs creation

“The US reported a slightly weaker-than-expected jobs creation at 151,000 in Feb (versus Bloomberg est 160,000) while unemployment rate also surprised with an uptick to 4.1% (from 4.0% in January). Job creation was still broad-based, but surprisingly, professional services and leisure recorded back-to-back losses, while government hiring slowed visibly as BLS reported that federal employment fell by -10,000 in February.”