The Australian Dollar (AUD) extends its gains against the US Dollar (USD) for a second consecutive day on Tuesday, rebounding from 0.6131, its lowest level since April 2020. The AUD/USD pair strengthened as the AUD benefitted from robust commodity prices.
US President-elect Donald Trump’s economic team considers a gradual increase in import tariffs boosted investor confidence, supporting the risk-sensitive currencies like the AUD and contributing to the appreciation of the AUD/JPY pair.
The S&P/ASX 200 Index also increased by 0.2% to around 8,210 on Tuesday, snapping a three-day losing streak. Mining and energy stocks led the recovery, while Australian shares followed overnight gains on Wall Street, where investors shifted focus from megacap tech stocks to other sectors.
Traders analyzed data showing a second consecutive monthly drop in consumer confidence. Australia’s Westpac Consumer Confidence Index fell by 0.7% to 92.1 points in January 2025, highlighting persistent pessimism among consumers.
The AUD/USD pair faces downward pressure as markets price in a 75% probability of a rate cut by the Reserve Bank of Australia (RBA) next month. Investors are expected to closely monitor Australian employment data, set to be released later this week, for additional clarity on the RBA’s policy outlook.
The AUD also found some support from China’s recent stimulus measures, given the close trading relationship between Australia and China, any changes in China’s economic conditions could significantly influence Australian markets.
Technical Analysis: Australian Dollar advances to near nine-day EMA, 0.6200
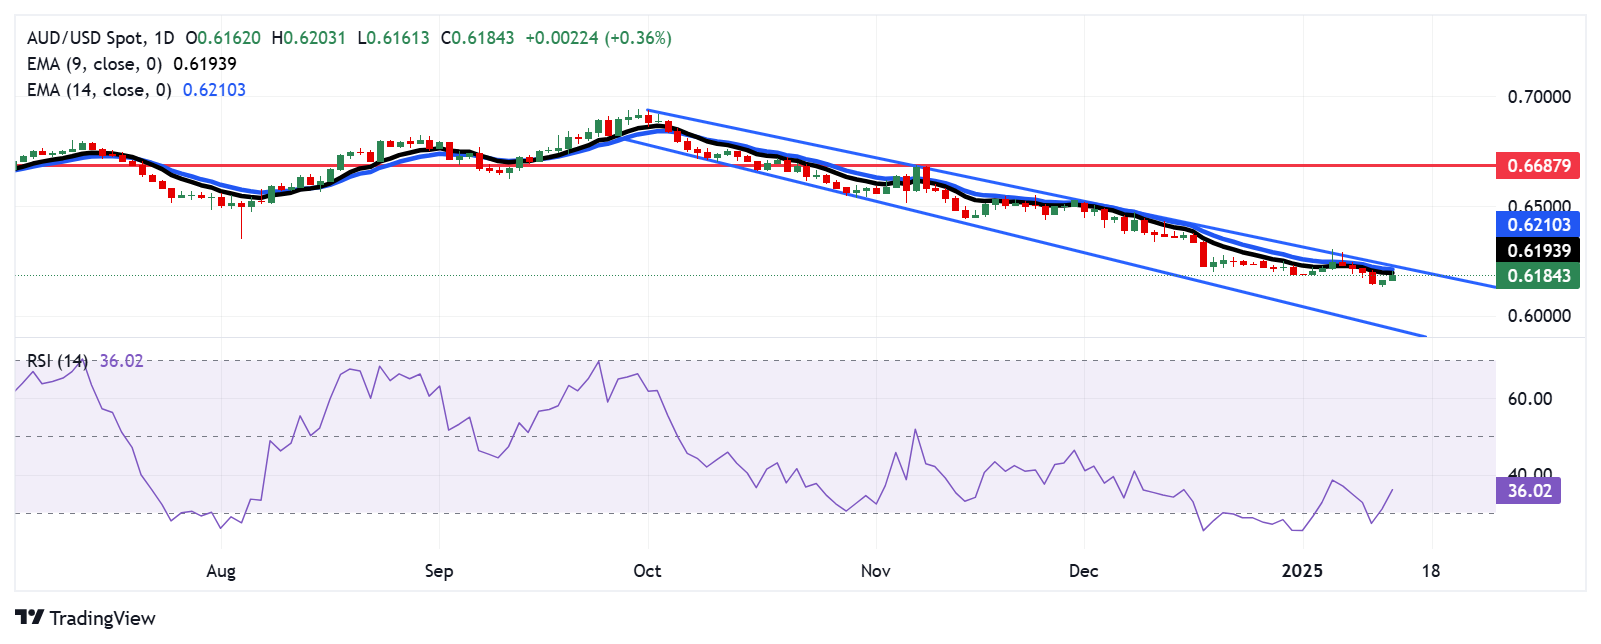
The AUD/USD pair trades around 0.6190 on Tuesday, maintaining its bearish outlook as it remains within a descending channel on the daily chart. The 14-day Relative Strength Index (RSI) has climbed above the 30 level, indicating a recovery from oversold conditions.
The pair faces immediate resistance at the nine-day Exponential Moving Average (EMA) at 0.6193, followed by the 14-day EMA at 0.6210. A more significant resistance level lies near the upper boundary of the descending channel, around 0.6230.
On the downside, the AUD/USD pair may test support at the lower boundary of the descending channel, close to the 0.5940 level.
Here is what you need to know on Tuesday, January 14:
Following a mixed close on Wall Street overnight, markets witnessed a sluggish performance in Asian indices as Japanese markets reopened on a negative note.
However, risk sentiment shifted in favor of optimists after Chinese stocks rebounded the most in over two months, eyeing a press conference jointly hosted by the People’s Bank of China (PBoC) and the State Administration of Foreign Exchange (SAFE) this Tuesday to see if Beijing will step up efforts to shore up the economy and defend its currency.
The risk recovery is fuelling a fresh leg lower in the safe-haven US Dollar (USD) in the early European trading hours, boosting forex majors’ recovery paths. The Greenback lost ground late Monday after Bloomberg reported, citing people familiar with the matter, that advisors on US President-elect Donald Trump’s incoming economic team are considering gradually implementation of tariffs, hiking them incrementally each month by 2% to 5%.
Markets are also resorting to profit-taking on the USD long positions ahead of the top-tier US Producer Price Index (PPI) inflation data and speeches from Fed policymakers John Williams and Jeffery Schmid for fresh cues on the world’s most powerful central bank’s interest rate path. Traders are pricing in 29 basis points (bps) of easing this year, less than the 50 bps the Fed projected in December, according to the CME Group’s FedWatch Tool.
The benchmark US 10-year Treasury bond yield extends correction from its highest level since November 2023, adding to the downside in the Greenback.
US Dollar PRICE Today
The table below shows the percentage change of US Dollar (USD) against listed major currencies today. US Dollar was the weakest against the New Zealand Dollar.
USD
EUR
GBP
JPY
CAD
AUD
NZD
CHF
USD
-0.35%
-0.27%
-0.11%
-0.12%
-0.50%
-0.85%
-0.27%
EUR
0.35%
0.07%
0.21%
0.22%
-0.16%
-0.50%
0.08%
GBP
0.27%
-0.07%
0.15%
0.15%
-0.23%
-0.57%
0.01%
JPY
0.11%
-0.21%
-0.15%
-0.01%
-0.39%
-0.74%
-0.16%
CAD
0.12%
-0.22%
-0.15%
0.01%
-0.38%
-0.72%
-0.14%
AUD
0.50%
0.16%
0.23%
0.39%
0.38%
-0.33%
0.24%
NZD
0.85%
0.50%
0.57%
0.74%
0.72%
0.33%
0.59%
CHF
0.27%
-0.08%
-0.01%
0.16%
0.14%
-0.24%
-0.59%
The heat map shows percentage changes of major currencies against each other. The base currency is picked from the left column, while the quote currency is picked from the top row. For example, if you pick the US Dollar from the left column and move along the horizontal line to the Japanese Yen, the percentage change displayed in the box will represent USD (base)/JPY (quote).
Across the FX board, USD/JPY remains on the back foot near 157.50 after witnessing sharp moves in Asia in the wake of Bank of Japan (BoJ) Deputy Governor Ryozo Himino’s commentary. Himino said the central bank will debate whether to raise rates next week as prospects of sustained wage gains heighten.
AUD/USD clings to recovery gains at around 0.6200 amid risk-rally in Chinese stocks on stimulus hopes. However, the divergent policy outlook between the Fed and the Reserve Bank of Australia (RBA) and looming US-Sino trade risks keep the upside limited.
EUR/USD holds firm above 1.0250, recovering from 26-month lows of 1.0773 set on Monday. Broad US Dollar pullback and retreating US Treasury bond yields offset the recent dovish ECB-speak, boding well for the pair amid a risk-on mood. T
The Pound Sterling rejoices some gains above 1.2200 against the US Dollar correction. GBP/USD hit a 15-month low of 1.2100 on Monday, undermined by the UK’s fiscal health and increased inflationary concerns under the Trump 2.0 era.
USD/CAD is off the low but remains below 1.4400 even as Oil prices retrace from three-month highs. WTI oil price is down 0.50% on the day, trading near $77 as of writing.
Gold price attempts another run to recapture the $2,700 in the European session on Tuesday, looking to resume the upside fuelled by the symmetrical triangle breakout on the daily chart.
EUR/USD halts its five-day losing streak, trading around 1.0250 in Tuesday’s European trading hours. A broadly stable US Dollar and a positive risk sentiment leave the pair gyrating in a familiar range as traders await the US PPI inflation data and Fedspeak for fresh trading impetus.
Another positive day in the Greenback saw EUR/USD slip back below the 1.0200 key support, hitting a new cycle low and opening the door to a probable challenge to the parity zone sooner rather than later.
Meanwhile, the US Dollar (USD) extended its bull run for the fifth straight day, surpassing the 110.00 level when measured by the US Dollar Index (DXY). The move higher in the Greenback came as investors continued to assess the likelihood that the Federal Reserve (Fed) might cut rates only once this year (if any at all).
In addition, caution prevailed as markets looked ahead to this week’s key US CPI report, Retail Sales data and comments from Fed officials.
Central banks in the spotlight
Monetary policy continues to shape market sentiment. Following another strong reading from the US Nonfarm Payrolls for December (+256K), market participants have significantly reduced their expectations for Fed rate cuts. They now anticipate the Fed will either lower rates by 25 basis points in 2025 or hold them steady altogether.
On December 18, the Federal Reserve trimmed its benchmark interest rate by 25 basis points to 4.25%-4.50%. However, it signalled a more cautious pace of easing for the coming year, with many officials expressing concerns about the potential resurgence of inflation.
During his final press conference of 2024, Chair Jerome Powell emphasized that policymakers remain focused on bringing inflation closer to the 2% target before considering further rate cuts. He acknowledged that inflation has exceeded year-end expectations, reinforcing the need for continued efforts to achieve price stability.
Powell also noted that while the labour market is softening, the adjustment has been gradual and orderly. He described current economic conditions as relatively balanced between the Fed’s dual mandates of maintaining low inflation and achieving full employment.
Across the Atlantic, the European Central Bank (ECB) is expected to continue its easing cycle despite a recent uptick in December inflation figures in both Germany and the broader eurozone. The ECB’s ongoing rate cuts appear to be aimed at revitalizing the region’s gloomy economic outlook—particularly in Germany—and mitigating the risk of political instability affecting the economy.
Trade policy adds a twist
The potential return of trade tariffs, as proposed by President-elect Donald Trump, could add complexity to the economic landscape. Such measures might push US inflation higher, forcing the Fed to adopt a more aggressive policy stance. This could strengthen the USD further, placing additional pressure on EUR/USD in the coming months.
What’s next this week
Industrial Production figures in the euro area are due on January 15, along with the final Inflation Rate in Germany and the ECB’s Accounts on January 16. Closing the weekly docket will be the release of the final Inflation Rate in the Euroland seconded by Current Account results.
Bottom Line
The EUR/USD is struggling to find its footing, pressured by a strong US Dollar, lingering political uncertainties, and a growing divide in monetary policy approaches between the Fed and the ECB. Adding to the euro’s challenges is the bleak economic outlook for the eurozone, with Germany’s slowdown casting a shadow over the region’s prospects in the months ahead.
Today, you will know how to make money on Forex using your trader profile of one of the world’s leading finance brokers, LiteFinance. You will learn how to enter and exit your trades in Forex to make profits.
Well, to start trading and making real money, you will need to register a trader profile and open a trading account with a broker that will provide access to the global foreign exchange market. This must be a real account, on demo accounts you just check your trading plan but you can’t take part in real currency trading or stock trading.
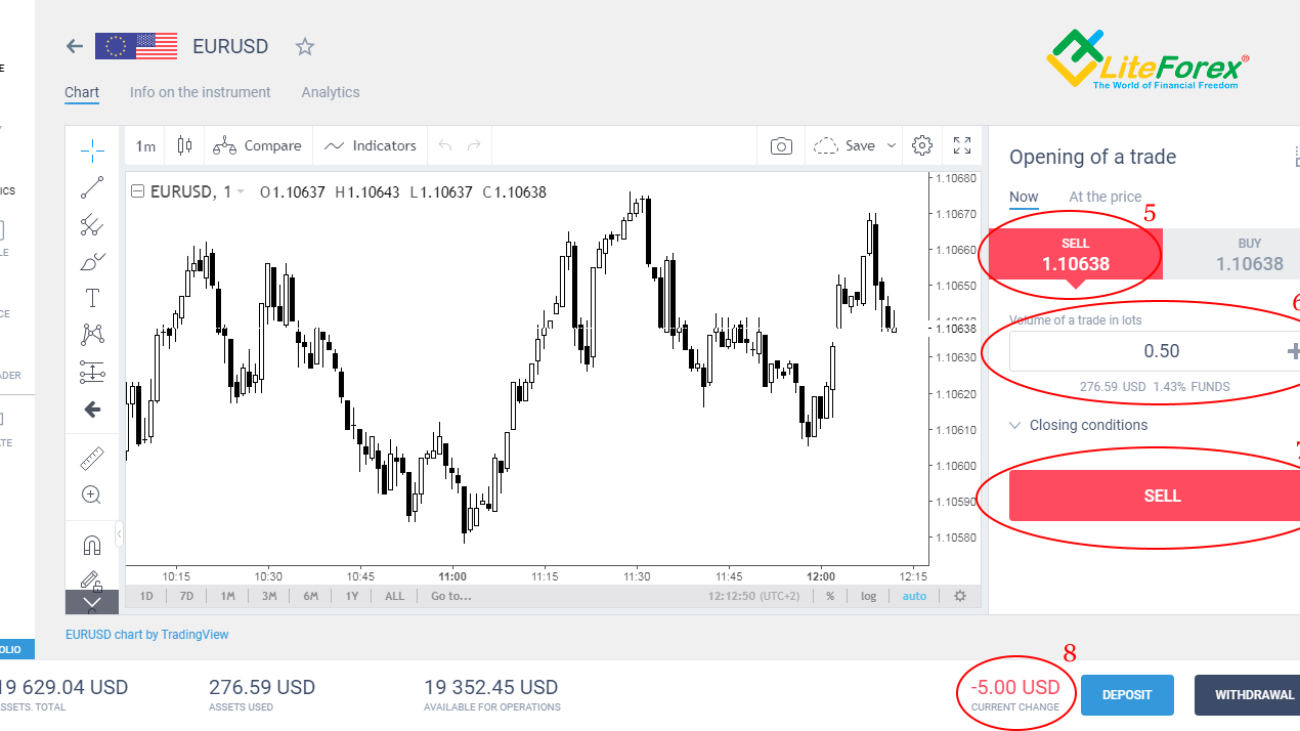
The main page of your profile looks like the one in the figure above. Now, let us see what each section means:
1. Of course, we can’t speak about any profit if do not have a real account or any money on the account. In the LiteFinance trader space, your first real trading account is automatically created when you register your personal (client) profile. So, to earn any money, you first need to top up your account with your online broker. To top up your trading account, click on the “DEPOSIT” account. There will open a window where you are offered numerous ways of depositing your brokerage account, from a bank transfer or a credit card to various online wallets or payment systems. In general, everything is simple and easy.
2. After you put some deposit on your account, you will see a change in your funds in the trade panel in the bottom left corner. The tab is called ASSETS TOTAL.
Choose a trading instrument
3. After your trading account is topped up, you can start making money. First, you need to select a trading instrument (an asset you are going to trade). We won’t be extravagant and choose the most traded currency pair EURUSD as an example(here, the euro is a base currency and the dollar is a quote currency or a counter currency, because you always trade a currency pair, not a single currency). Click on the EURUSD tab and there will open a terminal window with the currency pair we have chosen.
4. There is a price chart in the middle of the window. There are various types of price charts, but it displays a candlestick chart by default. The price chart depends on your trading style, indicator trading, price action strategies or robo advisors will use different types of trading charts. To determine the trade direction (whether we will buy or sell), we need to perform a technical analysis of the chart to see the current market conditions. As we can make profits form both the price rise and the price fall, we need to find out what will happen to the price later, if it will rise or decline. If we assume that the price will fall, then we need to sell the pair now, when the price is higher then it will be, then, when the price falls, we will buy it at a lower price and earn on the difference. If we assume that the price will continue rising, it is better to buy now, while the price is low. And when the price goes up, we can sell it at a higher price and benefit. Well, we should make a trading decision. It is basically quite easy if you know the basics of technical analysis. You can use the Analytics section in your profile. There is currently a sell signal for this currency pair. We shall follow it and enter a sell trade.
Enter a trade
5. To enter a sell trade, choose the Sell trade. There, by the way, will be the price, which you enter your trade at.
6. Next, we need to set the volume of our trade. This is the amount of money we want to invest in the trade. The more money you put in the trade, the more is your potential income. However, the more you invest, the more you risk. So, we choose the golden mean. The trade volume on the exchange is conventionally called the lot. One lot unit is 100,000 units of the base currency. We couldn’t enter a trade if the broker didn’t provide financial leverage. But fortunately, our broker helps us offering leverage, so 1 lot costs us just about 500 dollars. However, based on my own experience, it is rather risky to enter a trade with a whole lot. According to the basics of risk management, you’d better decrease the trade volume at least by half. So, we choose the volume of 0.5 lots, which will be roughly 280 dollars.
7. Well, we now need just to click on the “sell” button. Once we pushed this button, we give our broken an order. A new order is instantly placed in the global market. And when your order is put, there will be a confirming message specifying the price, at which your order has been executed by the broker.
8. You will see the trade entered by the changes in the information displayed on the trade panel at the bottom of your screen. The Current Change tab now displays the changes in the balance of our trading account in real-time. Differently put, we can now see the profit or the loss yielded by our trade. Although the price hasn’t changed since we entered the trade, the current change shows a loss of -5.00 USD. What has happened? It is not strange. We have paid the commission charged for opening a position and spread, the difference between the buy and the sell price. Now, we first need to gain and compensate for this commission, and then, we will make a profit. In real trading, this commission is not so high as it seems; it is just about 1%-2% of the position size. If you open long-term positions with the holding time of 1 week and longer, and with a profit of a few thousand dollars, you won’t even notice a commission fee of 5 USD.
Managing your trade and making a profit
9. After a while, we can look at the price chart. We have been right, and the price is going down generating a profit from our sell trade.
10. Look at the Current Change line. The value is now positive, its color is green. This means that the order we put has already made a profit of +$18.
11. If we think this profit to be enough, we can safely click on the “close” button. This will signal that we are going to close our sell trade at the current price and take our profit to enroll it on our trade account. If you complete your trade (that is enter and exit) within the same day, this is a day trading and you are a day trader.
12. After the trade is exited, no changes are registered on the balance account, it is now fixed at an amount that is more than it was before we entered a trade as we have made a profit.
13. To realize that our profit is real, physical money, we can withdraw it from the trading account. To do this, we need to click on the WITHDRAWAL button.
14. Now, try to make a few trades on your own, and you’ll see that it is quite easy. There is nothing to complicated in making money on the forex market.
Seven golden rules of a trader
Every trader is aimed at gaining profit, therefore wishing to know the best entry and exit points for the deal. We also know that trading is a kind of business, which always involves risk and therefore, requires risk management. These issues are determined by a trading strategy selected by a trader.
Rule №1
Your trading decisions shall be well deduced. A trader cannot just enter the terminal, look at the chart and open a position. It will be a waste of time and money. Your trading decisions shall be based on the signals of the indicators and oscillators and on the data of the fundamental analysis. This is the only way to conduct trade.
Rule №2
Use moderate margins in your trading. Do not try to use the largest leverage even for the trades, which seem lossless. A trader shall never forget that trading in the Forex market always involves risks. If you are a beginner we recommend you to use leverage size 1:100, but not higher.
Rule №3
Do not use all amount of your deposit for trading. Use just 20-30% of your capital for trading and leave the rest of the money as a deposit. Such risk diversification will serve you well and help to save your funds.
Rule №4
You must have an alternative access to the terminal and Internet. So that in the event of a power cut or a line breakdown, you can close your trades. This is very important considering that non-trading problems cause a lot of losses in the market.
Rule №5
Exit a trade if the correction lasts longer than you expected. Do not be greedy as you can lose what you have already earned. Usually the beginners do it, as they continue to believe that the price will resume the trend. Just close your trade and get your profit.
Rule №6
Be patient and wait for the strong trend of price. Trading in trends is the most profitable and safe way of trading. First of all, market is more predictable during the strong trend, which encourages to trade even the beginners. Otherwise, during the flat market a trader needs to analyze market thoroughly and make quick trading decisions. The same refers to the weak trend. If trends change very often, market is instable. In this case it is better to wait till volatility reduces and a strong trend develops.
Rule №7
A trader shall always place stop-orders and take-profits. For a professional trader these two orders just a must. Stop-loss is a tool enabling you to leave the market maintaining the highest profit. This pending order is always appropriate due to its “guarding” functions. Just place this order. Take profit orders show what a trader expects from a trade. Take profit enables a trader to determine entry and exit points and the size of the possible profit.
Conclusion
There we are all! As you see, the process of making trades in the modern forex market has become much easier and simpler than it used to be just a decade ago. When you train and gain some experience, it will take just a few seconds to go through all these 14 steps and enter a trade. A trader spends most of the working time on the price chart analysis. You will learn how to analyze the price chart to make the most of your trade from the next training articles. I will explain the basics of the support and resistance levels, how to calculate your profit targets and protect your trade form a loss. I wish you profits and hope this article was helpful to you.
P.S. Did you like my article? Share it in social networks: it will be the best “thank you” 🙂
Ask me questions and comment below. I’ll be glad to answer your questions and give necessary explanations.
The content of this article reflects the author’s opinion and does not necessarily reflect the official position of LiteFinance. The material published on this page is provided for informational purposes only and should not be considered as the provision of investment advice for the purposes of Directive 2004/39/EC.
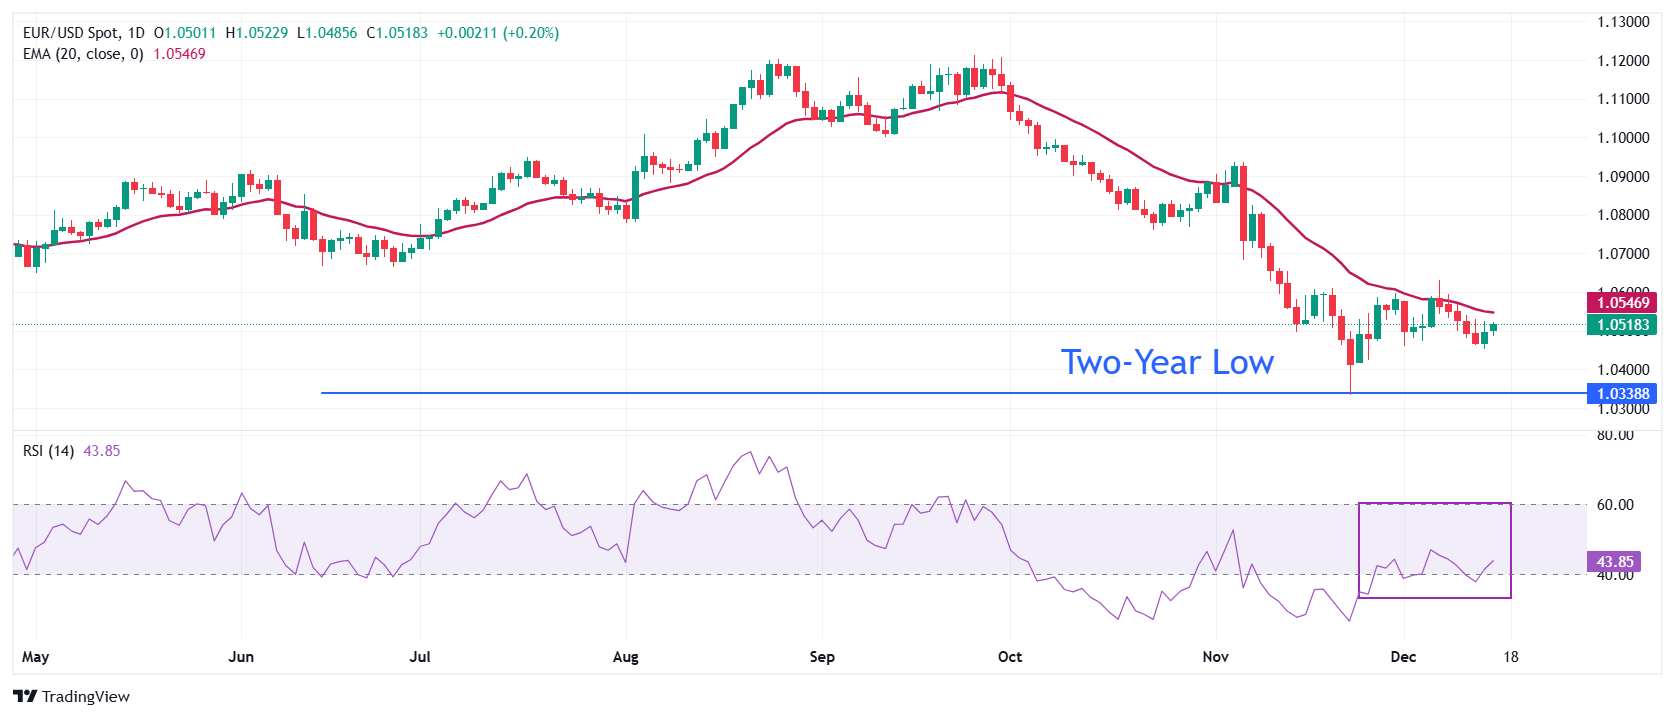
EUR/USD stays near 1.0515 in Monday’s European session even though the preliminary Eurozone HCOB Purchasing Managers’ Index (PMI) data for December has come in better than forecasted. The PMI report showed that overall business activity improved to 49.5 from 48.3, suggesting that the private sector activity contracted at a slower pace. An improvement in the overall activity came from higher service sector output, which returned to the expansion territory after contracting in November. The Services PMI, which gauges activity in the services sector, surprisingly expanded to 51.4 from 49.5. Economists expected the Services PMI to have declined at a slightly faster pace to 49.4. The Manufacturing PMI contracted at a steady pace to 45.2, slower than estimates of 45.0. A figure below 50.0 is taken as a contraction in economic activities.
The German and French Composite PMIs have also come in better than expected, mainly due to a sharp improvement in the service sector activity. However, the Composite PMI remained below the 50.0 threshold, a figure that separates expansion from contraction.
The overall scenario supports more interest rate cuts from the European Central Bank (ECB) and weighs on the Euro (EUR).
The ECB cut its Deposit Facility rate by 25 basis points (bps) to 3% on Thursday, accumulating a total of 100 bps interest rate reductions this year. Given that Eurozone inflation has come under control and officials are worried about growing economic risks, market participants expect the ECB to deliver another 100 bps reduction in its key borrowing rates by June 2025.
A significant number of ECB policymakers, including President Christine Lagarde, have backed further policy easing and a gradual move towards the neutral rate, which they expect to be around 2%. “Will cut rates further if incoming data confirm that disinflation is on track”, Lagarde said at an Annual Economics Conference in Monday’s European session. Lagarde’s dovish remarks on the policy outlook were backed by the assumption that “Inflation momentum for services has dropped steeply recently.”
French central bank Governor Francois Villeroy de Galhau told France’s BFM business radio on Friday: “There will be further rate cuts next year.” When asked about interest rate projections, he said, “I note that we are collectively rather comfortable with the financial markets’ interest rate forecasts for next year.”
For more guidance on interest rates, ECB President Christine Lagarde will deliver a keynote speech and participate in a panel at the Bank of Lithuania’s event on European economic and political resilience.
On the political front, French President Emmanuel Macron appointed Francois Bayrou as the new prime minister on Friday. He replaced Michel Barnier, who lost a no-confidence vote because he failed to pass the budget, which included tax hikes worth 60 billion Euros to cut the fiscal deficit. Bayrou, who is expected to face similar challenges in his administration, is scheduled to meet leaders of the Far Right and left wing on Monday and Tuesday, respectively, according to Reuters.
Technical Analysis: EUR/USD stays above 1.0500
EUR/USD trades above the psychological figure of 1.0500 but continues to struggle around the three-day resistance near 1.0535. The major currency pair remains below the 20-day Exponential Moving Average (EMA) around 1.0545, suggesting a bearish near-term trend.
The 14-day Relative Strength Index (RSI) revolves around 40.00. The bearish momentum should trigger if the RSI (14) falls below 40.00.
Looking down, the two-year low of 1.0330 will provide key support. Conversely, the 20-day EMA will be the key barrier for the Euro bulls.
The Pound Sterling (GBP) gains to near 1.2645 against the US Dollar (USD) in Monday’s London session. The GBP/USD pair rises as the US Dollar trades subdued, with the US Dollar Index (DXY) hovering around 107.00. Investors brace for a high level of volatility from the pair this week as both the Federal Reserve (Fed) and the Bank of England (BoE) are set for their last monetary policy meeting of the year on Wednesday and Thursday, respectively.
Divergent moves are expected from both the central banks as the Fed is widely anticipated to cut its key borrowing rates by 25 basis points (bps) to 4.25%-4.50%, while the BoE is expected to leave them unchanged at 4.75%. Still, as the main interest-rate decisions from both the central banks have already been priced in by market participants, investors will be majorly focusing on the policy outlook for 2025.
According to current market expectations, traders expect three interest rate cuts from both central banks in 2025.
This week, the Pound Sterling will also be influenced by the United Kingdom (UK) employment data for three months ending October and the Consumer Price Index (CPI) data for November, which will be released on Tuesday and Wednesday, respectively. Any sharp deviation in the labor market and inflation numbers from estimates could influence market speculation for the BoE interest rate action on Thursday and policy outlook expectations for 2025.
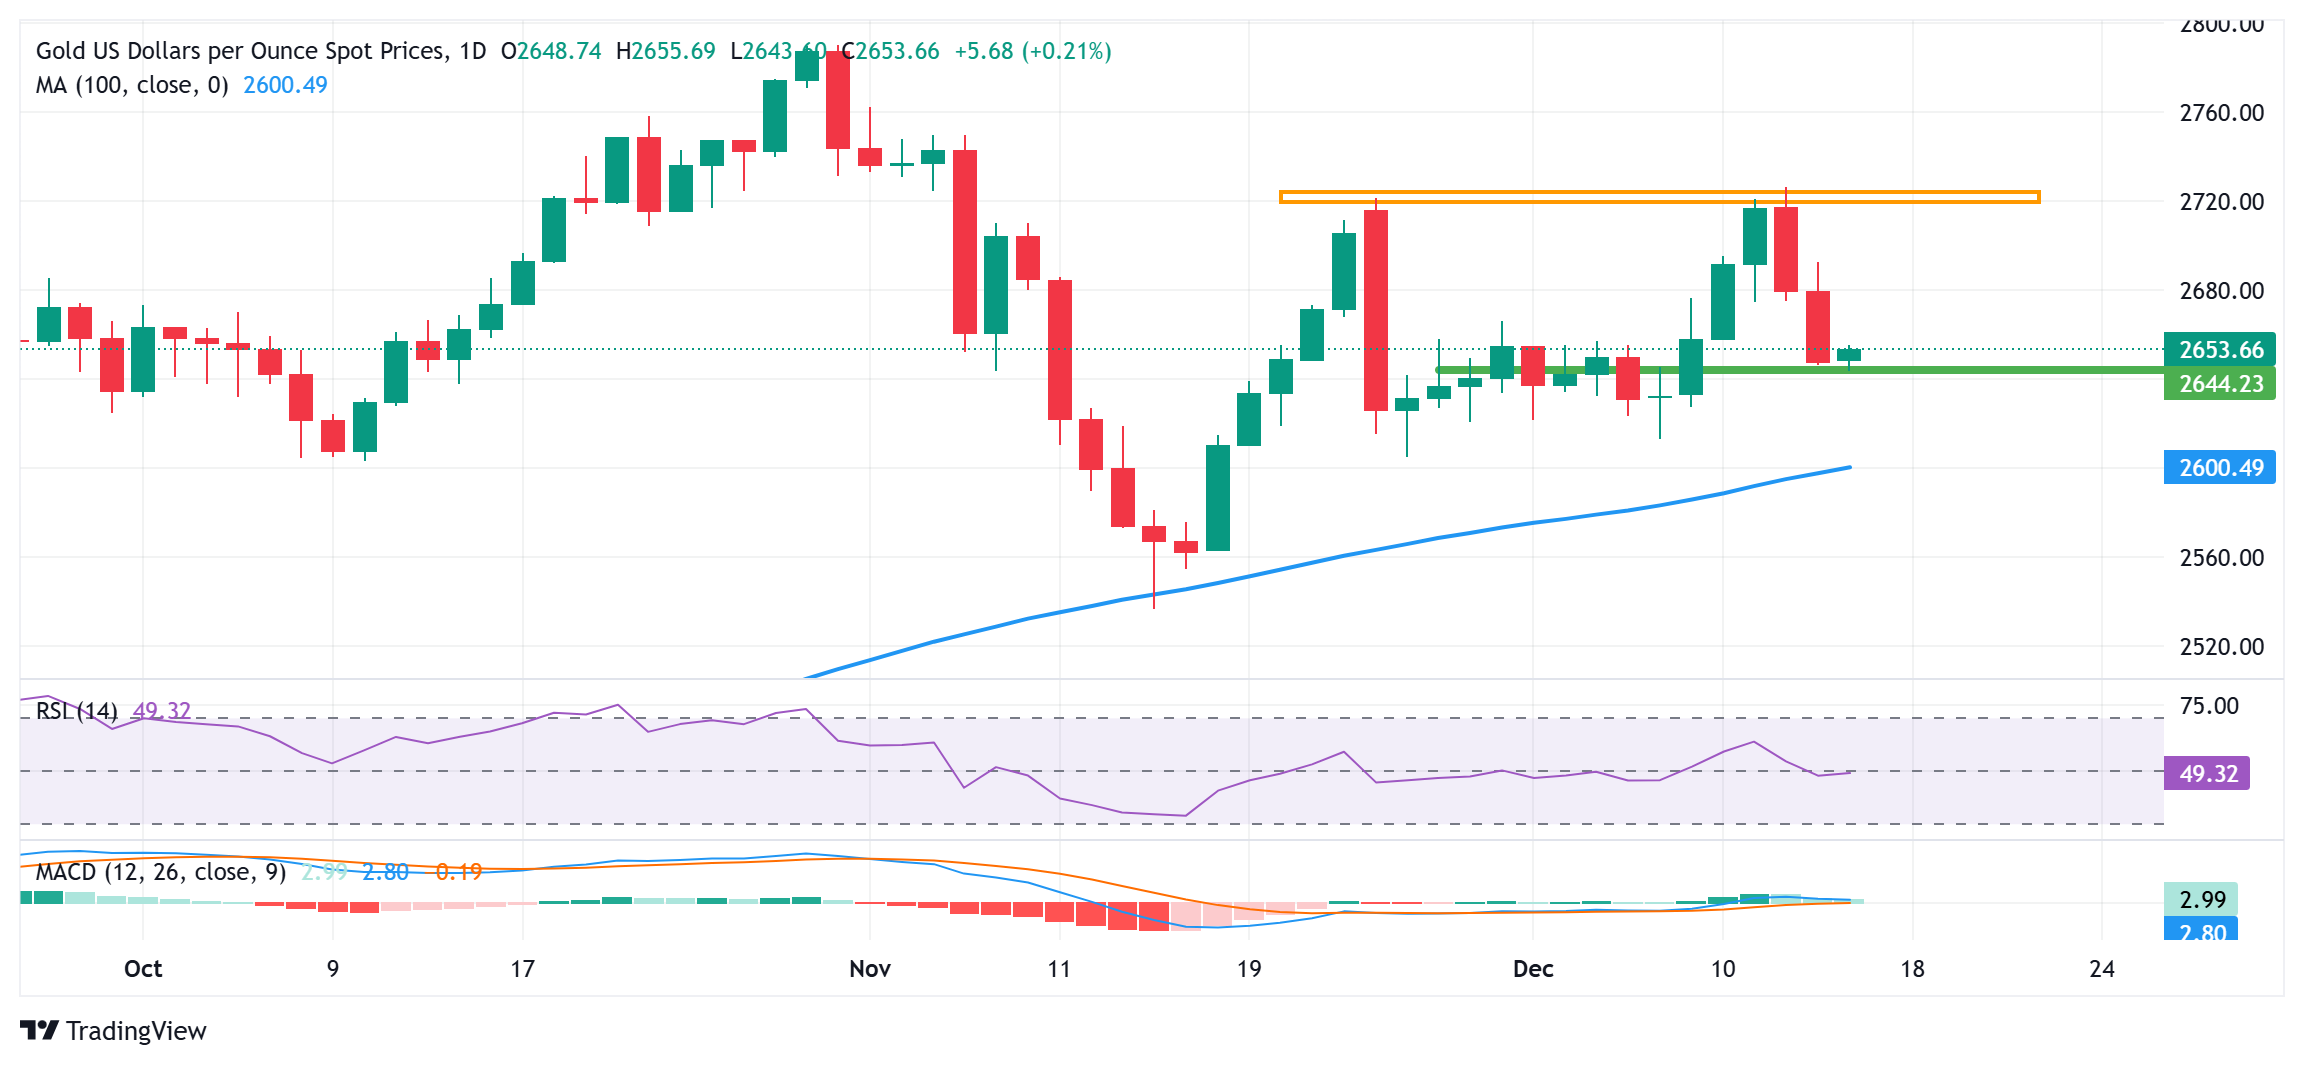
Gold price (XAU/USD) stages a modest recovery from a one-week trough touched earlier this Monday, albeit it lacks follow-through buying and currently trades around the $2,655 region. A modest downtick in the US Treasury bond yields keeps the US Dollar (USD) bulls on the defensive and offers some support to the commodity. Moreover, persistent geopolitical risks and
concerns about US President-elect Donald Trump’s policies remain supportive of a mildly positive tone around the safe-haven precious metal.
That said, growing acceptance that the Federal Reserve (Fed) will slow the pace of its rate-cutting cycle, amid signs that the progress in lowering inflation toward the 2% target has stalled, seems to act as a headwind for the non-yielding Gold price. Traders also seem reluctant and opt to wait on the sidelines ahead of the crucial two-day FOMC monetary policy meeting starting on Tuesday. Nevertheless, the XAU/USD, for now, seems to have stalled its retracement slide from over a one-month high touched last week.
Gold price is likely to attract some sellers at higher levels; the $2,700 mark holds the key
From a technical perspective, the Asian session low, around the $2,644-2,643 area, coincides with a congestion zone. Some follow-through selling has the potential to drag the Gold price to the $2,625 region en route to the monthly low, around the $2,614 zone and the $2,605-2,600 pivotal support. A convincing break below the latter will be seen as a fresh trigger for bearish traders and pave the way for deeper losses.
On the flip side, the $2,665-2,666 region now seems to act as an immediate hurdle ahead of the $2,677 area, above which the Gold price could aim to reclaim the $2,700 round figure. The subsequent move up could extend further towards the monthly swing high, around the $2,726 zone, which if cleared decisively will set the stage for a further near-term appreciating move.
The German manufacturing sector activity worsened in December while the services sector returned to expansion, the preliminary business activity report published by the HCOB survey showed Monday.
The HCOB Manufacturing PMI in the Eurozone’s top economy dropped to 42.5 this month, compared to November’s 43.0 while missing the estimates of 43.8.
Meanwhile, Services PMI rebounded to 51.0 in December from 49.3 in November. The market forecast was 49.2 in the reported period. The gauge set a two-month high.
The HCOB Preliminary German Composite Output Index came in at 47.8 in December vs. 47.2 in November. The index was at its highest in two months.
FX implications
EUR/USD picks up fresh bids despite the mixed German data, currently trading 0.16% higher on the day at 1.0515.
Euro PRICE Today
The table below shows the percentage change of Euro (EUR) against listed major currencies today. Euro was the strongest against the Japanese Yen.
Bitcoin hit a record high above $106,000 on Monday, after recent developments on President-elect Donald Trump’s strategic Bitcoin reserve and demand from institutional traders.
The Bitcoin fear and greed index, a gauge for the sentiment among traders reads 83, on a scale from 0 to 100, signaling “extreme greed” among traders. This is consistent with the sentiment last week and last month.
Analysts remain bullish on BTC, set a $110,000 target for the largest cryptocurrency, while it is in the “blue sky” territory, meaning while the token breaks above its previous all-time high.
Bitcoin’s rally to $106,648 ushers nearly $120 million in liquidations
Bitcoin surged a record high of $106,648 in the early hours of Monday. The rally is largely driven by institutional demand, evident from consistent inflows to Bitcoin ETFs all week. President-elect Donald Trump commented on his strategic Bitcoin reserve and said that the U.S. will do something great with crypto, last week.
Bitcoin’s market capitalization crossed $2.071 trillion and the largest crypto token pulled back slightly to trade at $104,773, at the time of writing.
Most altcoins ranked within the top 100 cryptocurrencies by market capitalization have recovered from their correction over the weekend and observed slight gains on the day.
Coinglass data shows that over $118 million in derivatives positions were liquidated in response to Bitcoin’s new all-time high.
Tony Sycamore, a crypto analyst told Reuters,
We’re in blue sky territory here. The next figure the market will be looking for is $110,000. The pullback that a lot of people were waiting for just didn’t happen, because now we’ve got this news.
Where is Bitcoin headed?
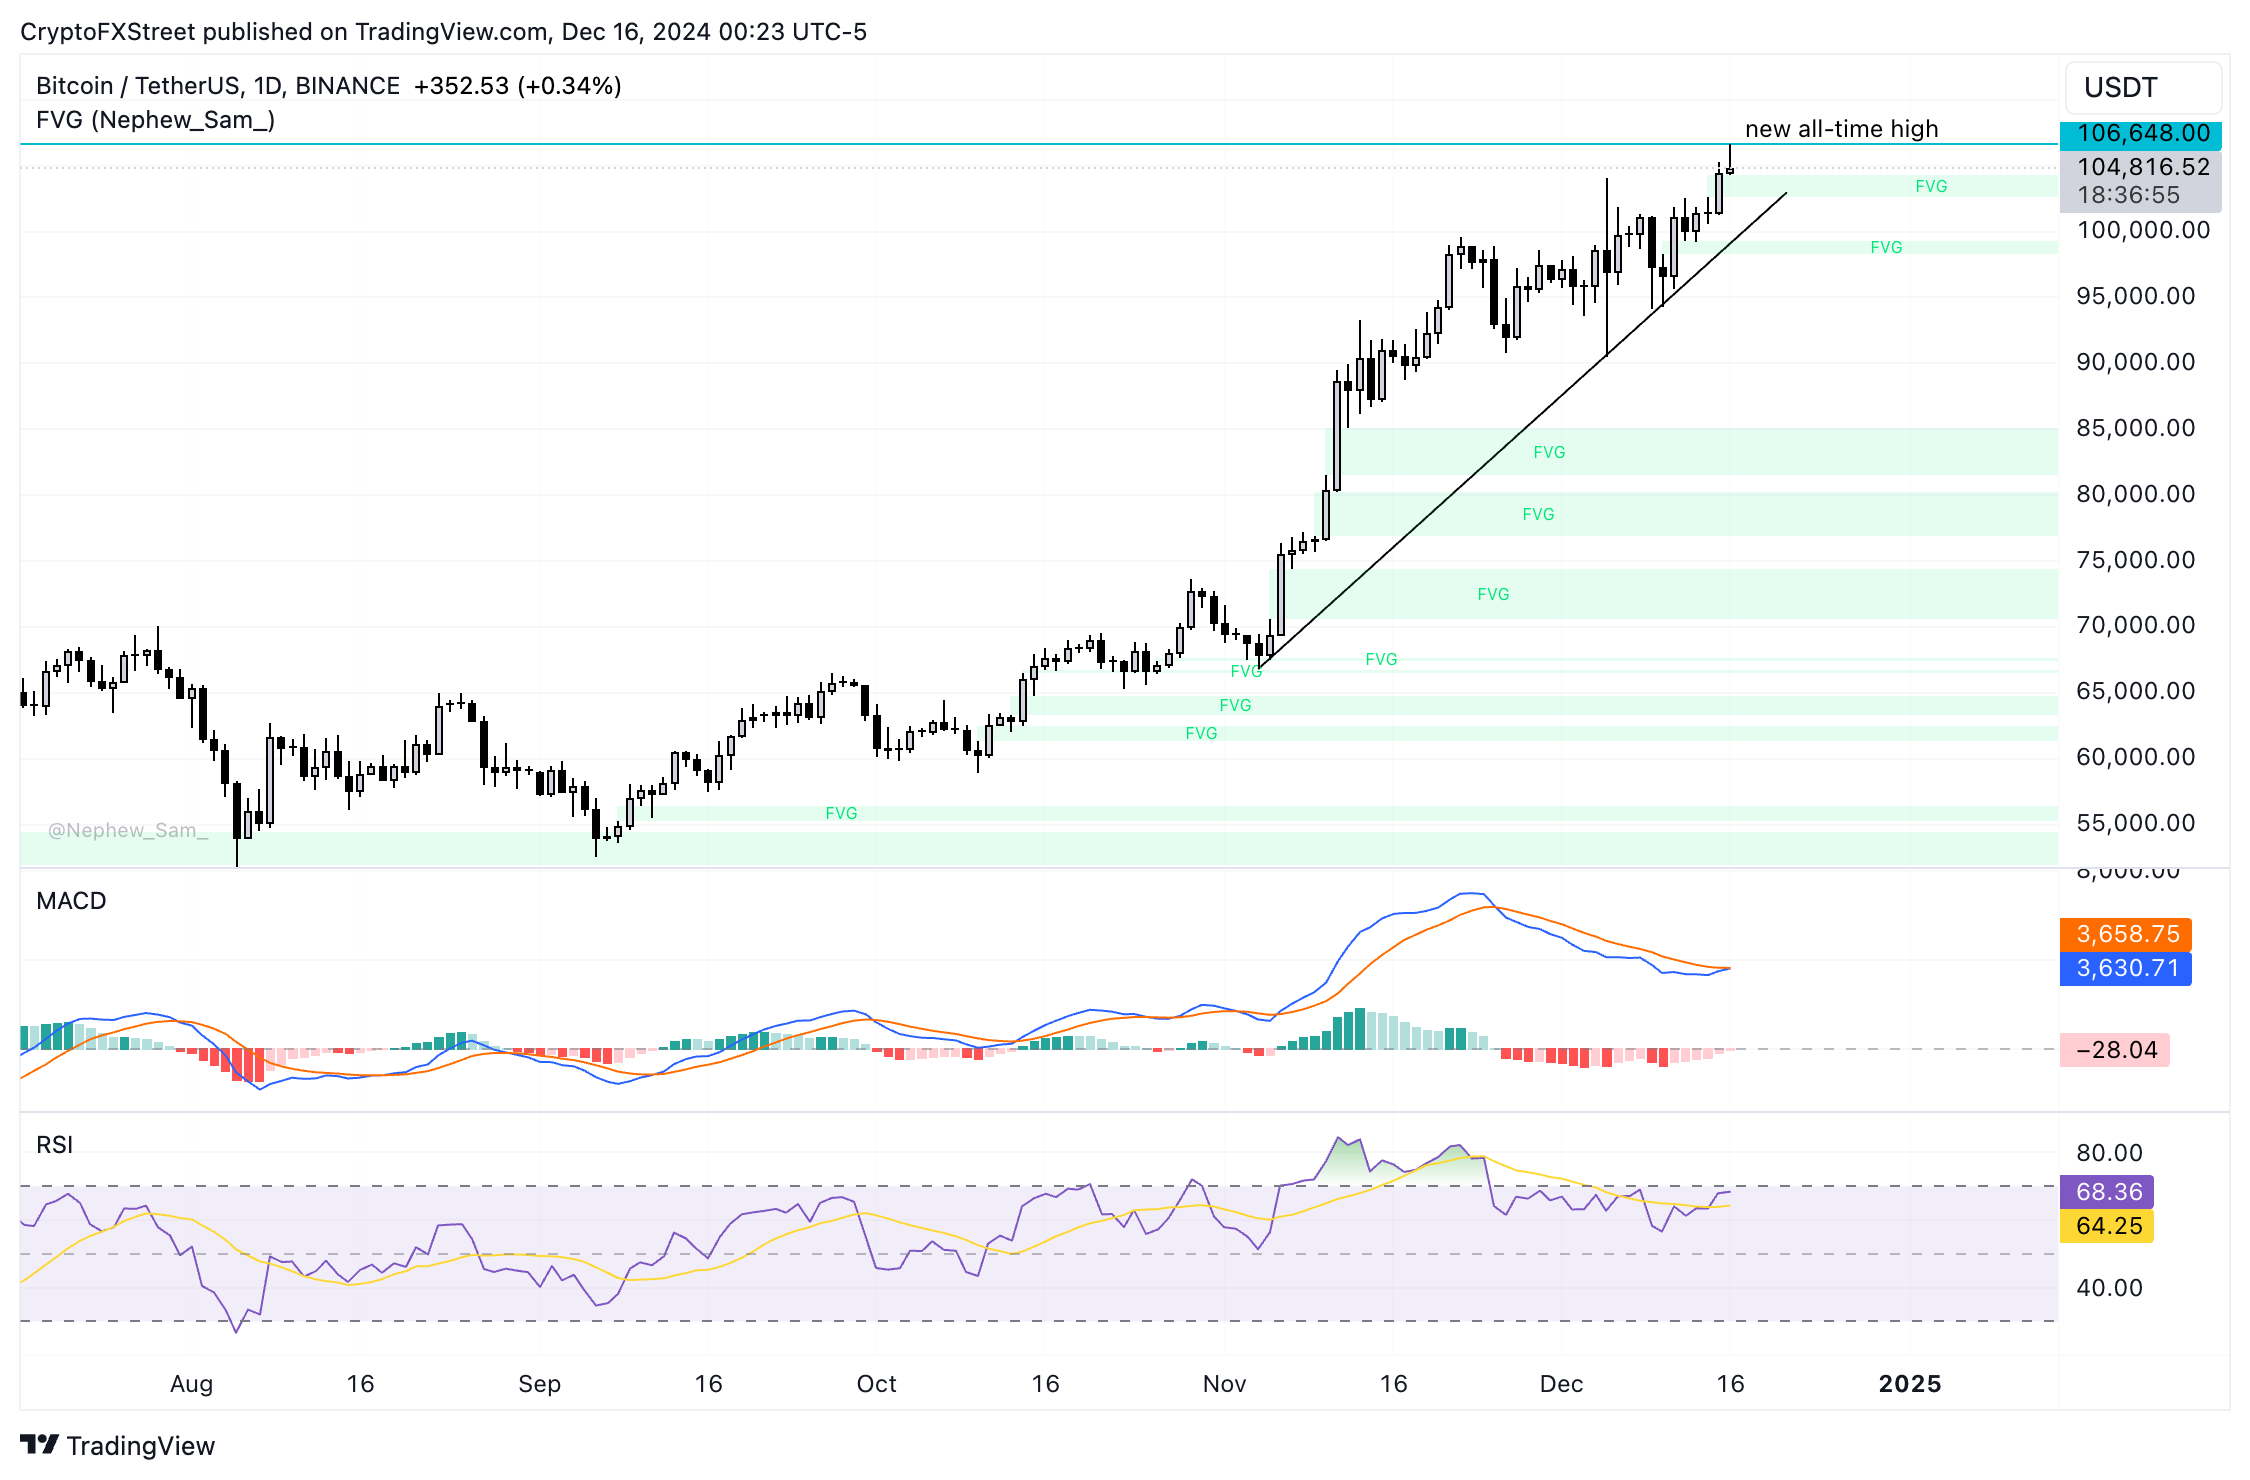
Bitcoin is trading nearly 2% below its new all-time high. The largest cryptocurrency is in an upward trend as seen in the BTC/USDT daily price chart. The Fair Value Gap (FVG) between $102,650 to $104,259 could act as a support zone for Bitcoin if there is further pullback in the asset.
Momentum indicator, Relative Strength Index (RSI) reads 68. RSI is below 70, a break above this would typically generate a sell-signal for Bitcoin. Moving Average Convergence Divergence (MACD) flashes red histogram bars under the neutral line, meaning the underlying momentum in Bitcoin price is negative.
However, traders need to keep their eyes peeled, as this could change. As the MACD line crosses above the signal line, likely on the daily timeframe, it could signal a reversal in momentum.
BTC could enter price discovery above its $106,648 peak and target $131,252, the 161.80% Fibonacci retracement of the rally from the November 4 low of $68,835 to the new-time high on Monday.
BTC/USDT daily price chart
The 78.6% Fibonacci retracement level at $98,128 could act as a support in the event of a pullback.
Ethereum (ETH) is up 1% on Thursday as it aims to tackle the selling pressure near the $4,000 psychological level. On-chain data shows that ETH has begun seeing increased bullish momentum, which could push its price to a new all-time high above $5,000.
Shiba Inu price has rebounded 22% from its 14-day low of $0.00002400 recorded during the crypto market dip on Tuesday. With the Ethereum ecosystem attracting rapid capital inflows, is SHIB on the verge of a major breakout?
Ethereum (ETH) is up 1% on Thursday as it aims to tackle the selling pressure near the $4,000 psychological level. On-chain data shows that ETH has begun seeing increased bullish momentum, which could push its price to a new all-time high above $5,000.
Shiba Inu price has rebounded 22% from its 14-day low of $0.00002400 recorded during the crypto market dip on Tuesday. With the Ethereum ecosystem attracting rapid capital inflows, is SHIB on the verge of a major breakout?
Donald Trump made bullish comments on the crypto sector as he rang the opening bell at the New York Stock Exchange on Thursday. When asked about the proposal to add Bitcoin to a strategic reserve, Trump gave a cryptic response, promising support for the cryptocurrency sector as a whole.
Donald Trump made bullish comments on the crypto sector as he rang the opening bell at the New York Stock Exchange on Thursday. When asked about the proposal to add Bitcoin to a strategic reserve, Trump gave a cryptic response, promising support for the cryptocurrency sector as a whole.











 Chat now!