DXY: Head and shoulders pattern appears to have formed

DXY: Head and shoulders pattern appears to have formed

US Dollar (USD) traded a subdued range overnight in absence of key catalyst. Fedspeaks go into blackout so that puts the focus on data before FOMC next Thursday (19 December). DXY was last at 106.35, OCBC’s FX analysts Frances Cheung and Christopher Wong note.

A bearish setup arises on the charts

“This week, we have CPI on Wednesday and PPI on Thursday. A 25bp cut is more or less a done deal for December meeting unless US CPI unexpectedly surprises a lot to the upside. We would be keen to see the dot plot guidance for 2025. Fed fund futures are implying about 3 cuts for 2025, slightly less than the previous dot plot of 4 cuts that was penciled in for 2025.”

“Daily momentum is mild bearish while RSI is flat. Head and shoulders pattern appears to have formed with DXY testing the neckline (which was respected last Friday). This is typically a bearish setup. A decisive break below neckline should see bears gather momentum.”

“Support at 105 levels (38.2% fibo retracement of Sep low to November high), 104.60 (50 DMA) and 104.10 (200 DMA, 50% fibo). Resistance at 106.70 (second shoulder).”

NZD/USD hangs near two-week low touched on Monday, holds above 0.5800 mark

NZD/USD hangs near two-week low touched on Monday, holds above 0.5800 mark

The NZD/USD pair struggles to capitalize on the previous day’s bounce from the vicinity of the 0.5800 mark or a near two-week low and attracts fresh sellers on Tuesday. Spot prices retain intraday bearish bias through the first half of the European session and currently trade around the 0.5825-0.5820 region, within striking distance of a one-year trough touched in November.

The New Zealand Dollar (NZD) continues to be undermined by expectations for a more aggressive policy easing by the Reserve Bank of New Zealand (RBNZ). Adding to this, disappointing readings on China’s exports and imports added to worries about a fragile recovery in the world’s second-largest economy, which further undermined demand for antipodean currencies, including the Kiwi. This, along with a modest US Dollar (USD) uptick, exerts additional pressure on the NZD/USD pair.

In fact, the USD Index (DXY), which tracks the Greenback against a basket of currencies, looks to build on the post-NFP bounce from a nearly one-month low amid bets that the Federal Reserve (Fed) will adopt a cautious stance on cutting interest rates. Moreover, the worsening Russia-Ukraine war and persistent geopolitical tensions in the Middle East drive some haven flows towards the buck. This, along with concerns about US President-elect Donald Trump’s tariffs, weighs on the NZD/USD pair.

The aforementioned fundamental backdrop suggests that the path of least resistance for spot prices remains to the downside, though traders might await the release of the US consumer inflation figures on Wednesday. The crucial US Consumer Price Index (CPI) report will be looked for cues about the interest rate outlook in the US and guide Fed policymakers on their decision later this month. This, in turn, will influence the USD price dynamics and provide a fresh impetus to the NZD/USD pair.

GBP/JPY rises above 193.00 due to uncertain expectations surrounding BoJ rate hike

GBP/JPY rises above 193.00 due to uncertain expectations surrounding BoJ rate hike

GBP/JPY extends its gains for the second successive session, trading around 193.10 during the European hours on Tuesday. The recent upward movement in the GBP/JPY cross is likely driven by a weaker Japanese Yen (JPY), stemming from mixed expectations regarding a potential Bank of Japan (BoJ) rate hike in December.

BoJ Governor Kazuo Ueda recently indicated that the timing for the next rate hike is nearing, bolstered by strong underlying inflation data in Japan. This has fueled speculation about a possible rate hike during the BoJ’s December 18–19 policy meeting.

However, conflicting media reports suggest the BoJ might forgo a rate hike this month. Adding to the uncertainty, dovish BoJ board member Toyoaki Nakamura has cautioned against premature rate increases, further weighing on the Japanese Yen.

The Pound Sterling (GBP) gains ground against its major peers as investors become increasingly confident that the Bank of England (BoE) will maintain its current interest rates at 4.75% in the monetary policy meeting on December 19.

Most BoE officials are anticipated to vote for an unchanged interest rate, as UK headline inflation has risen again after briefly falling below the bank’s 2% target. The BoE had previously forecasted a rebound in inflation after it temporarily aligned with the desired range.

GBP/USD: A strong surge in momentum

GBP/USD: A strong surge in momentum

Pound Sterling (GBP) is expected to trade in a 1.2710/1.2790 range. In the longer run, there has been a strong surge in momentum; GBP may rise to 1.2850, UOB Group’s FX analysts Quek Ser Leang and Lee Sue Ann note.

GBP may rise to 1.2850

24-HOUR VIEW: “We indicated yesterday that GBP ‘appears to have entered a consolidation and is likely to trade between 1.2705 and 1.2770.’ GBP traded in a wider and higher range than expected (1.2718/1.2799) before closing largely unchanged at 1.2752 (+0.09%). The price action provides no fresh clues, and we expect GBP to trade in a 1.2710/1.2790 range today.”

1-3 WEEKS VIEW: “Last Friday (06 Dec, spot at 1.2760), we indicated ‘there has been a strong surge in momentum,’ and it ‘may rise to 1.2850.’ Aside from a brief rise to 1.2811, GBP has not been able to make much headway on the downside. However, we will continue to hold the same view, provided that 1.2685 (no change in ‘strong support’ from last Friday) is not breached.”

EUR/USD drops back below 1.0550 as markets turn cautious

EUR/USD drops back below 1.0550 as markets turn cautious

EUR/USD returns to the red below 1.0550 in the European session on Tuesday. The pair eases due to fading market’s optimism over likely Chinese stimulus, allowing the US Dollar resume its upside. Increased dovish bets surrounding the ECB also add to the weight on the pair.

EUR/USD Technical Overview

The Relative Strength Index (RSI) indicator on the 4-hour chart moves sideways near 50 early Tuesday, reflecting EUR/USD’s indecisiveness.

On the upside, 1.0600 (Fibonacci 38.2% retracement of the latest downtrend) could be seen as first resistance before 1.0640 (200-period Simple Moving Average (SMA)), 1.0660 (Fibonacci 50% retracement) and 1.0730 (Fibonacci 61.8% retracement).

Looking south, supports are located at 1.0520-1.0530 (100-period SMA, Fibonacci 23.6% retracement), 1.0500 (psychological level, static level) and 1.0440 (static level).

AUD/USD Price Forecast: Bullish reversal move looks likely

AUD/USD Price Forecast: Bullish reversal move looks likely

The AUD/USD pair finds temporary support and advances to near 0.6420 in Monday’s European session after posting a fresh four-month low near 0.6370 on Friday. The Aussie pair rebounds slightly with investors focusing on the Reserve Bank of Australia’s (RBA) monetary policy decision, which will be announced on Tuesday.

Market experts expect the RBA to leave interest rates unchanged at 4.35% but would temper its hawkish tone as the Australian Q3 Gross Domestic Product (GDP) growth came in weaker-than-expected, a scenario that would be favorable for the Australian Dollar (AUD).

Analysts at ANZ and Westpac expect the RBA to start reducing interest rates from May 2025. They have pushed their forecasts from March 2025 amid concerns over sticky price pressures.

Meanwhile, the US Dollar (USD) ticks higher even though traders are confident that the Federal Reserve (Fed) will cut interest rates by 25 basis points (bps) to 4.25%-4.50% in the policy meeting on December 18. This week, investors will pay close attention to the United States (US) Consumer Price Index (CPI) data for November, which will release on Wednesday.

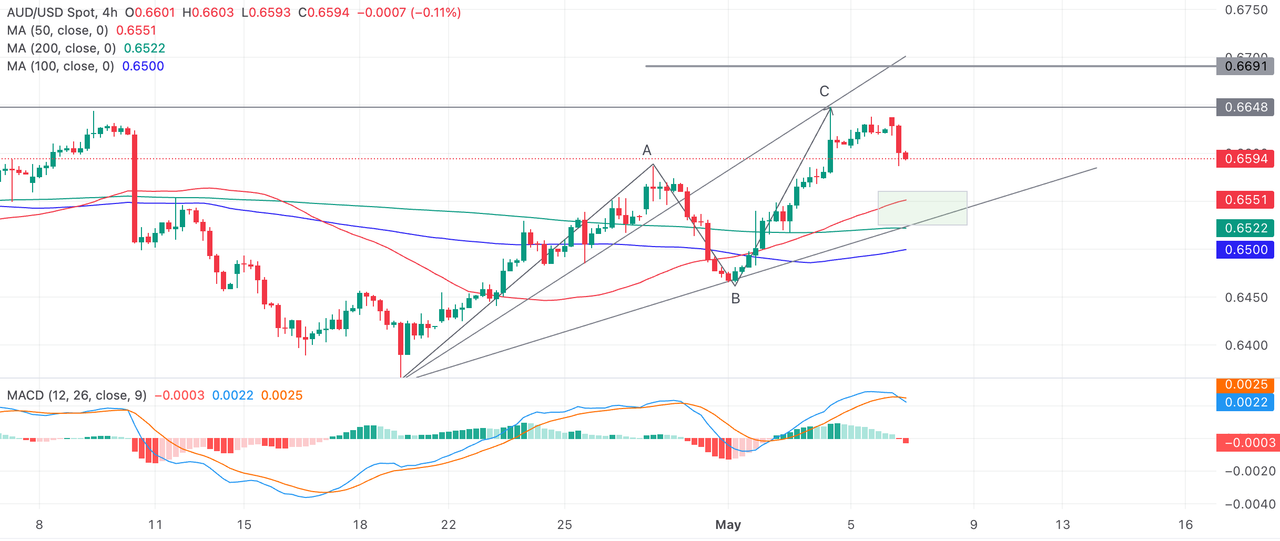
The near-term trend of the AUD/USD pair is bearish as all short-to-long-term Exponential Moving Averages (EMAs) are declining.

The 14-day Relative Strength Index (RSI) wobbles below 40.00, suggesting that a bearish momentum is intact.

More downside towards the August low of 0.6348 and the round-level support of 0.6300 would appear if the Aussie pair fails to hold recovery above the round-level support 0.6400.

On the flip side, a decisive recovery above the November 25 high of 0.6550 will drive the asset towards the round-level resistance of 0.6600, followed by September 11 low of 0.6622.

AUD/USD daily chart

China’s President Xi: We must be fully prepared to achieve next year’s economic targets

China’s President Xi: We must be fully prepared to achieve next year’s economic targets

China’s President Xi Jinping said on Monday, “we must be fully prepared to achieve next year’s economic targets.”

Additional comments

We must affirm the confidence to win while doing next year’s economic work.

Must maintain strategic focus and actively create an external environment that is favourable.

Current development faces many uncertainties and challenges, must be given high attention.

Market reaction

AUD/USD has caught a fresh bid wave on China’s stimulus optimism, rising 0.60% on the day to trade near 0.6430. The pair hit the lowest level in four months at 0.6373 on Friday.

Australian Dollar PRICE Today

The table below shows the percentage change of Australian Dollar (AUD) against listed major currencies today. Australian Dollar was the strongest against the Japanese Yen.

USD EUR GBP JPY CAD AUD NZD CHF
USD 0.10% -0.14% 0.36% 0.00% -0.62% -0.05% 0.13%
EUR -0.10% -0.22% 0.38% -0.00% -0.62% -0.06% 0.11%
GBP 0.14% 0.22% 0.44% 0.22% -0.40% 0.17% 0.34%
JPY -0.36% -0.38% -0.44% -0.39% -0.90% -0.54% -0.16%
CAD -0.01% 0.00% -0.22% 0.39% -0.58% -0.06% 0.12%
AUD 0.62% 0.62% 0.40% 0.90% 0.58% 0.56% 0.74%
NZD 0.05% 0.06% -0.17% 0.54% 0.06% -0.56% 0.16%
CHF -0.13% -0.11% -0.34% 0.16% -0.12% -0.74% -0.16%
Gold extends recovery on geopolitical concerns and China’s purchases

Gold extends recovery on geopolitical concerns and China’s purchases

Gold price (XAU/USD) sticks to its positive bias through the first half of the European session, though it remains below the $2,650-2,655 supply zone and remains confined in a familiar range held over the past two weeks or so. The US Nonfarm Payrolls (NFP) report released on Friday reaffirmed bets that the Federal Reserve (Fed) will lower borrowing costs in December. This, in turn, keeps the US Treasury bond yields depressed and turns out to be a key factor acting as a tailwind for the non-yielding yellow metal.

Apart from this, political disruption in South Korea, geopolitical tensions and trade war fears offer some support to the safe-haven Gold price. However, a modest US Dollar (USD) strength, bolstered by bets that the Fed will adopt a less dovish stance on the back of speculations that US President-elect Donald Trump’s policies will boost inflation, caps gains for the XAU/USD. Traders also seem reluctant and might opt to wait on the sidelines ahead of the release of the US consumer inflation figures, due later this week.

Gold price bulls await breakout above short-term trading range hurdle near $2,650-2,655 area

From a technical perspective, any further strength above the $2,648-2,650 supply zone is likely to confront some resistance near the $2,666 region. Some follow-through buying beyond the $2,672 hurdle will be seen as a key trigger for bulls and allow the Gold price to aim to reclaim the $2,700 round figure. The momentum could extend further towards the next relevant hurdle near the $2,722 area.

On the flip side, weakness below the $2,630 immediate support could drag the Gold price back towards the $2,614-2,613 area. This is followed by the $2,605-2,600 support zone and the 100-day Simple Moving Average (SMA), around the $2,586-2,585 region. A convincing break below the latter should pave the way for deeper losses and expose the November swing low, around the $2,537-2,536 area.

EUR/USD recovers above 1.0550 on renewed US Dollar weakness

EUR/USD recovers above 1.0550 on renewed US Dollar weakness

EUR/USD rebounds above 1.0550 in the European trading hours on Monday. A positive shift in risk sentiment curbs the safe-haven demand for the US Dollar finds fresh haven, offering some comfort to the pair. amid a data-light calendar.

The Relative Strength Index (RSI) indicator on the 4-hour chart stays slightly above 50 and EUR/USD holds steady above the 100-period Simple Moving Average (SMA), reflecting sellers’ hesitancy.

On the upside, first resistance is located at 1.0600 (Fibonacci 38.2% retracement of the latest downtrend) ahead of 1.0650-1.0660 (200-period Simple Moving Average (SMA), Fibonacci 50% retracement) and 1.0730 (Fibonacci 61.8% retracement) and 1.0700 (round level).

Looking south, supports could be spotted at 1.0520-1.0530 (100-period SMA, 50-period SMA, 20-period SMA, Fibonacci 23.6% retracement), 1.0500 (psychological level, static level) and 1.0440 (static level).

EUR/USD touched its highest level since mid-November above 1.0600 on Friday but lost its traction to end the week virtually unchanged. The pair holds steady at around 1.0550 in the European morning on Friday.

The upbeat labor market data for November helped the US Dollar (USD) stay resilient against its rivals heading into the weekend and made it difficult for EUR/USD to hold its ground.

The US Bureau of Labor Statistics (BLS) announced on Friday that Nonfarm Payrolls (NFP) in the US rose by 227,000 in November. This reading followed the 36,000 increase reported in October (revised from 12,000) and surpassed the market expectation of 200,000. On a negative note, the Unemployment Rate edged higher to 4.2% from 4.1% in the same period. Finally, the annual wage inflation, as measured by the change in the Average Hourly Earnings, held steady at 4%, coming in above analysts’ estimate of 3.9%.

The economic calendar will not offer any high-impact data releases that could influence EUR/USD’s action on Monday. Later in the week, November Consumer Price Index (CPI) data from the US could trigger a big reaction in the pair. On Thursday, the European Central Bank (ECB) will announce its policy decisions after the last meeting of the year.

Gold extends recovery on geopolitical concerns and China’s purchases

Gold price stands firm near daily top, around $2,640 area ahead of US NFP report

Gold price (XAU/USD) struggles to capitalize on its goodish intraday bounce from a one-and-half-week low touched earlier this Friday, though it manages to stick to modest gains through the first half of the European session. The US Treasury bond yields remain suppressed amid bets that the Federal Reserve (Fed) will lower borrowing costs in December. This, in turn, keeps the US Dollar (USD) near a multi-week low and acts as a tailwind for the non-yielding yellow metal.

Apart from this, a slight deterioration in the global risk sentiment, geopolitical tensions and trade war fears turn out to be other factors underpinning the safe-haven Gold price. That said, expectations for a less dovish Fed, bolstered by hopes that US President-elect Donald Trump’s policies will boost inflation, keep a lid on any further gains for the XAU/USD. Traders also seem reluctant to place aggressive directional bets ahead of the release of the US Nonfarm Payrolls (NFP) report.

Gold price short-term technical setup seems tilted in favor of bears

fxsoriginal

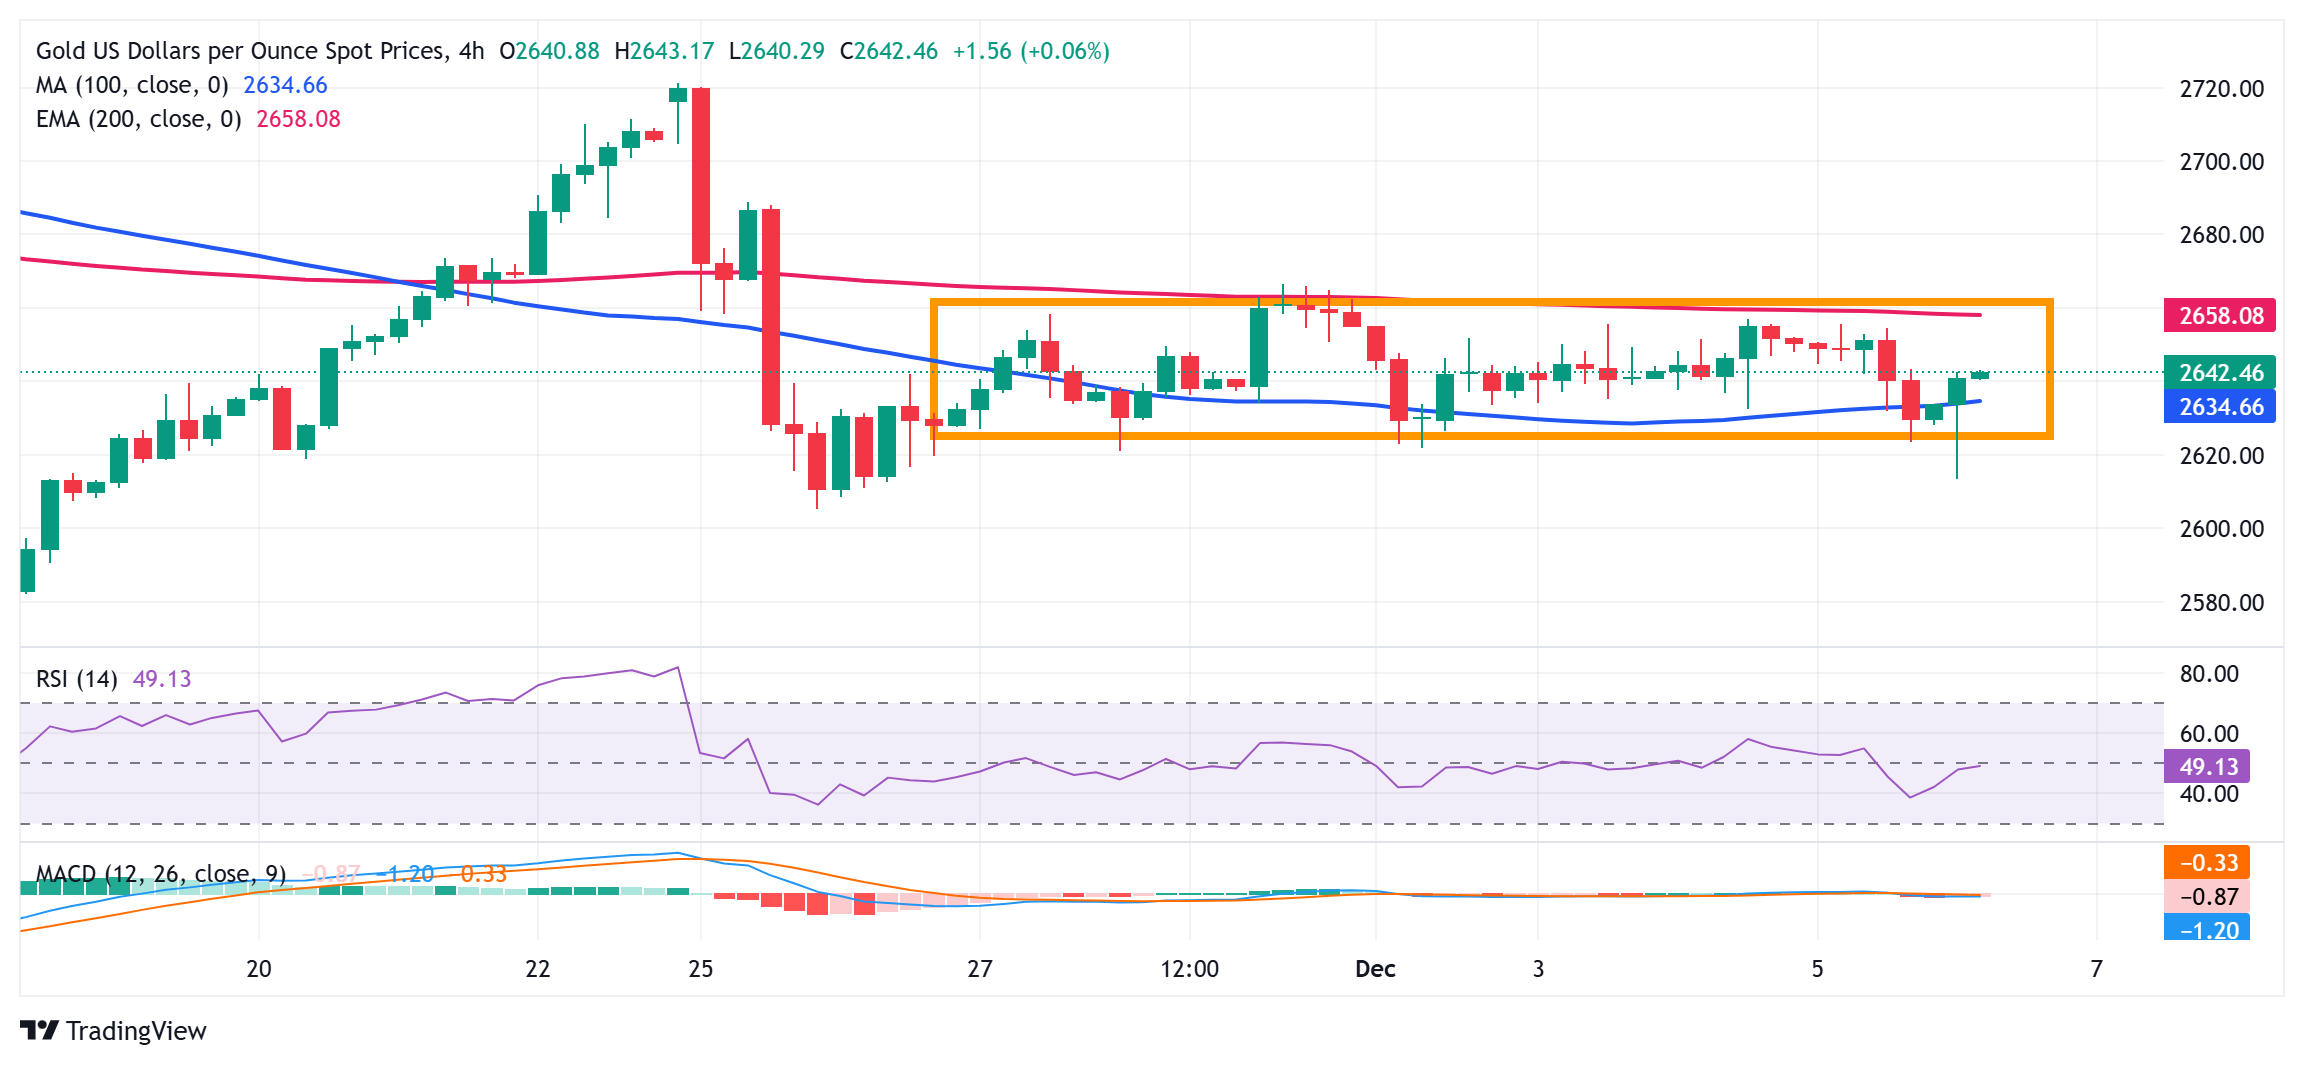
From a technical perspective, an intraday breakdown below the 100-period Simple Moving Average (SMA) on the 4-hour chart and a short-term trading range support near the $2,633-2,632 area was seen as a key trigger for bearish traders. The subsequent swift recovery, however, warrants some caution before positioning for any further losses. Meanwhile, any further move up is likely to confront some resistance near the $2,649 region ahead of the $2,655 supply zone. Some follow-through buying beyond last Friday’s swing high, around the $2,666 area will shift the bias in favor of bulls and allow the Gold price to reclaim the $2,700 mark.

On the flip side, the Asian session low, around the $2,614-2,613 region, now seems to act as immediate strong support ahead of the $2,605-2,600 area. This is followed by the 100-day SMA, currently around the $2,583 zone, below which the Gold price could slide to the November monthly swing low, around the $2,537-2,536 area. The downward trajectory could extend further and eventually drag the XAU/USD to the $2,500 psychological mark.