USD/CAD Price Analysis: Ascending Triangle breakout keep upside trend afloat

USD/CAD Price Analysis: Ascending Triangle breakout keep upside trend afloat

The USD/CAD pair extends its winning streak for the third trading day on Wednesday. The Loonie pair moves higher to near 1.4075 as the US Dollar (USD) gains ahead of United States (US) economic data for November, including ADP Employment Change and ISM Services PMI, and Federal Reserve (Fed) Chair Jerome Powell’s speech in the North American session.

The US Dollar Index (DXY), which tracks the Greenback’s value against six major currencies, climbs around 106.60.

Investors will pay close attention to the Jerome Powell’s speech at at the New York Times DealBook Summit to get fresh cues about whether the central bank will cut interest rates again in its policy meeting on December 18. According to the CME FedWatch tool, there is a 74% chance that the Fed will reduce its key borrowing rates by 25 basis points (bps) to 4.25%-4.50%, while the rest favors leaving them unchanged at their current levels.

This week, the Canadian Dollar (CAD) will be influenced by the labor market data for November, which will be released on Friday, along with US Nonfarm Payrolls (NFP).

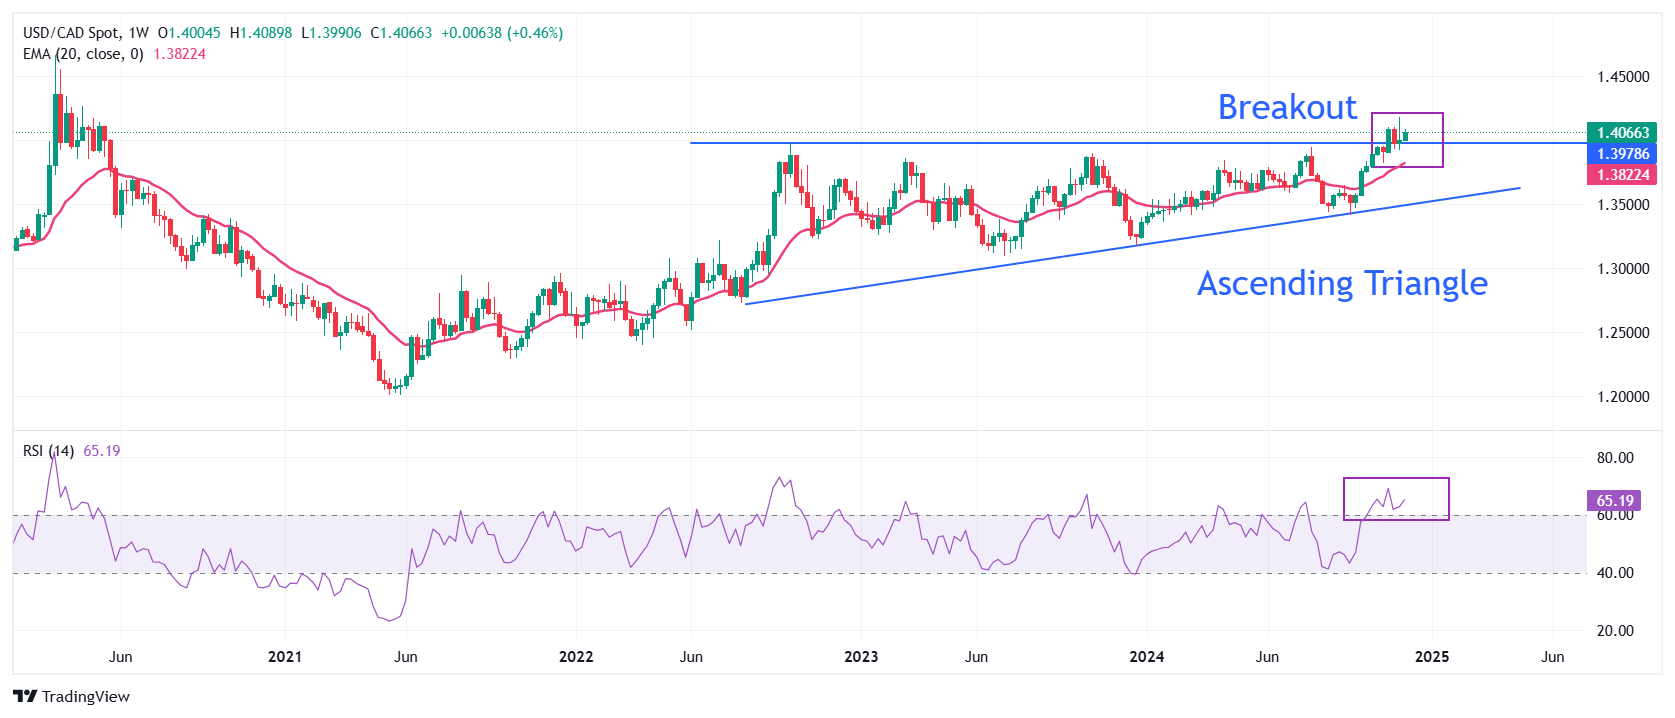
USD/CAD holds the breakout of the Ascending Triangle chart pattern formed on a weekly timeframe. The outlook of the Loonie pair remains firm as the 20-day Exponential Moving Average (EMA) near 1.3820 is sloping higher.

The 14-week Relative Strength Index (RSI) oscillates above 60.00, suggesting a strong bullish momentum.

A fresh upside would appear if the asset breaks above November’s high of 1.4178. The scenario will pave the way for the April 2020 high of 1.4265 and the round-level resistance of 1.4300.

On the contrary, a downside move below the October 29 low of 1.3875 will expose the asset to the October 15 high near 1.3840, followed by the round-level figure of 1.3800.

USD/CAD weekly chart
USD/JPY: Must break and close below 148.65 to continue to declining

USD/JPY: Must break and close below 148.65 to continue to declining

To continue to decline, the US Dollar (USD) must break and close below 148.65, which is acting as a significant support level now, UOB Group’s FX analysts Quek Ser Leang and Lee Sue Ann note.

The next significant support level below 148.65 is at 146.95

24-HOUR VIEW: “USD plummeted to 149.06 on Monday before rebounding. Yesterday, we pointed out that ‘despite the sharp decline, downward momentum has not increased much.’ We expected USD to ‘trade in a range between 149.00 and 150.50.’ Our view was incorrect, as USD plummeted briefly to 148.63, rebounding sharply to close unchanged at 149.59. The brief drop did not result in any increase in momentum, and we continue to expect USD to trade in a range, probably between 148.80 and 150.30.”

1-3 WEEKS VIEW: “We shifted our outlook to negative late last week. Tracking the subsequent decline, we indicated yesterday (03 Dec, spot at 149.85) that USD ‘may continue to decline, but given that downward momentum has not increased much further, it is unclear if there is enough momentum for it to reach 148.65.’ USD subsequently dropped briefly to 148.63, rebounding to close unchanged at 149.59. There is still no clear increase in momentum, and for USD to continue to decline, it must break and close below 148.65, which is acting as a significant support level now. On the upside, should USD break above 150.80 (‘strong resistance’ level previously at 151.30), it would indicate that the weakness in USD has stabilised. Looking ahead, the next significant support level below 148.65 is at 146.95.”

EUR/USD stays defensive near 1.0500 amid French political jitters

EUR/USD stays defensive near 1.0500 amid French political jitters

EUR/USD is battling 1.0500 in the European session on Wednesday. The pair trades with caution amid renewed US Dollar buying and French political uncertainty as the government faces a no-confidence vote in a busy day ahead. US data, Lagarde and Powell eyed.

The Relative Strength Index (RSI) indicator on the 4-hour chart stays slightly below 50, reflecting a lack of recovery momentum.

EUR/USD faces immediate resistance at 1.0520-1.0530, where the Fibonacci 23.6% retracement of the latest downtrend and the 100-period Simple Moving Average (SMA) are located. In case the pair rises above this area and starts using it as support, technical buyers could take action. In this scenario, 1.0600 (Fibonacci 38.2% retracement) could be seen as next resistance before 1.0660-1.0670 (Fibonacci 50% retracement, 200-period SMA).

Looking south, supports could be spotted at 1.0440 (static level) and 1.0400 (end-point of the downtrend, static level).

EUR/USD found its footing following Monday’s drop but struggled to gather recovery momentum on Tuesday. The pair trades in a tight channel above 1.0500 in the European morning on Wednesday as the market focus shifts to US data releases and speeches by European Central Bank (ECB) President Christine Lagarde and Federal Reserve (Fed) Chairman Jerome Powell.

The cautious market mood and the better-than-expected JOLTS Job Openings data for October from the US helped the US Dollar (USD) stabilize in the second half of the day on Tuesday and capped the EUR/USD’s upside.

ECB President Lagarde will testify before the Committee on Economic and Monetary Affairs of the European Parliament in Brussels, starting at 13:30 GMT. ECB policymakers have been voicing their supports for another rate cut in December, citing growing concerns over the economic outlook. In case Lagarde adopts a similar tone, EUR/USD could have a difficult time stretching higher.

In the American session, ADP Employment Change and ISM Services PMI data for November will be watched closely by market participants. Investors expect the private sector employment to increase by 150,000. A positive surprise in this data, with a reading at or above 200,000, could help the USD gather strength and drag EUR/USD lower.

Later in the day, Fed Chairman Powell will participate in a moderated discussion at the New York Times DealBook Summit, starting at 18:45 GMT. According to the CME FedWatch Tool, markets currently see a nearly 75% probability of a 25 basis points (bps) rate cut in December. In case Powell voices his willingness to ease policy further at the last meeting of the year, the market positioning suggests that there is room for further USD weakness.


Euro recovers above 1.0500 against US Dollar after plunging due to French political turmoil

Euro recovers above 1.0500 against US Dollar after plunging due to French political turmoil

The Euro recovers firmly above 1.0500 against the US Dollar on Tuesday after losing 0.78% on Monday due to doubts over the stability of the French government. French Prime Minister Michel Barnier used a special decree to pass his social budget reform by circumventing the French parliament, a move that set off bad blood with the opposition parties, which were very quick to support a vote of no confidence that could be held as early as Wednesday.

Meanwhile in the US, Federal Reserve Governor Christopher Waller said that he is keen for a December interest-rate cut. This has pushed up the odds for that rate cut to take place, narrowing the rate differential between European and US bond yields. Some further easing from the US Dollar should materialize on the back of this, giving further impulse to the EUR/USD pair ahead of the US JOLTS Job Openings report to be published in Tuesday’s American session.

Technical Analysis: EUR/USD to put up a fight 

EUR/USD has a long road to recover after its stellar correction in November. With policies from US President-elect Donald Trump being priced in, a lot could be priced out once it turns out that bold statements were a bargaining chip to get some deal or consensus done.

Major banks are already calling for parity, but it would not come as a surprise that parity does not materialize. There is the possibility that the EUR/USD pair reverts back to 1.0600 and 1.0800 in the coming weeks as traders unwind positions ahead of the Christmas season and the end of the year.

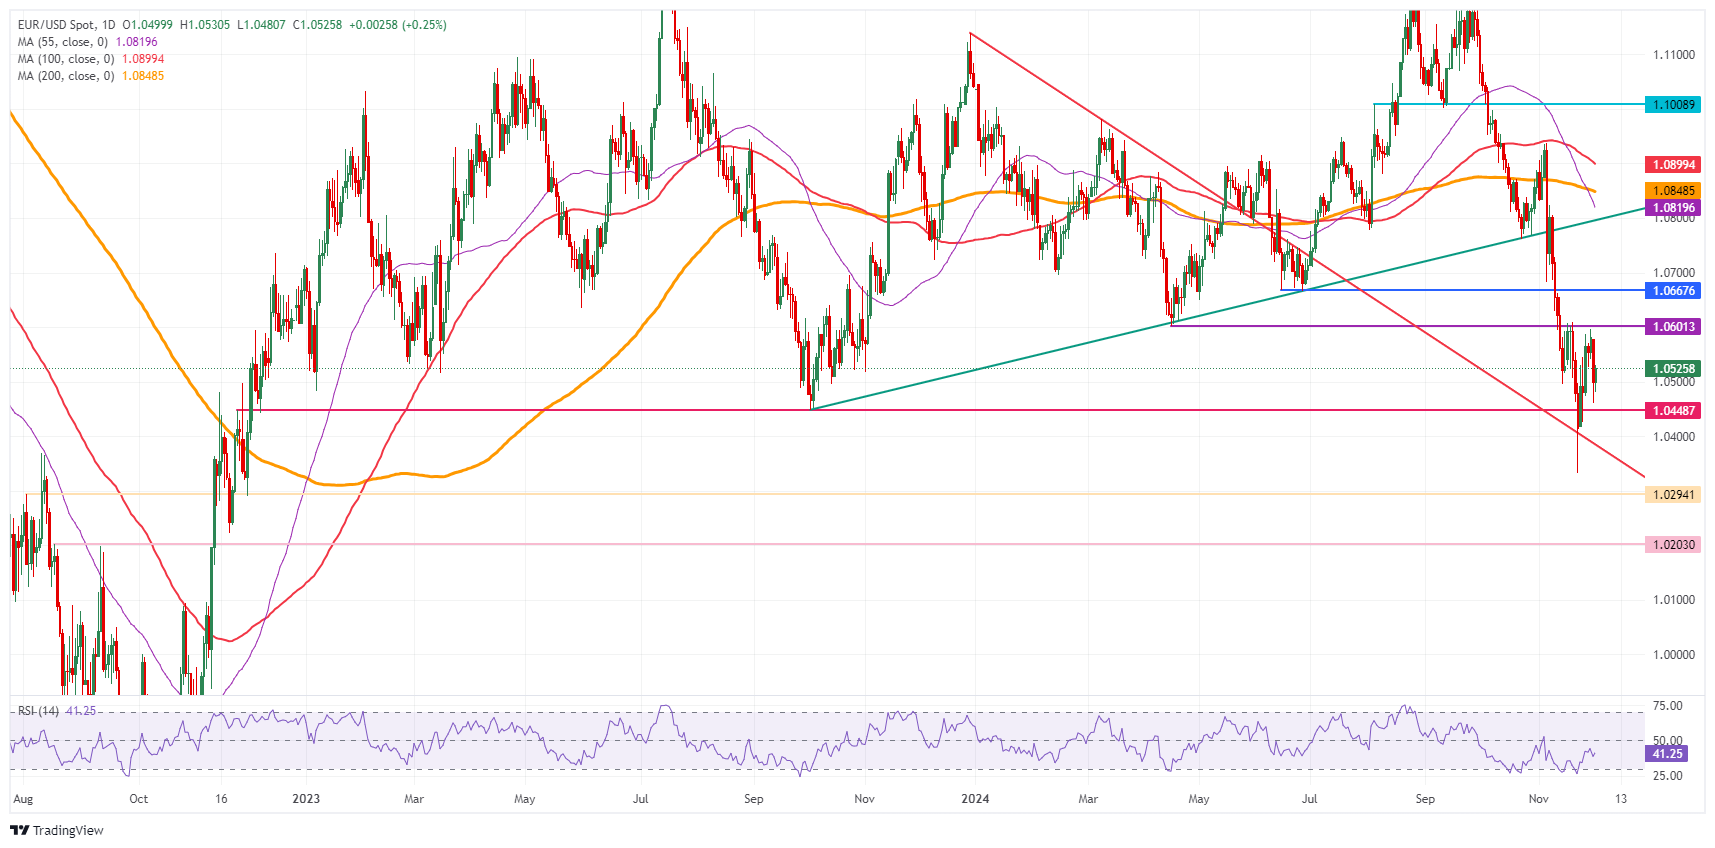
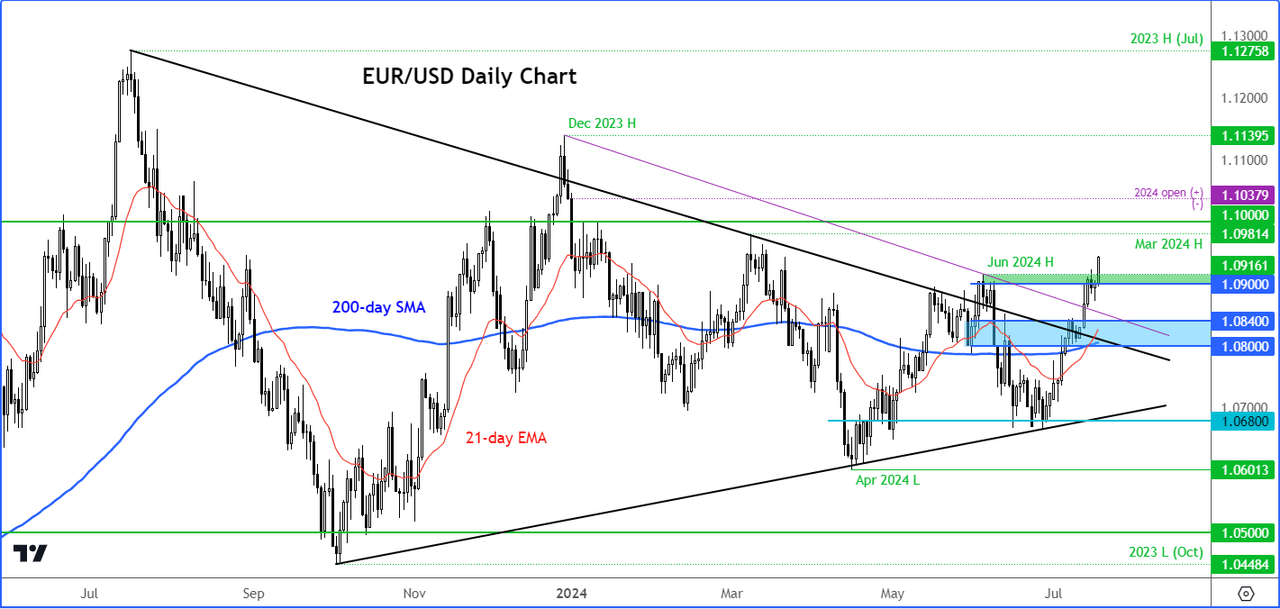
On the upside, three firm lines of resistance can be seen. The first is the previous 2024 low at 1.0601 registered on April 16. If that level breaks, the triple bottom from June at 1.0667 will be the next cap upwards. Further up, the 1.0800 round level, which roughly coincides with the green ascending trend line from the low of October 3, 2023, could deliver a harsh rejection.

Looking for support, the 2023 low at 1.0448 is the next technical candidate. The current two-year low at 1.0332 is the second level to look out for. Further down, 1.0294 and 1.0203 are the next levels to consider.

EUR/USD: Daily Chart

EUR/USD: Daily Chart

China announces export ban of gallium, germanium, antimony to US

China announces export ban of gallium, germanium, antimony to US

China’s Commerce Ministry announced on Tuesday that they will ban exports of dual-use items related to gallium, germanium, antimony and superhard materials to the United States (US) with immediate effect.

This comes a day after the latest crackdown on China’s chip sector by US President Joe Biden’s administration.

Market reaction

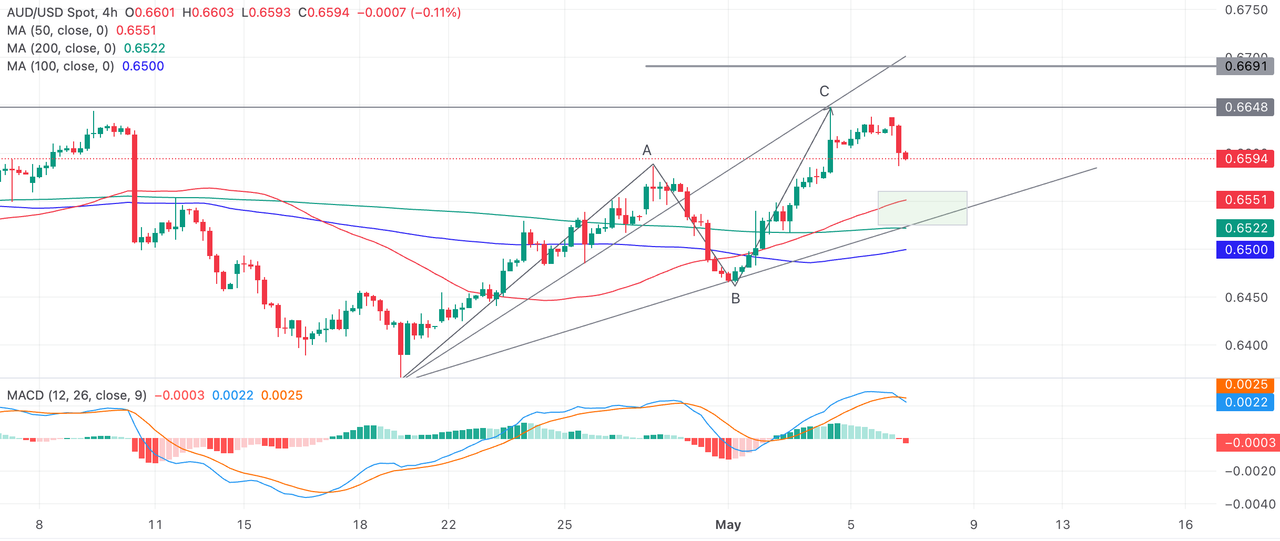
Mounting US-Sino trade tensions seem to have little to no impact on the Chinese proxy Australian Dollar, as of writing. AUD/USD is up 0.37% on the day, testing 0.6500 on renewed US Dollar weakness.

USD/CAD Price Analysis: Ascending Triangle breakout keep upside trend afloat

EUR/USD recovers above 1.0500 ahead of US data

EUR/USD recovers ground above 1.0500 in the European session on Tuesday. The pair draws support from an improved risk sentiment, which acts as a headwind for the US Dollar rebound. The upside, however, appears capped due to French political instability. US jobs data is eagerly awaited.

EUR/USD dropped below 1.0520, where the Fibonacci 23.6% retracement of the latest downtrend is located. While this level holds as resistance, technical sellers could remain interested. On the downside, supports could be seen at 1.0440 (static level) and 1.0400 (end-point of the downtrend, static level).

In case EUR/USD rises above 1.0520, next hurdle is located at 1.0545 (100-period Simple Moving Average (SMA) on the 4-hour chart) ahead of 1.0600 (Fibonacci 38.2% retracement).

EUR/USD started the week on a bearish noted and dropped below 1.0500 on Monday. The pair holds its ground early Tuesday but shows no signs of a steady recovery.

The risk-averse market atmosphere helped the US Dollar (USD) gather strength against its rivals and weighed on EUR/USD on Monday. Additionally, political woes in France further weighed on the Euro. “The French government is all but certain to collapse later this week after far-right and left-wing parties submitted no-confidence motions on Monday against Prime Minister Michel Barnier,” Reuters reported.

Meanwhile, the potential monetary policy divergence between the Federal Reserve (Fed) and the European Central Bank (ECB) doesn’t allow the pair to gain traction.

Atlanta Fed President Bostic said late Monday that he is undecided on whether a rate cut is needed in December. On a similar note, “one could argue a case for skipping a rate cut in December, will be watching data closely to decide,” NY Fed President John Williams noted. On the flip side, ECB policymaker Martins Kazaks argued that the inflation problem will soon end and added that rate cuts must continue.

In the second half of the day, the US Bureau of Labor Statistics will publish JOLTS Job Openings data for October. A significant negative surprise, with a reading at or below 7 million, could hurt the USD with the immediate reaction and help EUR/USD edge higher.

Japanese Yen pares intraday losses; USD/JPY trades with modest gains around 150.00 mark

Japanese Yen pares intraday losses; USD/JPY trades with modest gains around 150.00 mark

The Japanese Yen (JPY) trims a part of heavy intraday losses against its American counterpart amid bets that the Bank of Japan (BoJ) will hike interest rates again in December. Apart from this, a softer risk tone and persistent geopolitical tensions turn out to be another factor offering some support to the safe-haven JPY. That said, rebounding US Treasury bond yields, bolstered by expectations for a less dovish Federal Reserve (Fed), should cap the upside for the lower-yielding yellow metal.

Investors seem convinced that US President-elect Donald Trump’s tariff plans could boost inflation and limit the scope for the Fed to cut interest rates. This, in turn, triggers a goodish move up in the US bond yields, which helps revive the US Dollar (USD) demand and assists the USD/JPY pair to defend the 150.00 psychological mark through the early European session. Traders now look forward to the US ISM Manufacturing PMI for short-term opportunities at the start of a critical week.

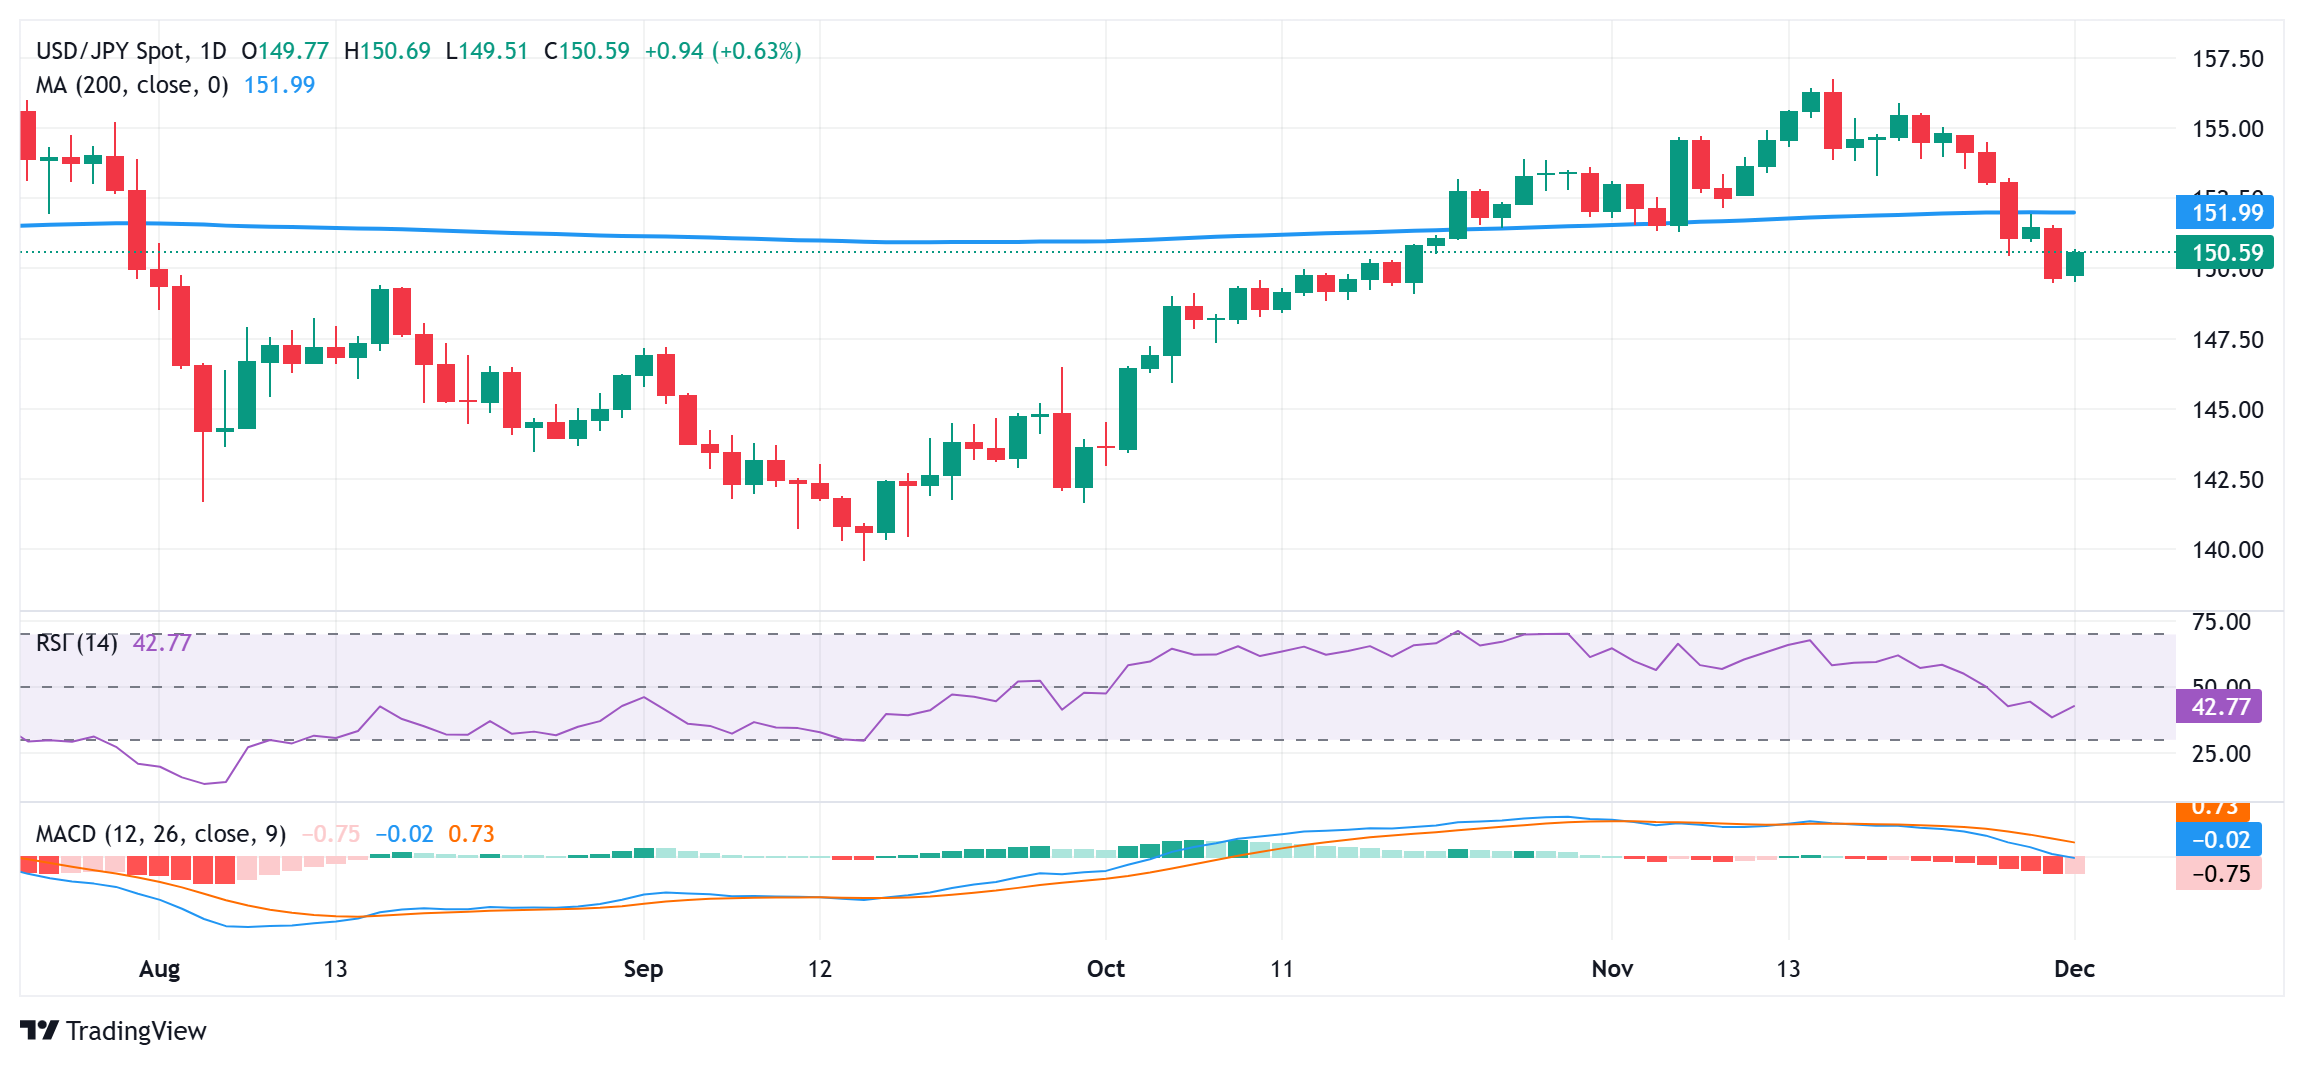
USD/JPY could resume the recent corrective fall once Friday’s swing low, near 149.45 area is broken

fxsoriginal

From a technical perspective, any further move up is likely to confront stiff resistance near the 151.00 round-figure mark amid negative oscillators on the daily chart. A sustained strength beyond, however, could trigger a short-covering rally and lift the USD/JPY pair to the 151.65 intermediate hurdle en route to the 152.00 mark. The latter represents the very important 200-day Simple Moving Average (SMA) and should act as a key pivotal point. Some follow-through buying will suggest that the recent corrective pullback from a multi-month top has run its course and shift the near-term bias back in favor of bullish traders.

On the flip side, the 150.00 psychological mark now seems to protect the immediate downside ahead of Friday’s swing low, around the 149.45 region. Some follow-through selling has the potential to drag the USD/JPY pair further towards the 149.00 round figure en route to the next relevant support 147.60-147.55 support and the 148.00 mark (50% retracement level of the September-November rally).


Gold price consolidates rising US bond yields and stronger USD-inspired losses

Gold price consolidates rising US bond yields and stronger USD-inspired losses

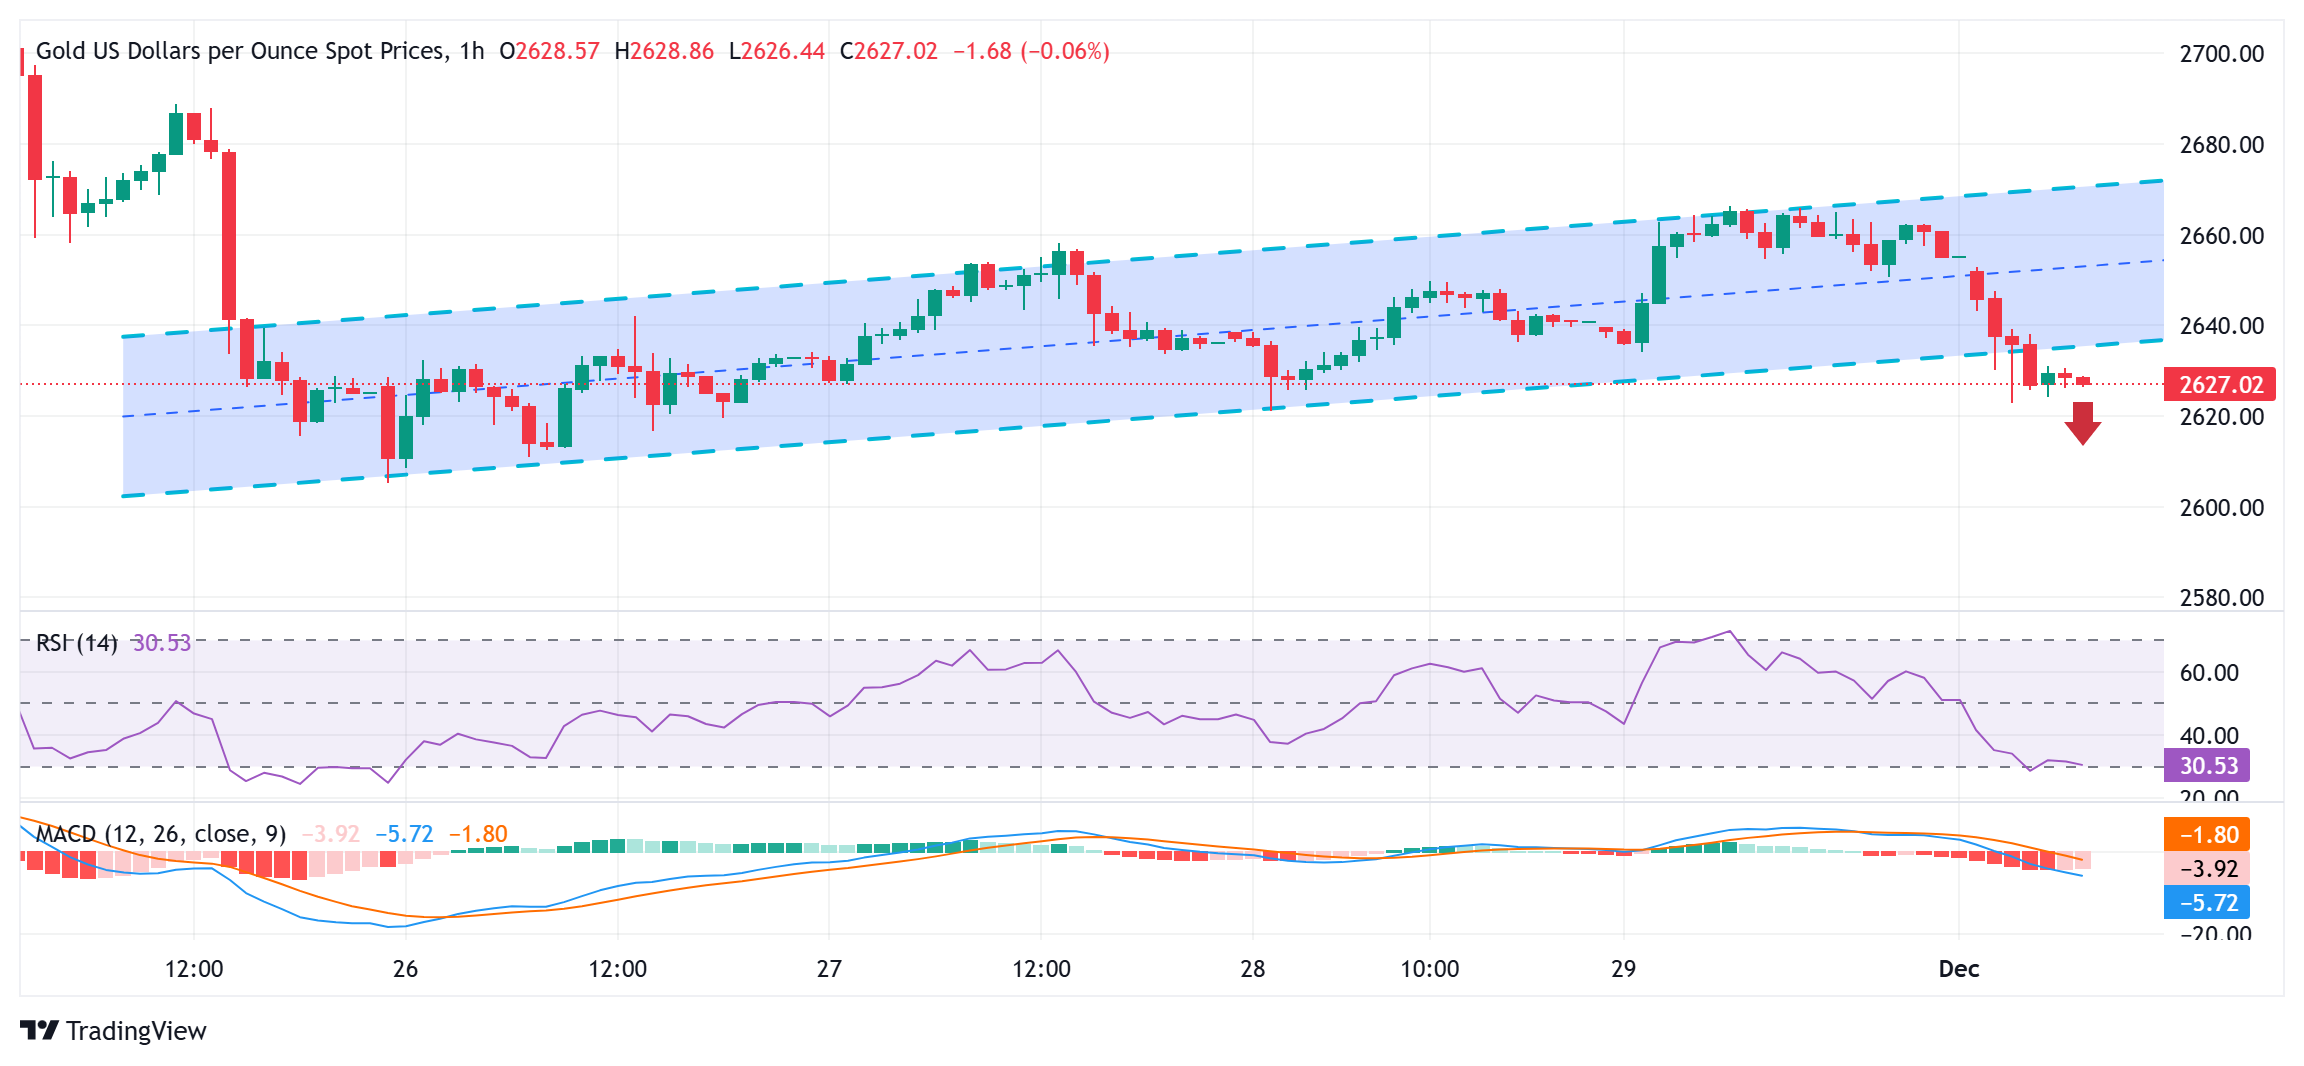
Gold price (XAU/USD) maintains its offered tone through the first half of the European session on Monday and currently trades around the $2,630 region, or the lower end of the daily range. The US Dollar (USD) makes a solid comeback following the recent pullback to a nearly three-week low amid a goodish pickup in the US Treasury bond yields and turns out to be a key factor weighing on the precious metal.

Furthermore, expectations that US President-elect Donald Trump’s tariff plans and expansionary policies will boost inflation, and set the stage for the Federal Reserve (Fed) to stop cutting interest rates further undermine the non-yielding Gold price. That said, trade war concerns, geopolitical tension and a softer risk tone should help limit losses for the safe-haven XAU/USD ahead of this week’s important US macro releases.

Gold price seems vulnerable to retest last week’s swing low, around the $2,600 neighborhood

fxsoriginal

From a technical perspective, an intraday slide below the lower boundary of a nearly one-week-old descending channel could be seen as a key trigger for bearish traders. Moreover, oscillators on daily/4-hour charts have again started gaining negative traction and suggest that the path of least resistance for the Gold price is to the downside. Hence, a subsequent fall back towards last week’s swing low, around the $2,605 region, looks like a distinct possibility. Some follow-through selling below the $2,600 mark would expose the 100-day Simple Moving Average (SMA), currently pegged near the $2,575 region.

On the flip side, the ascending trend-channel support breakpoint, around the $2,642-2,643 area, might now act as an immediate hurdle ahead of the $2,652 static resistance and last Friday’s swing high, around the $2,665 region. Some follow-through buying should allow the Gold price to reclaim the $2,700 round-figure mark and extend the positive move further towards the $2,721-2,722 supply zone. The latter should act as a pivotal point, which if cleared decisively will suggest that the recent corrective decline from the all-time peak touched in October has run its course and pave the way for a further appreciating move.

EUR/USD extends losses to 1.0550 as focus shifts to US ISM PMI

EUR/USD extends losses to 1.0550 as focus shifts to US ISM PMI

EUR/USD keeps falling to test 1.0500 in the European session on Monday. The pair is dragged down by dovish ECB-speak, French political woes and a firmer US Dollar following Trump tariffs threat on BRICS-fuelled flight to safety. Investors now await US ISM Manufacturing PMI data.

The Relative Strength Index (RSI) indicator on the 4-hour chart declined below 50 and EUR/USD closed the last three 4-hour candles below the 100-period Simple Moving Average (SMA), despite ending the week slightly above it.

EUR/USD struggles to build on the previous week’s gains and declines toward 1.0500 in the European morning on Monday. The technical outlook points to a bearish tilt in the near term.

The negative shift seen in risk mood and US President-elect Donald Trump’s comments on BRICS help the US Dollar (USD) gather strength at the beginning of the week.

Over the weekend, Trump warned against BRICS nations trying to replace the USD with their own currency. “We require a commitment from these countries that they will neither create a new BRICS currency, nor back any other currency to replace the mighty US Dollar or, they will face 100% tariffs, and should expect to say goodbye to selling into the wonderful US economy,” he said on X.

Meanwhile, US stock index futures were last seen losing above 0.2% on the day, reflecting the cautious market stance.

Later in the day, the ISM Manufacturing PMI data will be featured in the US economic docket. The headline PMI is forecast to edge higher to 47.5 in November from 46.5 in October. A reading above 50 could boost the USD and further weigh on the pair. On the other hand, a disappointing reading could hurt the USD with the immediate reaction. Nevertheless, EUR/USD’s recovery attempts could remain limited unless the risk mood improves in the second half of the day

USD: Sticky inflation to keep market guessing over Fed rate cuts

USD: Sticky inflation to keep market guessing over Fed rate cuts

The US Dollar (USD  ) remained reasonably bid on Tuesday as markets digested the US tariff news, while news of a peace deal between Israel and Hezbollah has not affected the market much. Apart from the understandable pressure on the Mexican peso and US car producers with facilities south of the border, there was little impact on the US rates markets. In other words, the inflationary side of potential tariffs has yet to play out in US asset markets, ING’s FX analyst Chris Turner notes.

The environment looks dollar-bullish

“On the subject of inflation, today sees the release of the core PCE deflator for October. The 0.3% month-on-month reading may still be a little too high for the Fed’s liking, although such a number is fully discounted today. That means the market probably retains its pricing of 15bp worth of Fed cuts in December and also keeps US rate differentials versus the Rest of the World at reasonably wide levels.”

“We are bullish on the dollar and note that today’s US data set, including confirmation of US third-quarter GDP at 2.8% quarter-on-quarter annualized, will be the last in this holiday-shortened week. In its entirety, the environment looks dollar-bullish to us. The main downside risk to the dollar this week probably comes from month-end rebalancing flows.”

“Here the huge divergence for dollar-based equity investors of S&P 500 +5.3% month-to-date versus -1.36% for the Eurostoxx 50 or -1.6% for the Nikkei 225 warns of rebalancing dollar sales to raise European and Japanese equity weightings back to benchmarks. These flows could be going through poor liquidity conditions later this week, but any DXY dip to the 106.25/50 area this week should meet good demand.”