The European Central Bank prescribes pain

The European Central Bank prescribes pain

“Market sentiment” is one of modernity’s great phrases. The markets sense that a European recession is looming: the euro exchange rate has fallen by 5% since July, interest rates on government bonds are falling; money is always quick to scare. Businesses are also beginning to sense that a downturn is coming: wage growth is slowing in the eurozone, despite the fact that several countries are experiencing record low unemployment. Such downturns — in the form of recession — have multiple causes; that’s a truism in economics: everything is multi-causal. Among the main causes, we could cite geopolitical factors: a war in Europe that is pushing up the prices of raw materials, and an emerging power, China, that is maneuvering to steal the spotlight away from the declining world power, the United States. Then there are the lingering effects of the pandemic in half the world’s fiscal space, supply chain difficulties and the combined shock of the technological and environmental revolutions; the list of causes is almost endless.

In Europe, there is another reason: the maneuvers of the European Central Bank (ECB), which has been rudderless since Mario Draghi left the role. His replacement, Christine Lagarde, has made a long list of blunders, including in communication, which her supporters claimed was her main asset when she first arrived in the position lacking any experience in the tempestuous area of monetary policy. She is not alone. Her number two, Luis de Guindos, went straight from being Spain’s Ministry of Economy under the Rajoy government to ECB headquarters in Frankfurt, that combination of Harry Potter’s Hogwarts, the Death Star and Scrooge’s office in Dickens’ A Christmas Carol. Lagarde has once again raised interest rates when it was not necessary to do so: her own forecasts anticipate that inflation will fall at the end of 2023 and next year. Her mandate — that famous inflation target “below, but close to 2%” — can only be achieved through rigor, the hawks who now dominate the ECB tell us.

The danger is that so much rigor will end up becoming rigor mortis. There are not many ways for a central bank to tackle inflation, beyond raising rates, sitting back and watching as economic actors are forced to lower wages and moderate prices because the economy has cooled down to the point of shivering. That can lead to a slowdown or, in the worst cases, a recession. We are headed in that direction, creating a little economic pain in order to tame down market forces in the form of prices and wages.

In its penchant for pain, the ECB has forgotten some things: the eurozone has suffered two major crises in the past 15 years, and the middle classes’ loss of purchasing power is bringing old demons out of the closet; the malaise is there, and every now, and then it causes a fright. The ECB has also forgotten that, as the Spanish case has shown, there are policies for fighting inflation beyond monetary policy. It has forgotten that the difference between a good policy and a mediocre one depends on the credibility of the institutions, not on meticulously following a handful of rules that were written in bronze a few decades ago for a world that no longer exists. The sacrosanct rule of keeping the price target at 2% is beyond debatable; for years, the best economic experts have been pointing toward 3%, even 4% to widen the central banks’ margin for action. And following the anti-inflationary rulebook to the letter is equally absurd: so much so that the ECB’s own mandate makes it clear that the ECB must also deal with financial stability and, in a more diffuse way, with unemployment and the economic situation.

The ECB was designed in the image and likeness of the Bundesbank, and in German economic thought, inflation is the worst of all evils, much like the United States’ worst nightmare is depression. Lagarde has taken out a hammer and sees nails everywhere, but stagflation — stagnation combined with inflation — is the issue before her, and that cannot be fixed by raising interest rates like there’s no tomorrow. The economy is a toolbox of options. This time, it would have been enough to let interest rates plateau for a while, but the ECB has chosen to ratchet up the pain in the name of so-called orthodoxy. Manca finezza; there are more ex-politicians worried about their reputations in central bank leadership positions than there are central bankers monitoring the eurozone’s stability. That’s 10 interest rate hikes since mid-2022; the most recent one is unnecessary and beyond questionable. We have not yet seen the full effects of this escalation. These things take time. But pain is a certainty; we are going headfirst into the rocks of a recession. Congratulations to the winners.

China’s financial institutions see assets increase in Q2

China’s financial institutions see assets increase in Q2

China’s financial institutions saw expanded balance sheets by the end of the second quarter (Q2) of 2023, according to official data.

The country’s financial institutions saw their combined assets increase 10.3 percent year on year to 449.21 trillion yuan (about 62.58 trillion U.S. dollars) by the end of Q2, while their combined liabilities rose 10.6 percent from a year earlier to 410.48 trillion yuan, data from the People’s Bank of China showed.

Banking institutions — accounting for the largest portion of the financial industry — reported a 10.5 percent rise in total assets, while entities in the securities industry saw their combined assets expand by 5 percent year on year.

Assets of the country’s insurers totaled 29.2 trillion yuan, up 9.6 percent year on year, the data revealed.

Crypto News: CoinEx Targets Hackers While JEPX Comes Under Investigation

Crypto News: CoinEx Targets Hackers While JEPX Comes Under Investigation

The Sunday Session Overview

Holesky: Failed to Launch: The release of the Holesky testnet experienced a hiccup on the weekend. A reported misconfiguration forced Ethereum developers to delay the launch to address coding issues. Developers planned the Holesky testnet launch to coincide with the first year anniversary of the Merge. Paritosh, a developer at the Ethereum Foundation, shared the news of the misconfiguration, stating that the team will relaunch in two weeks.

A-Listers Embroiled in the FTX Case Settle: On Saturday, news hit the wires of YouTube influencers Tom Nash and Kevin Paffrath agreeing to settle cases brought against them for misleading investors. NFL quarterback Trevor Lawrence also settled a suit against him for his involvement in misleading investors. The three form part of a list of A-list celebrities and sporting icons who face legal action over their association with FTX. Tom Brady, Stephen Curry, Larry David, Shaquille O’Neal, and Naomi Osaka are among them.

Trading Derivatives carries a high level of risk to your capital and you should only trade with money you can afford to lose. Trading Derivatives may not be suitable for all investors, so please ensure that you fully understand the risks involved, and seek independent advice if necessary. A Product Disclosure Statement (PDS) can be obtained either from this website or on request from our offices and should be considered before entering into a transaction with us. Raw Spread accounts offer spreads from 0.0 pips with a commission charge of USD $3.50 per 100k traded. Standard account offer spreads from 1 pips with no additional commission charges. Spreads on CFD indices start at 0.4 points. The information on this site is not directed at residents in any country or jurisdiction where such distribution or use would be contrary to local law or regulation.

CoinEx Lures Hackers to the Negotiating Table: On Friday, CoinEx posted an open letter to the Hackers. While asking the hackers to return the stolen funds, CoinEx extended an olive branch, saying, “If you are willing to return the stolen assets, we will offer you a generous bug bounty.” While highlighting the seriousness of the crime, CoinEx also invited the hackers to discuss the future upgrade of CoinEx’s security system. According to an Elliptic report, the infamous Lazarus Group was behind the $54 million CoinEx hack.

Crypto Platform JPEX Suspends Trading: On Sunday, JPEX announced the suspension of trades from today. The platform is under investigation in Hong Kong for suspected fraud. According to the South China Morning Post, JPEX had yet to file license applications. Hong Kong police reportedly received 83 complaints involving $4.3 million.

Technical Analysis

Bitcoin Analysis

BTC pulled back from the $26,755 resistance level after several rejected attempts to target $27,000. Significantly, BTC remained below the 50-day and 200-day EMAs, affirming bearish price signals.

A break above the $26,755 resistance level would support a BTC move to the 200-day EMA. However, a return to $26,000 would give the bears a run at the trend line. A break below the trend line would support a BTC move toward the $25,506 support level.

The 14-Daily RSI reading of 48.89 supports a BTC fall to the trend line before entering oversold territory.

BTC Daily Chart sends bearish price signals.
BTCUSD 180923 Daily Chart

Ethereum Analysis

ETH sat above the $1,626 support level. However, ETH continued to hover below the 50-day and 200-day EMAs, sending bearish price signals. An ETH break below the $1,626 support level would support an ETH move toward the $1,502 support level.

However, a return to $1,650 would give the bulls a run at the 50-day EMA.

Beyond the crypto news wires, SEC v Ripple and Coinbase (COIN) case-related news, and ETH-spot ETF updates would provide direction.

The 14-Daily RSI reading of 45.40 supports an ETH return to $1,600 before entering oversold territory.

ETH Daily Chart sends bearish price signals.
ETHUSD 180923 Daily Chart
Dax Index: Dax Stocks Reflect Hope as China Signals Economic Recovery

Dax Index: Dax Stocks Reflect Hope as China Signals Economic Recovery

DAX Friday Overview

On Friday, the DAX rose by 0.56%. The DAX ended the week up 0.97% to 15,894.

China Economic Indicators Provide Friday Relief

Economic indicators from China eased fears of slower economic growth. Better-than-expected industrial production and retail sales figures flagged a much-needed pickup in demand and consumption.

Trading Derivatives carries a high level of risk to your capital and you should only trade with money you can afford to lose. Trading Derivatives may not be suitable for all investors, so please ensure that you fully understand the risks involved, and seek independent advice if necessary. A Product Disclosure Statement (PDS) can be obtained either from this website or on request from our offices and should be considered before entering into a transaction with us. Raw Spread accounts offer spreads from 0.0 pips with a commission charge of USD $3.50 per 100k traded. Standard account offer spreads from 1 pips with no additional commission charges. Spreads on CFD indices start at 0.4 points. The information on this site is not directed at residents in any country or jurisdiction where such distribution or use would be contrary to local law or regulation.

Before the economic indicators, the PBoC cut the Reserve Requirement Ratio by 25 basis points. However, uncertainty about the Chinese economic outlook lingers despite the latest numbers and PBoC moves.

Eurozone Trade Data Failed to Spook Investors

In July, the Eurozone trade surplus narrowed from €18.5 billion to €6.5 billion. Economists forecast a widening to €20.0 billion. Imports from the rest of the world were down 18.2% compared with July 2022, with exports falling by 2.7% year-over-year. While the softer exports offered relief, the decline in imports signaled a weakening demand environment.

US Consumer Sentiment Wanes

A modest decline in the Michigan Consumer Sentiment Index had a limited impact on investor sentiment. However, consumer inflation expectations supported bets on the Fed ending its interest rate hike cycle.

US equities struggled despite the market sentiment toward Fed interest rates and the economic outlook. The Dow declined by 0.83%, with the S&P 500 and NASDAQ Composite Index seeing losses of 1.22% and 1.56%, respectively.

The Friday Market Movers

Auto stocks were among the front-runners, with the PBoC and the China numbers raising hopes of a pickup in demand.

BMW and Continental gained 1.66% and 1.36%, respectively. Volkswagen and Mercedes Benz Group rose by 1.07% and 1.13%, respectively. Porsche ended the session up 0.99%.

Adidas (+1.86%) joined the broader market with solid gains on sentiment toward the Chinese economy.

The Monday Session

The futures markets are pointing to a choppy start to the week. The DAX was down 2 points, while the NASDAQ gained 17 points.

Central Banks and Fed Fear to Test Investor Appetite

The European markets brushed aside the negative sentiment across the US equity markets on Friday. However, we expect investors to be mindful of the imminent Fed interest rate decision and FOMC economic projections.

Upward revisions to inflation and growth forecasts and downward revisions to unemployment would support one final Fed rate hike. However, Fed Funds Rate projections must align with any bullish FOMC projections. Uncertainty about the Fed interest rate trajectory will likely test buyer appetite.

ECB Executive Board members may also influence sentiment toward ECB monetary policy goals. Luis de Guindos and Fabio Panetta are on the calendar to speak today. The threat of further rate hikes and the talk of higher for longer could affect investor sentiment.

Short-Term Forecast

The focus will be on the Federal Reserve, the Wednesday interest rate decision, and economic projections. A high level of uncertainty regarding the November policy decision leaves the DAX at the mercy of the Fed. Fed policy uncertainty will likely limit any upside until the Fed signals its November outlook.

DAX Technical Indicators

Daily Chart

On Friday, resistance at 16,000 left the DAX short of the 16,007 resistance level. However, the DAX remained above the 50-day and 200-day EMAs, sending bullish price signals. A break above the 16,007 resistance level would support a DAX move toward the 16,192 resistance level.

However, a break below the 50-day EMA would give the bears a run at the trend line. Risk aversion would leave the 15,663 support level in view.

The 14-Daily RSI reading of 54.03 supports a DAX break above the 16,007 resistance level before entering overbought territory.

DAX Daily Chart sends bullish price signals.
DAX 180923 Daily Chart

4-Hourly Chart

The DAX sits above the 50-day and 200-day EMAs, reaffirming bullish price signals. A DAX hold above the 200-day EMA would support a move to the 16,007 resistance level.

However, a break below the 200-day EMA would bring the 50-day EMA and the trend line into play. Buying pressure will likely intensify at 15,800, with the 50-day EMA confluent with the trend line.

The 58.36 RSI reading indicates a DAX return to 16,000 before entering overbought territory.

4-Hourly Chart affirms bullish price signals.
DAX 180923 4-Hourly Chart
USD to CAD Prices Analysis: Loonie Rides High on Oil Amidst Fed Uncertainties

USD to CAD Prices Analysis: Loonie Rides High on Oil Amidst Fed Uncertainties

USD to CAD Dynamics amidst Fed Speculations

The USD to CAD Forex pair is navigating choppy waters as traders keenly await the U.S. Federal Reserve’s upcoming policy meeting. While the Fed’s decision on interest rates holds sway over the USD, rising crude oil prices are boosting the Canadian Dollar, setting the stage for a fascinating currency tug-of-war.

At 07:20 GMT, the USD to CAD is trading 1.3501, down 0.0026 or -0.19%.

Trading Derivatives carries a high level of risk to your capital and you should only trade with money you can afford to lose. Trading Derivatives may not be suitable for all investors, so please ensure that you fully understand the risks involved, and seek independent advice if necessary. A Product Disclosure Statement (PDS) can be obtained either from this website or on request from our offices and should be considered before entering into a transaction with us. Raw Spread accounts offer spreads from 0.0 pips with a commission charge of USD $3.50 per 100k traded. Standard account offer spreads from 1 pips with no additional commission charges. Spreads on CFD indices start at 0.4 points. The information on this site is not directed at residents in any country or jurisdiction where such distribution or use would be contrary to local law or regulation.

Crude Oil Rise Influencing the Loonie

The Canadian dollar, also known as the loonie, is on a bullish track against its U.S. counterpart and other G10 currencies. This strength emanates from robust investor sentiment and escalating crude oil prices, which recently hit an annual high. The tightening oil supply, spurred by Saudi Arabian production cuts and a favorable demand outlook in China, has allowed the loonie to rebound from its oversold status. Brent crude’s recent surge to a 10-month high above $93 a barrel adds credence to this trend.

Crucial Economic Indicators

On the home front, Canada’s economic indicators paint a mixed picture. While wholesale trade recorded a modest 0.2% growth in July, it fell short of expectations. Yet, the automotive sector remains a bright spot. Moreover, economists project Canada’s inflation to rise to an annual rate of 3.8% in August, up from 3.3% in July. Stateside, U.S. retail sales data has reduced recession fears, suggesting that the Fed might maintain higher interest rates to curb inflation.

Bond Yields and Rate Expectations

Canadian bond yields are trailing their U.S. counterparts, with the 2-year yield showing a gap of 30 basis points below the U.S. rate. In contrast, U.S. Treasury yields, particularly the 10-year, are climbing, driven partly by expectations that the Fed will hold its ground on interest rates. Futures pricing indicates just a 3% chance of a rate hike from the Fed, keeping traders on their toes.

Short-Term Forecast: Leaning Bearish

Given the Fed’s likely unchanged stance and the bullish momentum in crude oil prices, the short-term outlook for USD/CAD tilts bearish. Investors should keep a close eye on the Fed’s policy decisions and crude oil dynamics, as both will be pivotal in shaping the loonie’s trajectory against the U.S. dollar in the near term.

Technical Analysis

4-Hour USD to CADThe currency pair recently traded at 1.3497, slightly below its previous 4-hour price of 1.3511. It’s trading below both the 200-4H moving average of 1.3520 and the 50-4H moving average of 1.3583, suggesting a short-term bearish momentum. The 14-4H RSI reads 35.87, nearing the oversold territory, indicating the potential for weakened bullish momentum.

The price is also hovering inside the main support area, ranging between 1.3508 to 1.3483. There’s a distinct resistance above at 1.3612 to 1.3654. Given these factors, the current market sentiment leans bearish for the USD to CAD pair on a 4-hour timeframe.

Silver Prices Analysis: XAG/USD Rising in Shadow of Fed’s Rate Decision

Silver Prices Analysis: XAG/USD Rising in Shadow of Fed’s Rate Decision

Silver’s Reaction to Central Bank Policies

Silver (XAG/USD) has captured investor attention as the current price action hints at benefiting from the Federal Reserve’s prospective pause in interest rate hikes at this week’s policy meeting. This precious metal’s performance is being influenced by several factors, including economic indicators and central bank decisions, both domestic and international.

At 06:21 GMT, Spot Silver (XAG/USD) is trading $23.176, up $0.1138 or +0.49%. December Comex Silver futures are at $23.455, up $0.069 or +0.30%.

Trading Derivatives carries a high level of risk to your capital and you should only trade with money you can afford to lose. Trading Derivatives may not be suitable for all investors, so please ensure that you fully understand the risks involved, and seek independent advice if necessary. A Product Disclosure Statement (PDS) can be obtained either from this website or on request from our offices and should be considered before entering into a transaction with us. Raw Spread accounts offer spreads from 0.0 pips with a commission charge of USD $3.50 per 100k traded. Standard account offer spreads from 1 pips with no additional commission charges. Spreads on CFD indices start at 0.4 points. The information on this site is not directed at residents in any country or jurisdiction where such distribution or use would be contrary to local law or regulation.

Investor Sentiment and Economic Indicators

Last week, silver advanced on the back of a weaker dollar and U.S. job market resilience, among other positive economic factors. Asian stocks’ downturn further strengthened silver’s appeal as a safe-haven asset. At the same time, the United Auto Workers union’s strikes across Detroit emphasized the metal’s attractiveness during geopolitical turmoil.

Chinese Influence on Silver Markets

Chinese industrial output and retail sales figures exceeded estimates, fueling optimism for increased demand in metals and commodities. The People’s Bank of China also contributed to bullish sentiment by reducing banks’ required cash reserves. These strong indicators are likely to further drive up demand for metals like silver, especially in the world’s largest metals consumer, China.

Currency Dynamics and Speculation

Recent U.S. data releases led to a dip in the dollar, making silver more affordable for those trading in other currencies. Spot silver consequently experienced significant gains, despite COMEX speculators trimming their net long positions. Chinese consumers, hedging against a weakening yuan, are pushing silver—and gold—prices to unprecedented heights.

Short-term Forecast- Fed Dependent

With the Federal Reserve’s policy meeting imminent, silver prices remain highly sensitive to interest rate dynamics. Should the central bank lean dovish, a substantial silver rally could be in the offing. Conversely, any upward movement in interest rates could make this non-yielding asset less attractive to investors.

In light of the various indicators and economic landscapes, the short-term market sentiment for silver appears bullish. The upcoming Federal Reserve meeting will likely confirm or refute this trend, making it a key event that traders and investors should keenly watch.

Technical Analysis

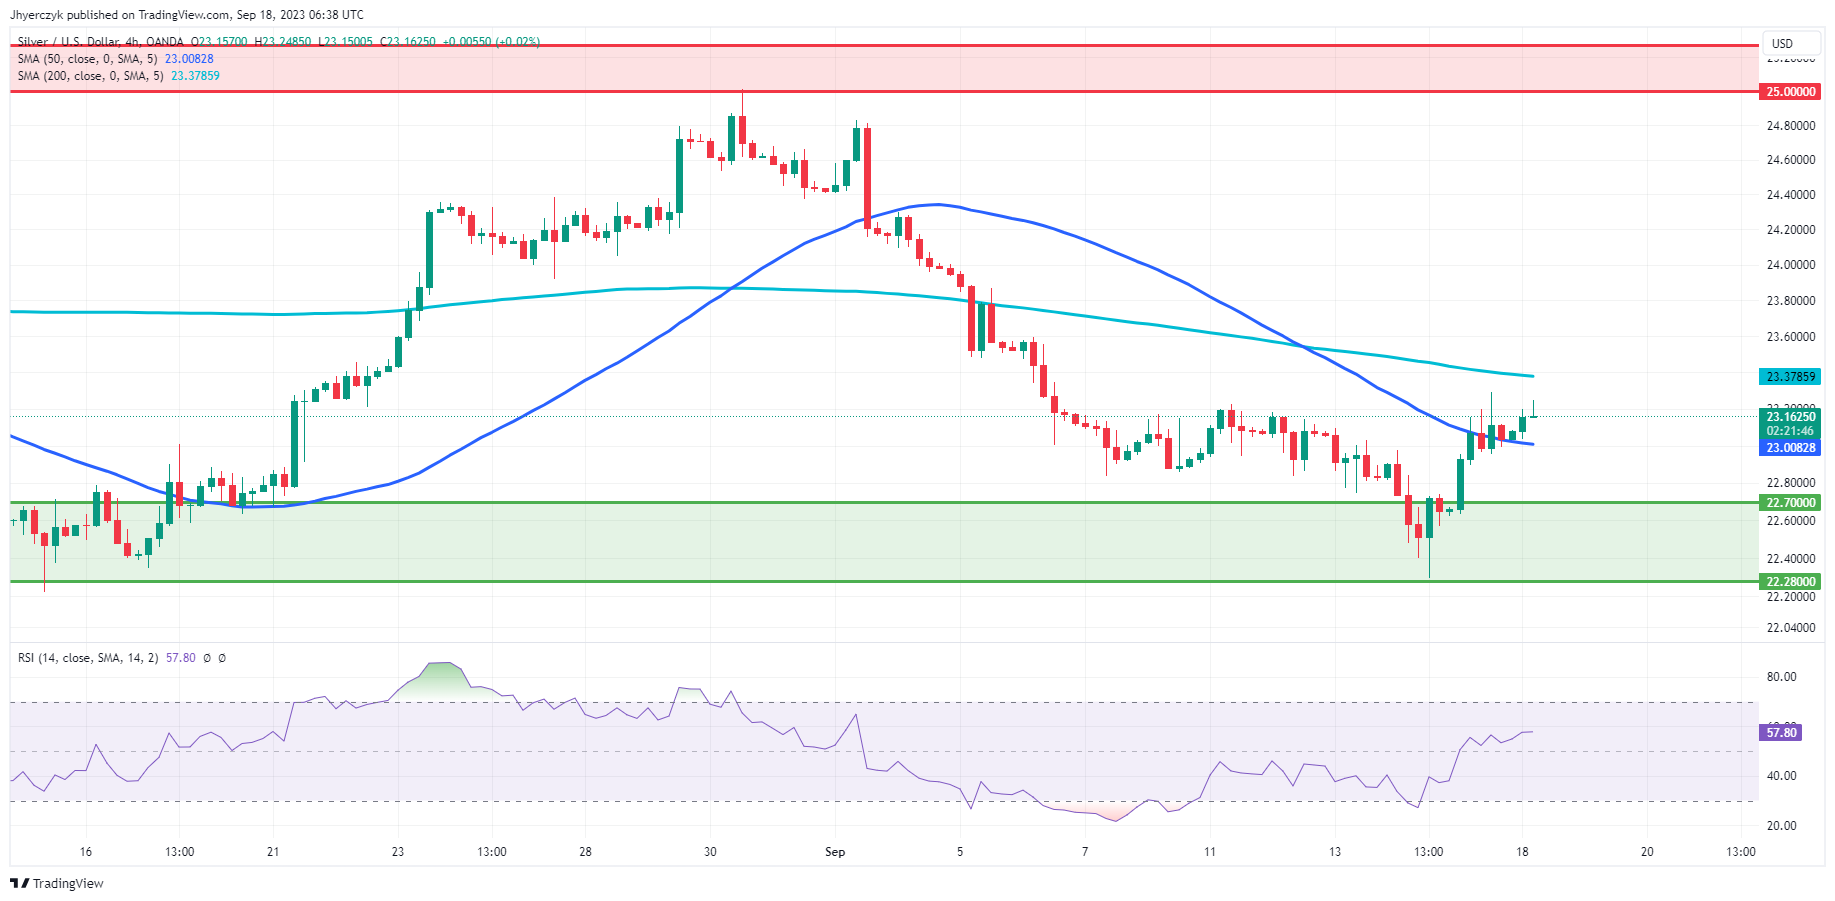
4-Hour Silver (XAG/USD)Based on the provided 4-hour chart data for Silver (XAG/USD), the commodity’s current price of 23.14 sits below the 200-4H moving average of 23.38, indicating a potential bearish trend. However, it’s positioned above the 50-4H moving average of 23.01, suggesting recent bullish momentum. The 14-4H RSI at 57.17 points towards moderate upward momentum, being above the neutral mark but below overbought conditions.

The price is navigating between significant support at 22.70-22.28 and main resistance between 25.00-25.27. Despite a slight decrease from the previous 4-hour price, overall market sentiment leans bullish, influenced by its stance relative to the moving averages and RSI indication.

Gold Prices Analysis: XAU/USD Spot Value Climbs as Central Bank Decisions Loom

Gold Prices Analysis: XAU/USD Spot Value Climbs as Central Bank Decisions Loom

Gold Responds to Central Bank Decisions

Gold (XAU/USD) edged higher early Monday, buoyed by investor sentiment hinting at the Federal Reserve’s possible pause in interest rate hikes on Wednesday. With the U.S. central bank’s policy meeting approaching, traders are keenly watching the interest rate trajectory.

At 05:41 GMT, Gold (XAU/USD) is trading $1929.87, up $6.55 or +0.34%. December gold futures are at $1950.90, up $4.70 or +0.24%.

Trading Derivatives carries a high level of risk to your capital and you should only trade with money you can afford to lose. Trading Derivatives may not be suitable for all investors, so please ensure that you fully understand the risks involved, and seek independent advice if necessary. A Product Disclosure Statement (PDS) can be obtained either from this website or on request from our offices and should be considered before entering into a transaction with us. Raw Spread accounts offer spreads from 0.0 pips with a commission charge of USD $3.50 per 100k traded. Standard account offer spreads from 1 pips with no additional commission charges. Spreads on CFD indices start at 0.4 points. The information on this site is not directed at residents in any country or jurisdiction where such distribution or use would be contrary to local law or regulation.

Economic Landscape and Gold’s Safe-Haven Appeal

As Asian stocks reeled on Monday, gold gained traction among investors. The financial landscape hints at potential central bank events that may shake the markets. A confluence of factors – the U.S. job market’s resilience, controlled inflation, and accelerated growth – suggest that Fed officials might project an economic soft landing in their upcoming forecasts. However, the anticipation of another rate hike persists. Additionally, the United Auto Workers union strikes across three Detroit automakers underscored gold’s appeal as a safe-haven asset during geopolitical uncertainties.

Currency Dynamics and Gold Performance

A dip in the dollar, following recent U.S. data releases, rendered gold cheaper for those dealing in other currencies. Consequently, spot gold surged, registering notable gains for the week. This uptrend comes despite COMEX gold speculators trimming their net long positions.

International Repercussions and Market Outlook

Chinese consumers, hedging against a weakening yuan, have driven gold prices to new heights. Physical gold premiums in China have mirrored this surge, hitting unprecedented levels due to robust demand and limited fresh import quotas. As the yellow metal’s appeal wanes in light of soft-landing predictions and prolonged high rates, the market is looking for fresh triggers to reignite bullish sentiments.

The Road Ahead:  Fed Dependent

With gold’s performance intricately linked to interest rate moves, all eyes are on the Federal Reserve’s forthcoming policy meeting. Should the central bank adopt a dovish stance, it could spell a significant rally for gold. However, any upward trajectory in interest rates might see the non-yielding asset lose its sheen among investors.

Technical Analysis

4-Hour Gold (XAU/USD)The current price of 1930.53 is slightly above its previous 4-hour price of 1928.26, indicating a marginal upward movement. This price sits comfortably above both the 200-4H moving average (1920.02) and the 50-4H moving average (1918.49), suggesting a current bullish momentum. The 14-4H RSI at 67.71 is approaching the overbought threshold but is not there yet, implying strong buying momentum.

Gold (XAU/USD) is trading above its main support area (1893.07 to 1885.79) but is inching closer to the main resistance zone (1946.99 to 1954.88). Given the indicators and positioning, the current market sentiment leans towards being bullish.

Oil Prices Forecast: WTI, Brent Surge Amid OPEC Supply Cuts, China’s Stimulus

Oil Prices Forecast: WTI, Brent Surge Amid OPEC Supply Cuts, China’s Stimulus

Supply Concerns and Chinese Demand

Crude oil prices posted a surge on Monday, for a third consecutive session, driven by the ongoing supply cuts from Saudi Arabia and Russia, coupled with a positive demand outlook from China, the globe’s leading crude oil importer. This uptrend was further supported by China’s latest stimulus measures and promising U.S. economic indicators.

At 05;10 GMT, December WTI crude oil is trading $89.44, up $0.47 or +0.53% and December Brent crude oil is at $93.57, up $0.53 or +0.57%.

Trading Derivatives carries a high level of risk to your capital and you should only trade with money you can afford to lose. Trading Derivatives may not be suitable for all investors, so please ensure that you fully understand the risks involved, and seek independent advice if necessary. A Product Disclosure Statement (PDS) can be obtained either from this website or on request from our offices and should be considered before entering into a transaction with us. Raw Spread accounts offer spreads from 0.0 pips with a commission charge of USD $3.50 per 100k traded. Standard account offer spreads from 1 pips with no additional commission charges. Spreads on CFD indices start at 0.4 points. The information on this site is not directed at residents in any country or jurisdiction where such distribution or use would be contrary to local law or regulation.

OPEC+ and Central Bank Policies

The collective OPEC+ effort, which includes Saudi Arabia and Russia, has agreed to extend their supply reductions until year’s end. With major refineries in China amplifying their output due to lucrative export margins, there is a heightened focus on the upcoming decisions from key central banks like the U.S. Federal Reserve regarding interest rate policies, as well as important economic data releases from China.

A Look at Brent and WTI

Both Brent and WTI crude oil benchmarks have been on the rise for three successive weeks, reaching peak levels unseen since the prior November. This surge is attributed to the geopolitical tensions caused by Russia’s invasion of Ukraine in early 2022.

Potential Deficit and Price Predictions

ANZ analysts point to a potential market imbalance, suggesting a deficit of 2 million barrels per day in the upcoming fourth quarter due to the extended OPEC+ cuts. This significant shortfall may subsequently lead to dwindling inventories, raising concerns about potential price escalations in 2024. Observers believe that the oil price is likely to stabilize above the $90 per barrel mark, which might divert attention towards the demand forecast from major global economies.

Global Demand Growth – Bullish Outlook

The global appetite for oil is projected to grow by 2.1 million bpd, a forecast that resonates with predictions from both the International Energy Agency and the Organization of the Petroleum Exporting Countries (OPEC). The underlying sentiment remains bullish for the oil market in the short-term horizon.

Technical Analysis

4-Hour Light Crude Oil FuturesThe Light Crude Oil Futures is currently priced at 90.60 on the 4-hour chart, slightly higher than its preceding 4-hour price of 90.36. This current level is notably above the 200-4H moving average of 83.36 and the 50-4H moving average of 88.32. The 14-4H RSI reading is at 61.33, suggesting that there is positive momentum, but it hasn’t reached overbought territory.

Presently, the commodity hovers between the main support zone of 84.89-83.81 and approaches the primary resistance area of 90.10-93.74. Taking these indicators into account, the prevailing market sentiment for Light Crude Oil Futures appears to be bullish, with the price moving towards the resistance and supported by a relatively strong RSI.

British Pound Slides Ahead of BoE Rate Decision. Where to for GBP/USD and EUR/GBP?

British Pound Slides Ahead of BoE Rate Decision. Where to for GBP/USD and EUR/GBP?

The British Pound has slipped to its lowest level in 3 months ahead of the Bank of England monetary policy decision this Thursday.

Interest rate markets see around an 80% chance of a 25 basis point (bp) hike to lift the cash rate to 5.50%, the highest level since prior to the financial crisis in 2008.

If the bank surprises markets with anything other than 25 bp of tightening, Sterling volatility might kick off.

GBP/USD TECHNICAL ANALYSIS SNAPSHOT

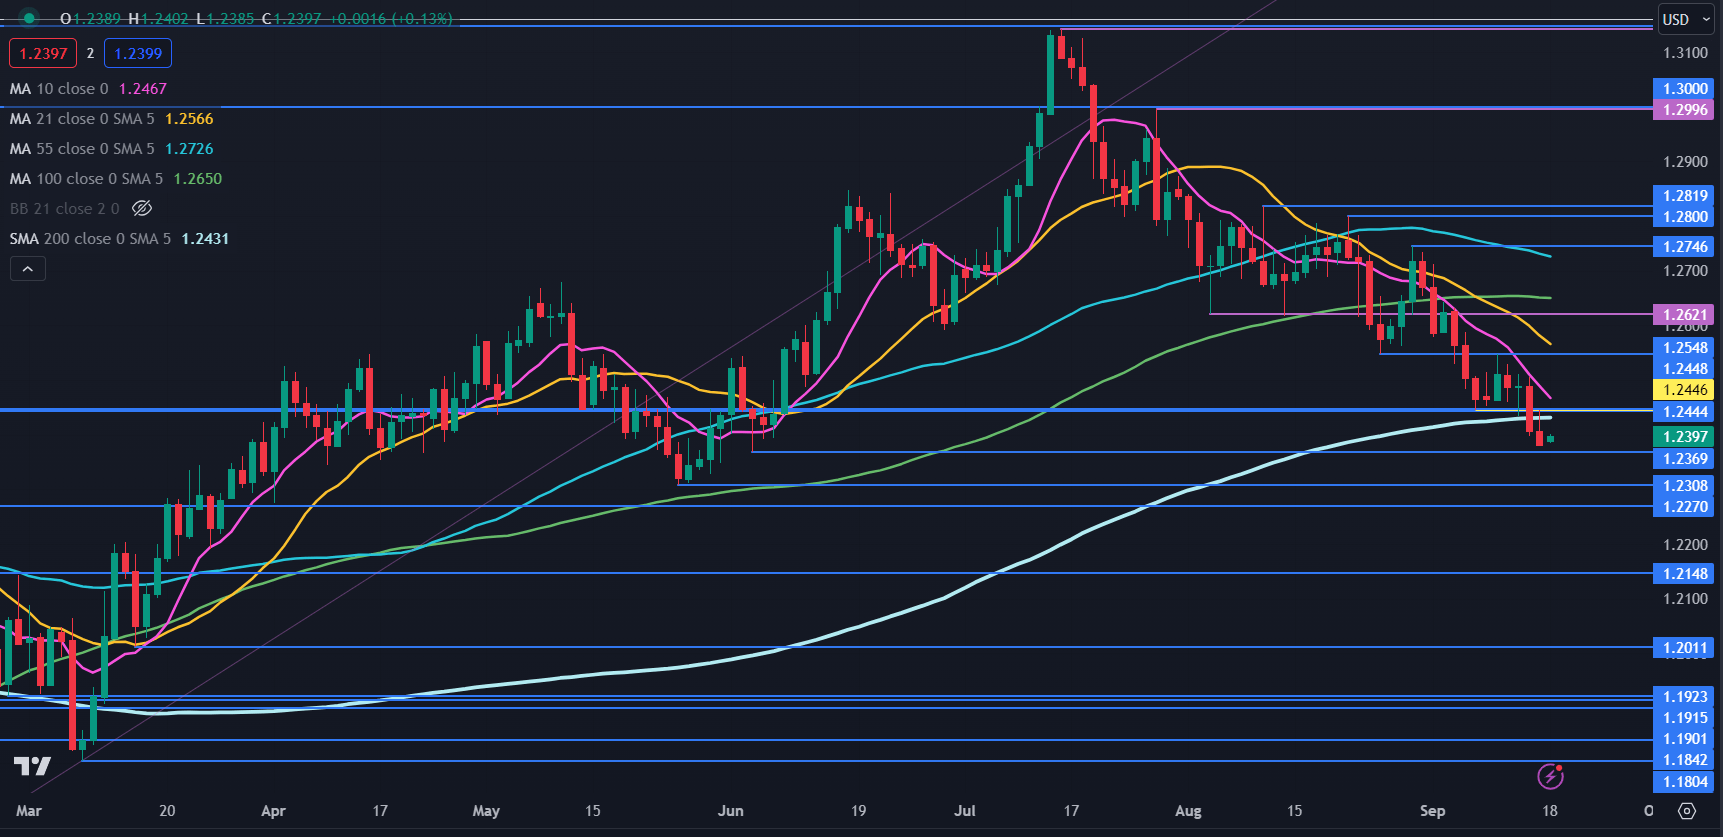
GBP/USD made a low at 1.2379 on Friday and finished the week near there without testing potential support at the early June low of 1.2369.

It has steadied so far on Monday but might be vulnerable after closing below the 200-day simple moving average (SMA).

The 200-day SMA may offer resistance ahead of the breakpoints at 1.2445, 1.2550 and 1.2620. Above there, the prior peaks at 1.2746, 1.2800 and 1.2819 might offer resistance.

Resistance could also be near the high at the psychological level of 1.3000, which concurs with a historical breakpoint.

Further up, the 16-month high of 1.3142 is also just below some breakpoints in the 1.3150 – 1.3160 area and may offer a resistance zone.

A bearish triple moving average (TMA) formation requires the price to be below the short-term SMA, the latter to be below the medium-term SMA and the medium-term SMA to be below the long-term SMA. All SMAs also need to have a negative gradient.

When looking at any combination of the 10-, 21-, 55- and 100-day SMAs, the criteria for a TMA have been met and might suggest that bearish momentum is evolving.

Support could be at the previous lows and breakpoints at 1.2369, 1.2308, 1.2270, 1.2148, 1.2011 and 1.1804.

GBP/USD DAILY CHART

image1.png

EUR/GBP TECHNICAL ANALYSIS

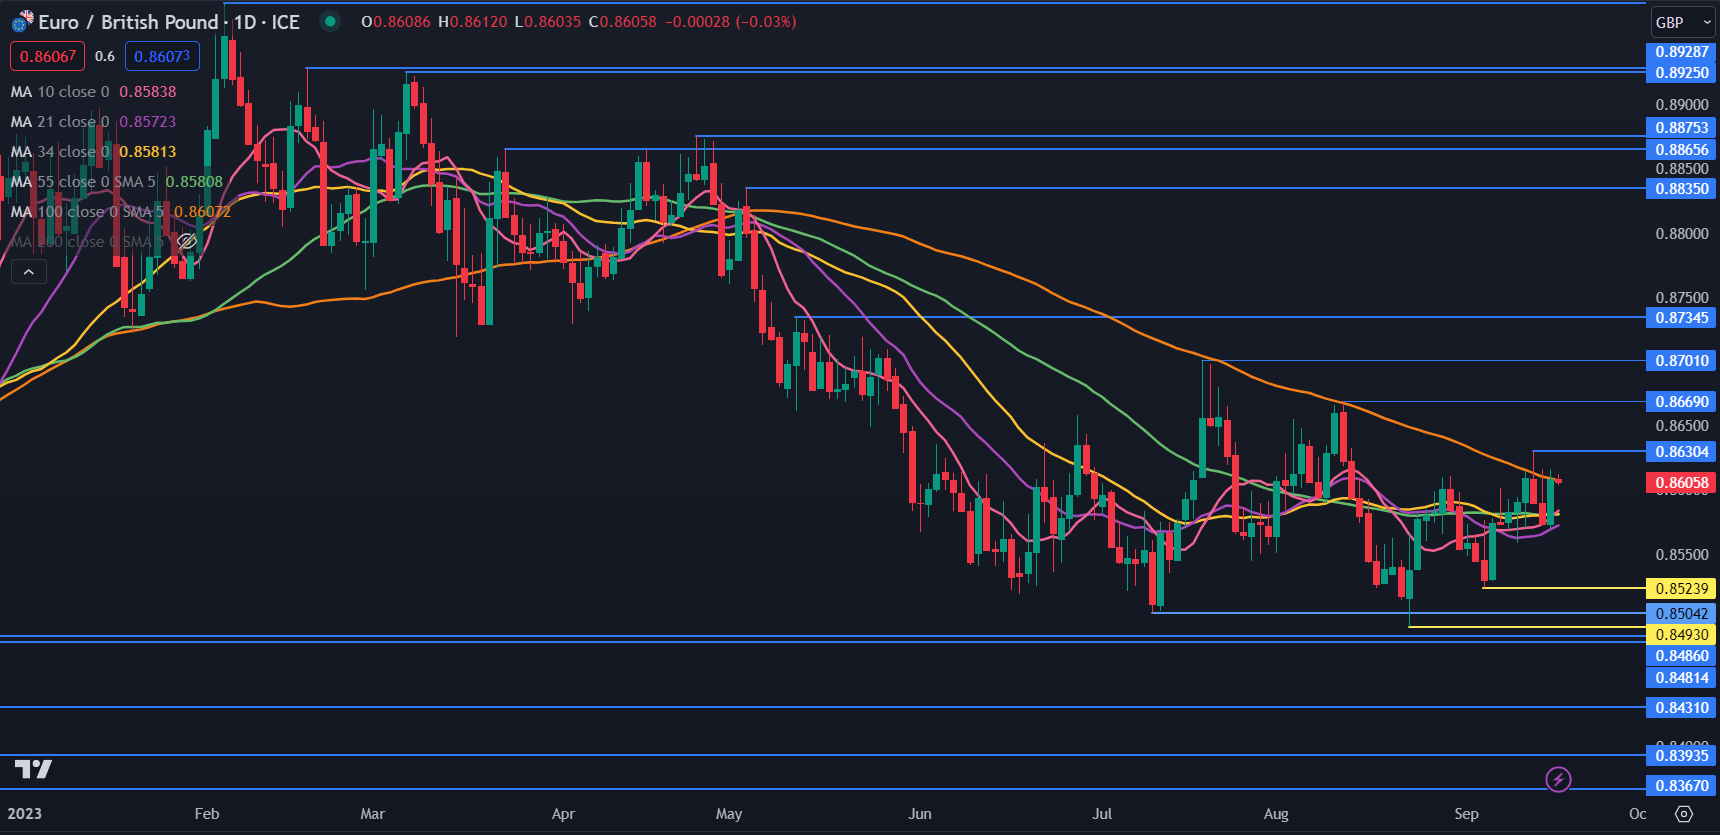
EUR/GBP has traded between 0.8493 and 0.8701 for 4 months in what appears to be a range trading environment.

The 10-, 21-, 34-, 55- and 100-day SMAs are all grouped together between 0.8572 and 0.8607, which may confirm a lack of direction for EUR/GBP.

If the price has a meaningful move away from either side of that range a breakout trade opportunity may evolve. To learn more about breakout trading, click on the banner below.

Support might be at the prior lows and breakpoints of 0.8524, 0.8504, 0.8493, 0.8486 and 0.8481.

On the upside, the 100-day SMA might be pivotal for direction. It was tested on two occasions in July and August and was briefly breached a few times last week before retreating back below it.

A sustained move above it could see bullish momentum evolve.

Further up, resistance might be at the previous peaks at 0.8630, 0.8669, 0.8701 and 0.8735.

EUR/GBP DAILY CHART

image2.png


Asia Day Ahead: Calm before the storm, as STI remains in range, AUD/USD struggles

Asia Day Ahead: Calm before the storm, as STI remains in range, AUD/USD struggles

Major US indices gave back all of last week’s gains on Friday, with volatility triggered by the triple witching day amid the vast options’ expiry (estimated to be $3.4 trillion worth – the largest September expiry on record). The VIX bounced 7.6% off its June 2023 bottom, while mega-cap tech stocks failed to provide any much-needed resilience. Nvidia and Meta were both down 3.7%, alongside Amazon -3% and Microsoft -2.5%.

A further move higher in US Treasury yields may account for some de-risking as well, with yields setting its sight to overcome its year-to-date high ahead of this week’s Federal Open Market Committee (FOMC) meeting. The US two-year yields were back above its 5% level, as market participants continue to adjust their expectations to accommodate for a high-for-longer rate outlook.

Economic data were largely mixed, with US August industrial production holding up better with a 0.4% month-on-month increase versus the 0.1% expected. But more attention seems to revolve around the weaker-than-expected consumer sentiment data (67.7 versus 69.1 consensus), which marked its second straight month of underperformance. The bright spot is that consumers’ inflation expectations continue to moderate, which may provide some room for the Fed to keep rates on hold for now.

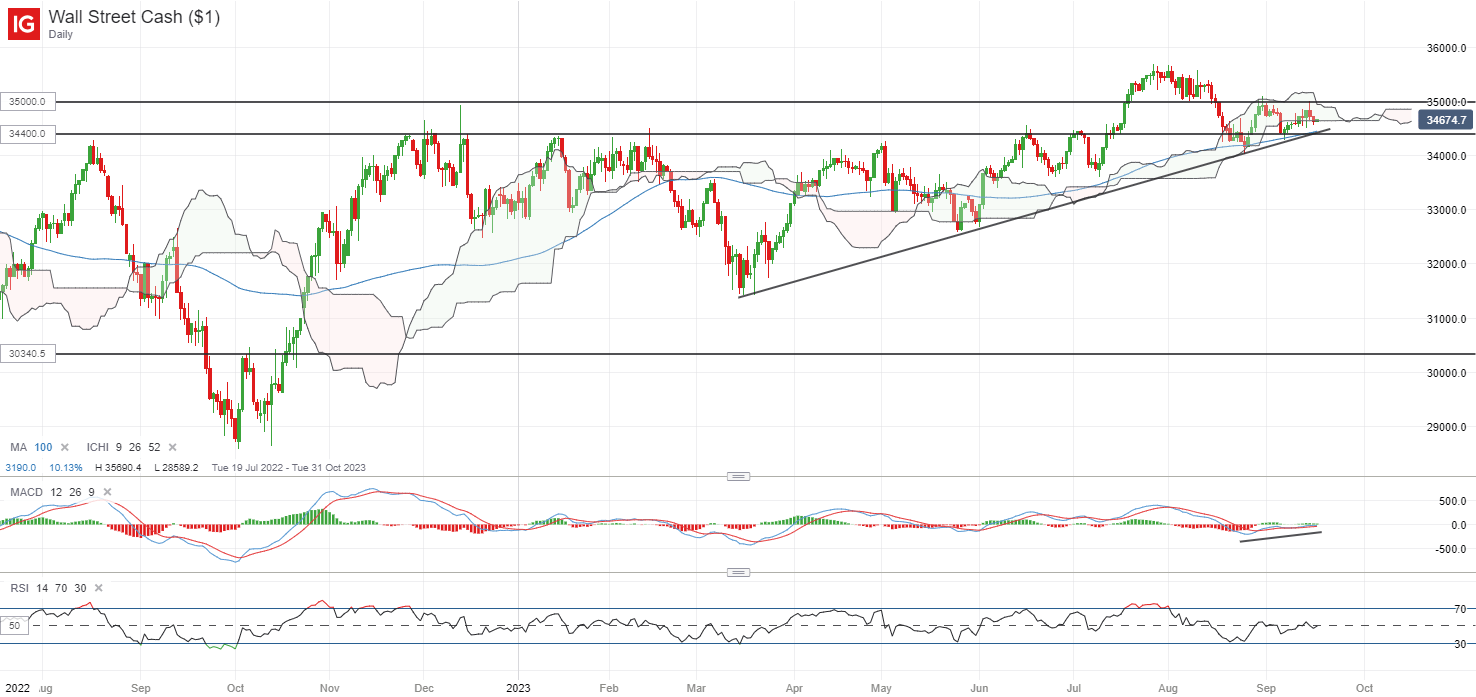
The DJIA has been trading on higher lows since March this year, but are finding some resistance at the key 35,000 level for now. On the downside, an upward trendline support, along with its 100-day moving average (MA) and Ichimoku cloud on the daily chart, will serve as a key support confluence at the 34,400 level – a key level to defend from the bulls. On the other hand, any move above the 35,000 level may pave the way to retest its year-to-date high at the 35,600 level next.

image1.png

Asia Open

Asian stocks look set for a downbeat open, with ASX -0.58%, NZX -0.53% and KOSPI -0.47% at the time of writing. Japan markets are closed for Respect for the Aged Day. Sentiments seem to be treading on some ‘calm before the storm’ in the lead-up to a series of key central bank ‘live’ decisions this week. Chinese economic data has surprised to the upside last week, but that did not trigger much broad-based gains in Chinese equities with investors still finding for more follow-through in its recovery.

On the economic data front, Singapore’s non-oil exports for August turned in its 11th consecutive month of year-on-year contraction this morning, with a significant downside surprise providing testament to the still-weak global demand (-20.1% versus -15.8% forecast). Both the electronics (-21.1%) and non-electronics (-19.9%) segments declined, with double-digit trade moderation among our top trading partners (US -32.4%, EU -28.9%, China -16.4%) likely to suggest subdued growth through the rest of the year.

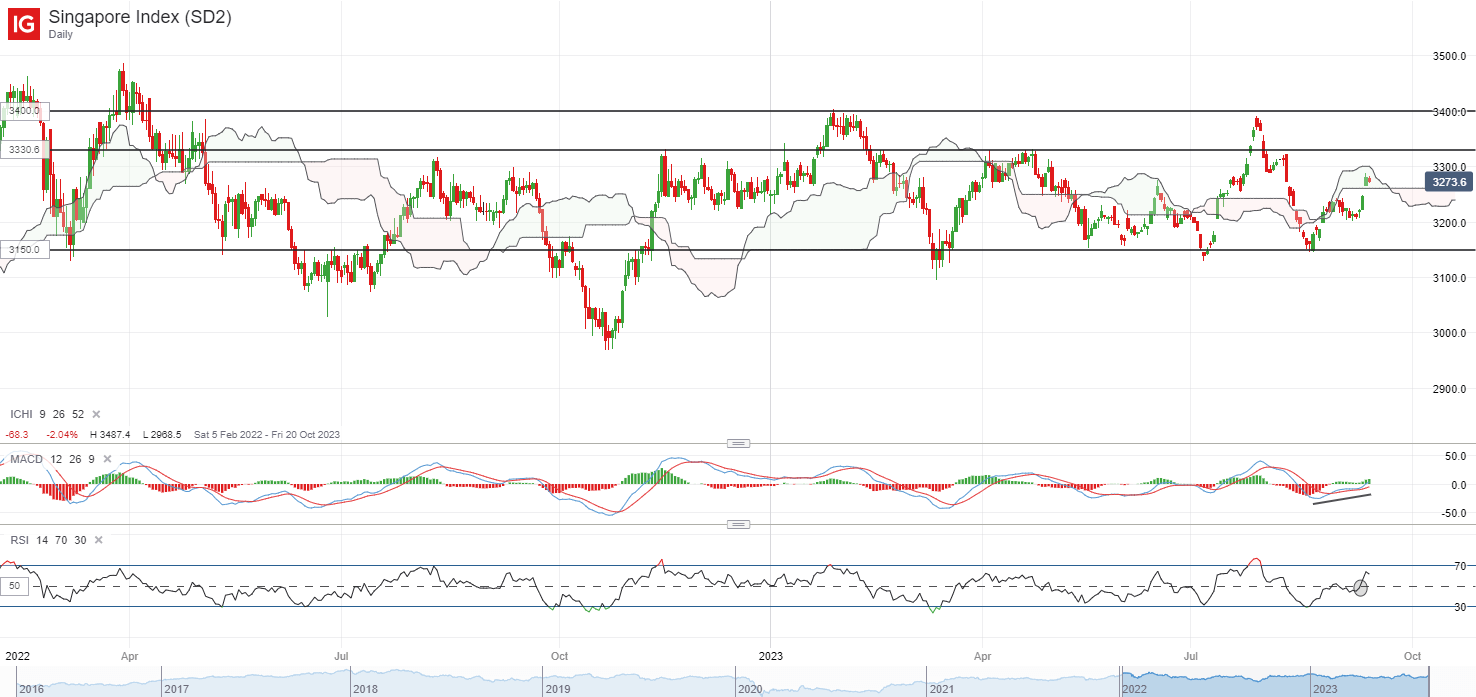
Singapore’s Straits Times Index (STI) has recovered close to 4.4% since its August 2023 bottom, validating a bounce off the lower range of its long-running consolidation pattern. Its relative strength index (RSI) has crossed back above its 50 level for the first time in more than a month, potentially pointing to some near-term upward momentum. The 3,350 level may be on watch next, which marked an immediate resistance to overcome ahead.

image2.png

On the watchlist: Can AUD/USD regain its footing with RBA minutes release tomorrow?

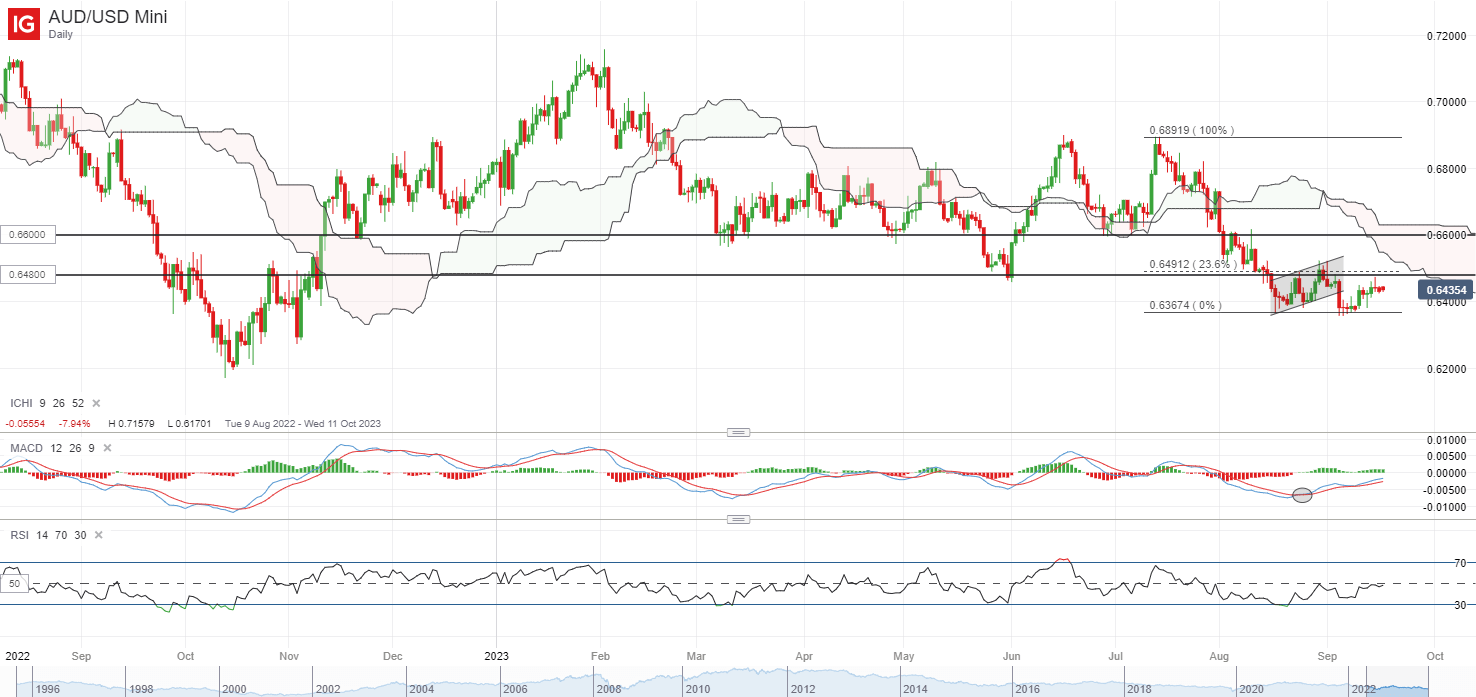
Despite an attempt to bounce off its year-to-date low at the 0.636 level lately, sellers continue to exert some dominance for the AUD/USD, with the formation of a bearish pin bar on the daily chart last Friday rejecting the 0.649 level for now. Its daily RSI is also facing a key test, as it is back to retest its key 50 level, which it has failed to cross above since July this year.

Greater conviction for buyers may have to come from a move above the 0.649 level, which will mark a potential break above its current consolidation pattern. The RBA minutes release will be in focus tomorrow, which will be scrutinised for clues on whether the central bank will extend its rate pause for the fourth straight month ahead. Overcoming the 0.649 level for the AUD/USD may pave the way to retest its next resistance at the 0.660 level.

image3.png