How Will the US Dollar React to Fed Rate Decision Next Week?

How Will the US Dollar React to Fed Rate Decision Next Week?

Market pricing based on the CME FedWatch tool suggests the US Federal Reserve is widely expected to keep the federal funds rate steady at its meeting on September 19-20. Moderating core inflation (notwithstanding the uptick in headline CPI last month), cooling labour market conditions, and stabilizing the housing market argue for a pause.

Meanwhile, Fed Chair Powell is likely to be balanced in his assessment, emphasizing data-dependency with regard to the near-term path of policy. His message could be similar to his message at Jackson Hole last month, where he left the door open for further tightening to cool still-high inflation and above-trend growth.

The bigger question is whether the Fed is done with rate hikes. Recent strong macro data raises the odds of a resurgence in economic activity, raising the risk of renewed price pressures. Hence, while the September rate decision could be a done deal, the November meeting could be a close call. In this regard, next month’s payroll and CPI data will be key before the November 1 FOMC meeting.

The key focus next week will be on the Summary of Economic Projections (SEP) which will be released along with the September FOMC statement. In particular, the 2023 median policy rate could show one more 25 basis-point hike to 5.50%-5.75%, in line with the June assessment. Increased interest would be on whether the 2024 median policy rate forecast is raised from 4.6% projected in June.

From a market perspective, the SEP could be a key driver. Even a 25 basis-point shift higher would still leave roughly 50 basis-points gap with the current dovish 2024 market pricing. Anything greater than that would be perceived to be quite hawkish, triggering a reassessment of the dovish market pricing next year, pushing up USD globally. On the other hand, if 2024 median policy rate projections are unchanged, USD’s rally could take a breather. However, any retreat could be temporary while the US economy outperforms the rest of the world.

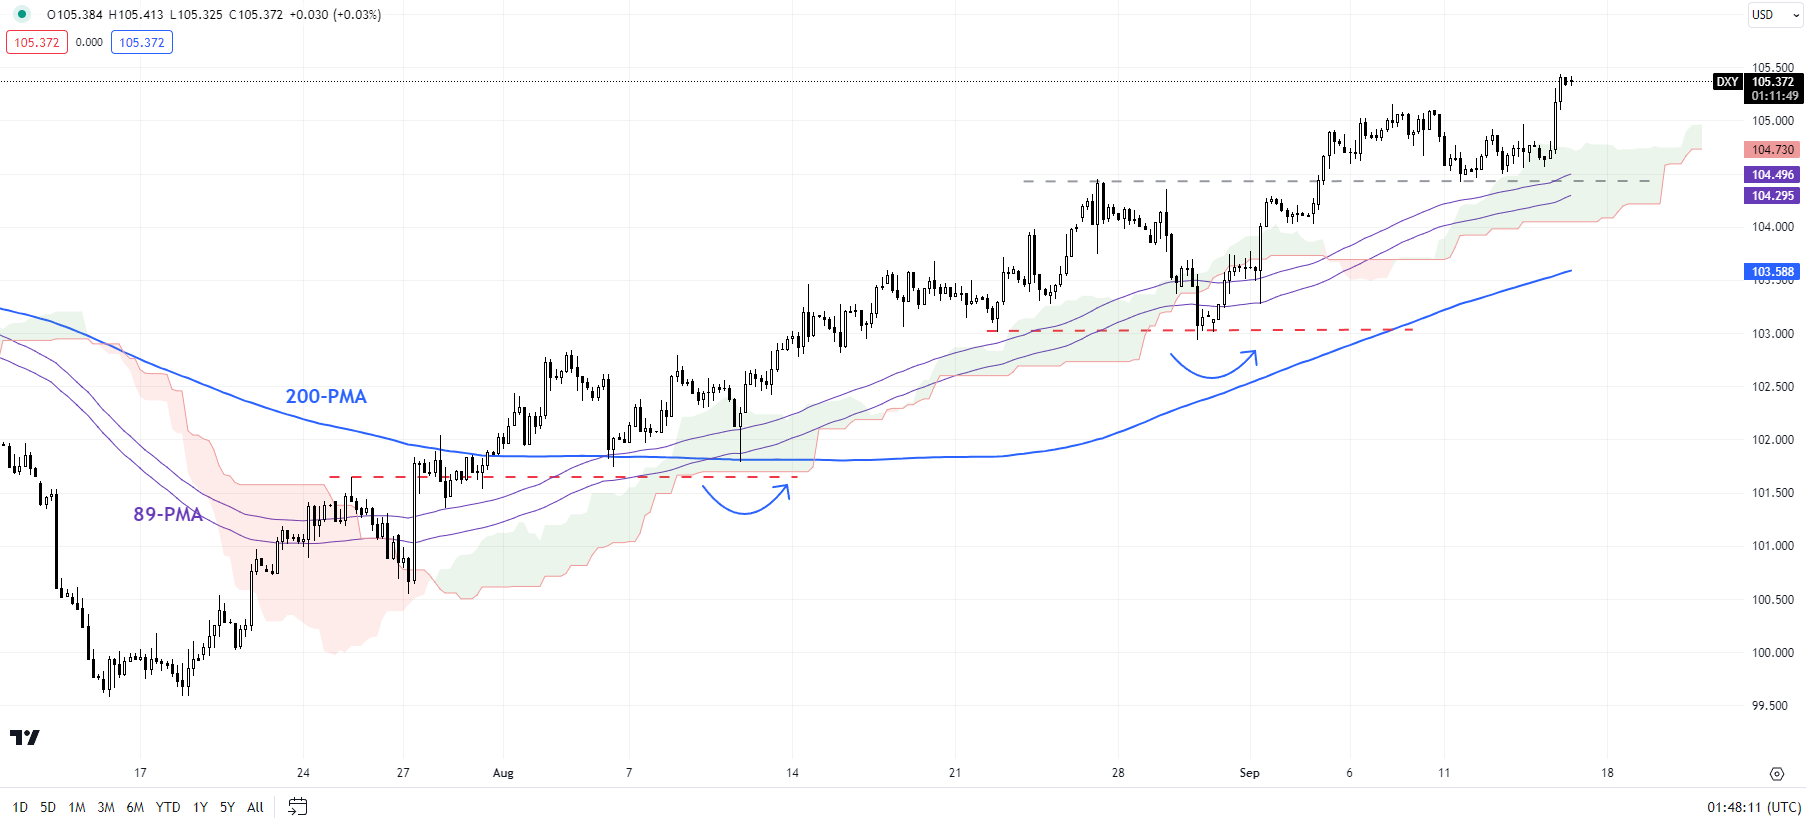
DXY Index (USD) 240-Minute Chart

image1.png

On technical charts, as highlighted in the previous update, the short-term bullish pressure remains intact after the DXY Index (USD index). See “US Dollar Struggles at Resistance Amid Softening Data; EUR/USD, GBP/USD, USD/CAD,” published September 5. The higher-highs-higher-lows sequence from July, associated with breaks above two vital resistance levels on the daily chart reinforces the short-term uptrend.

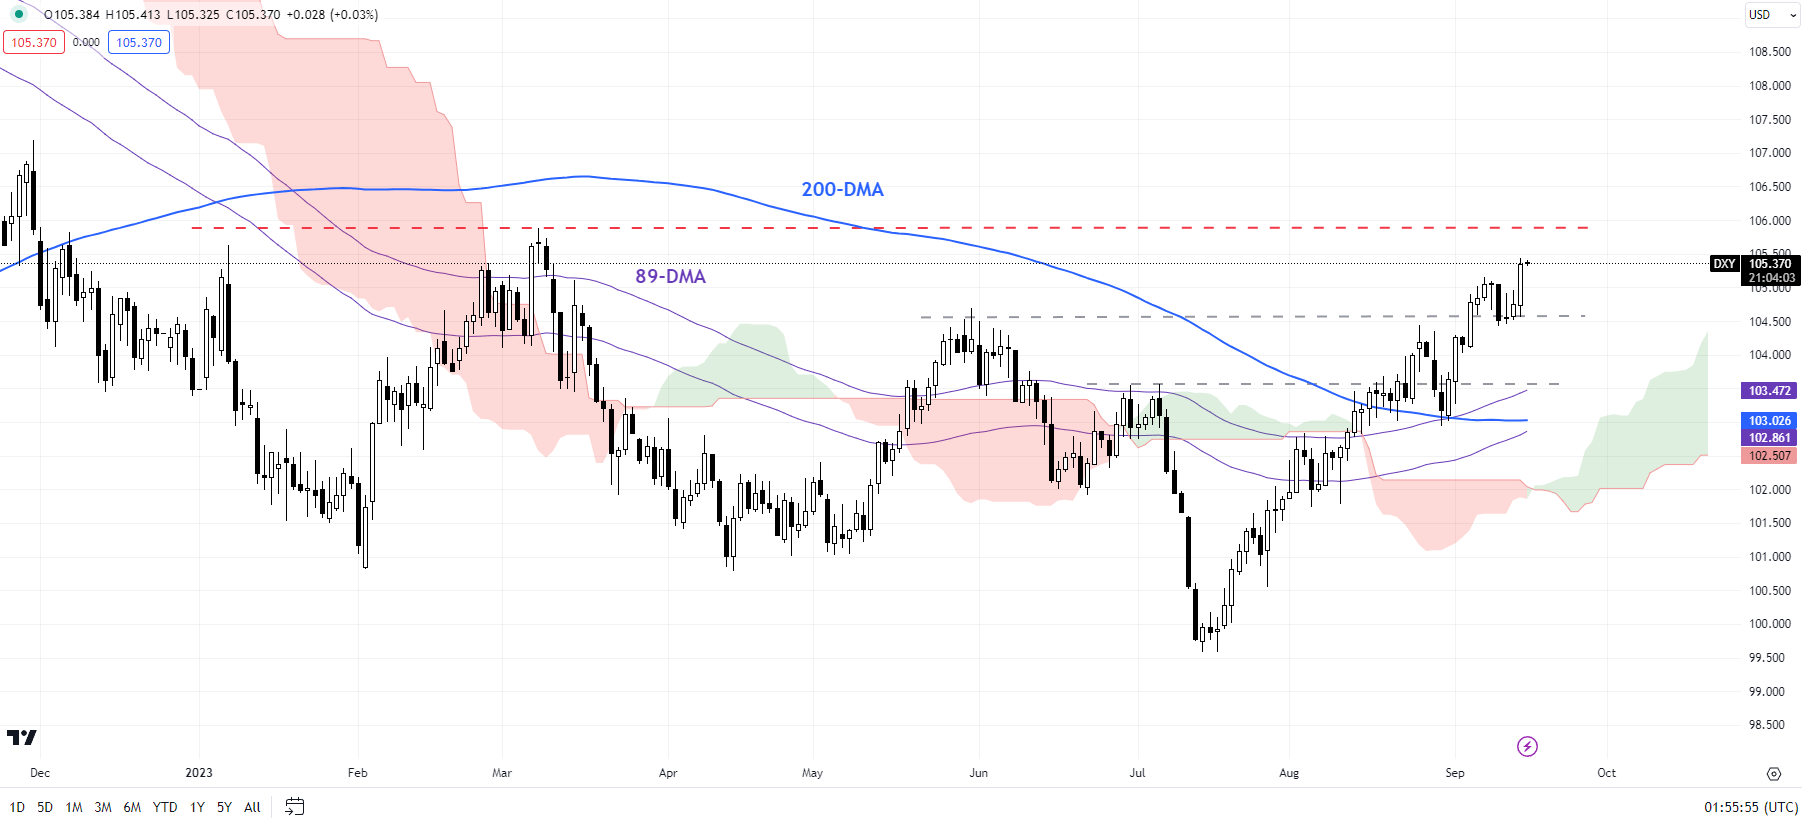
DXY Index (USD) Daily Chart

image2.png

The index is now testing stiff resistance at the March high of around 106.00. While momentum on the daily charts has flattened even as the index has marched higher, suggesting fatigue in the rally, a decisive break above 106.00 would be significantly bullish for the US dollar. On the downside, only a break below the 102.50-103.00 would raise the odds that the DXY Index had peaked.

Exploring Seasonality in Wall Street, Europe, and Asia-Pacific Stock Markets

Exploring Seasonality in Wall Street, Europe, and Asia-Pacific Stock Markets

Have you ever wondered whether or not certain months of the year are consistently better or worse for stock markets? If such a relationship does exist, then we would describe it as seasonal. Seasonality is something you often see in all kinds of data. For example, you can probably guess which months of the year ice cream sales consistently spike or when people repeatedly purchase more winter clothing.

Businesses use seasonality every year to plan their ventures, but can investors do the same with stock markets? If we assume that markets are efficient, reflecting all available information at a given time, then changes in stock prices every day (or in this case every month) should behave as white noise. In other words, we should not be able to predict the future based on past performance because markets are random.

I will put this simplified theory to the test for global stock markets. We will analyze the Dow Jones, S&P 500 and Nasdaq Composite on Wall Street. Then, we will do the same for the DAX 40, FTSE 100 and CAC 40 to gauge European indices. Finally, I will wrap up with a few major benchmark indices from the Asia-Pacific region: the Nikkei 225, ASX 200 and Hang Seng Index.

Each heatmap chart below contains identical parameters:

  1. Average monthly percent change (+2.5 means the index rose 2.5% on average in that month)
  2. Which months are significant (based on a 95% confidence interval from a regression model)
  3. The average goodness of fit between the 3 regression models (1 for each stock index)

These parameters will be discussed in further detail below.

Dow Jones, S&P 500, Nasdaq Composite Monthly Seasonality

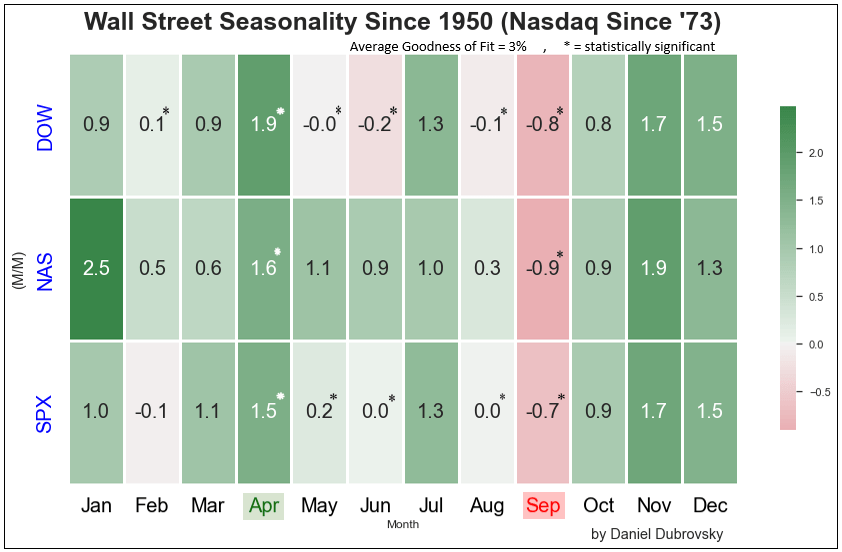
Starting with Wall Street, I have used data on the Dow Jones and S&P 500 since 1950. For the Nasdaq Composite, information since 1973 was used. The most recent month pulled was from December 2022, which applies to all European and Asia-Pacific indices as well. Are there any seasonal effects? Yes!

Historically, it seems that April has been the best month for Wall Street. On average the Dow, S&P and Nasdaq rallied +1.67% in this month. These are also statistically significant. In other words, there is about a 2.6% chance that this +1.67% effect on Wall Street is due to chance within the context of this study.

Meanwhile, September is the only month where all 3 indices have averaged negative and are statistically significant. In this month, the indices averaged -0.8%. I have also highlighted which other months are statistically significant with a “*”. Note that January seems to be a very strong month for the Nasdaq, but it is not significant because, over the years, this month has become progressively weaker.

Finally, and arguably more importantly, notice that the average goodness of fit between the 3 models is 3% (out of a maximum of 100%). What does that mean? On average, about 3% of the variation on Wall Street since the 1950s (‘70s for the Nasdaq) can be explained by seasonality alone (without factoring in any other variables like monetary policy or the unemployment rate).

In other words, while we found meaningful seasonality in April and September, seasonality by itself did a very poor job of explaining how stock markets traded in these months.
Dow Jones, S&P 500, Nasdaq Composite Monthly Seasonality

DAX 40, FTSE 100, CAC 40 Monthly Seasonality

Now let us switch to European indices. It should be noted that the data is not as comprehensive as Wall Street, only going back to 1988. This means that compared to the Dow Jones and S&P 500, we have almost half the number of observations for the DAX 40 (German), FTSE 100 (United Kingdom) and CAC 40 (France).

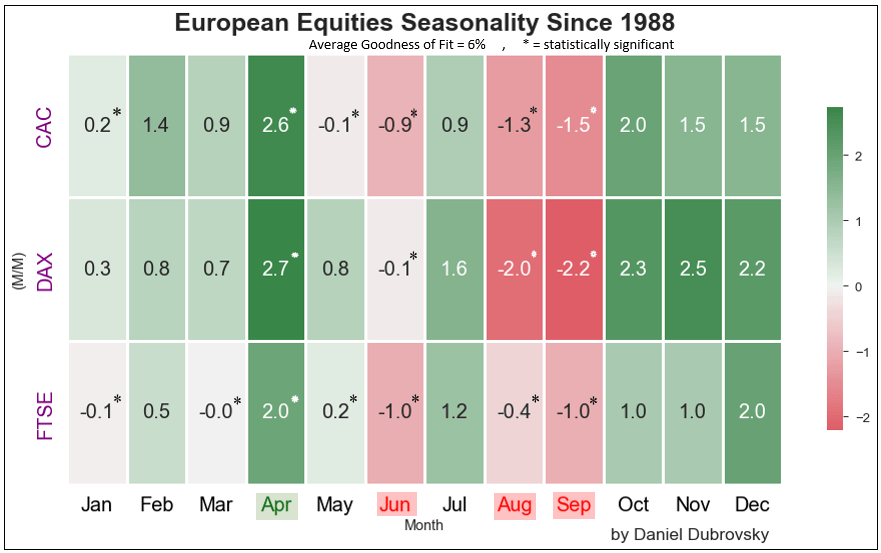
Still, April has consistently been the best month, similarly to Wall Street. In this month, these European indices averaged 2.43%. For all 3 of them, this month is statistically significant.

Meanwhile, June, August and September have consistently been some of the worst months, averaging -0.67%, -1.23% and -1.57%, respectively. These are all statistically significant. As such, it seems you can find more weak months for this corner of global stock exchanges.

Similarly, with Wall Street, the average goodness of fit for seasonality in European indices is quite low at 6%. Once again this means that while we can identify meaningful seasonality, by itself it is not a good indicator of how these markets have performed in April, June, August and September over the years.
DAX 40, FTSE 100, CAC 40 Monthly Seasonality

Nikkei 225, ASX 200, Hang Seng Index Monthly Seasonality

Wrapping up with Asia-Pacific markets, we will be analyzing the Nikkei 225 (Japan) and Hang Seng Index (Hong Kong) since 1971, along with the ASX 200 (Australia) since 1992.

Much like with Wall Street and European indices, April appears to have consistently and significantly been the best month for these APAC stock markets. The Nikkei 225, Hang Seng Index and ASX 200 averaged about 2% over the years.

Meanwhile, August and September have consistently and significantly been the worst periods. During these months, the indices returned -0.7% and -1% on average, respectively.

Like with other markets, the average goodness of fit was approximately 4%. Once again, while we can identify meaningful seasonality, by itself it did not do a good job of explaining how these markets performed in April, August and September over the years.
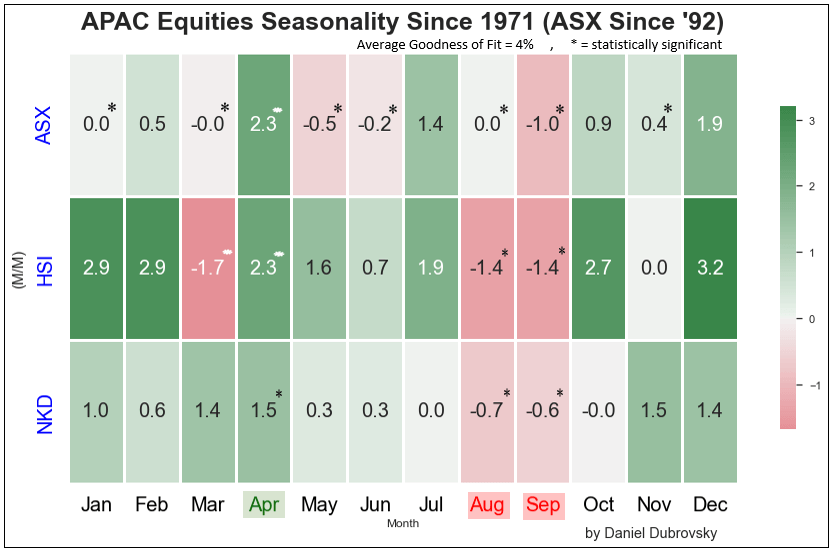
Nikkei 225, ASX 200, Hang Seng Index Monthly Seasonality

Should We Care About Seasonality in Stock Markets?

The takeaways from this deep dive can be split up into 4 key findings:

  1. Statistically significant seasonality is present in global stock markets
  2. April has consistently been the best month between the US, Europe and Asia
  3. September is the only month between all areas that has consistently disappointed
  4. Seasonality by itself has been a poor predictor of performance

For those with a keen eye, you might have noticed that October, November and December have historically been strong months for these global markets. But, as tested with the regression model, for the most part, these months have not been statistically significant.

With that in mind, while we can identify reoccurring patterns in global stock markets, which to a certain extent pours cold water on the “white noise” hypothesis, it probably will not hurt much to brush aside these effects in analyzing stock markets generally.

The CPI and Forex: How CPI Data Affects Currency Prices

The CPI and Forex: How CPI Data Affects Currency Prices

In this article, we’ll explore CPI and forex trading, looking at what traders should know about the Consumer Price Index to make informed decisions. We’ll cover what CPI is as a concept, the CPI release dates, how to interpret CPI, and what to consider when trading forex against CPI data.

What is CPI and why does it matter to forex traders?

The Consumer Price Index, better known by the acronym CPI, is an important economic indicator released on a regular basis by major economies to give a timely glimpse into current growth and inflation levels.

Inflation tracked through CPI looks specifically at purchasing power and the rise of prices of goods and services in an economy, which can be used to influence a nation’s monetary policy.

CPI is calculated by averaging price changes for each item in a predetermined basket of consumer goods, including food, energy, and also services such as medical care.

It is a useful indicator for forex traders due to its aforementioned effect on monetary policy and, in turn, interest rates, which have a direct impact on currency strength. The full utility of knowing how to interpret CPI as a forex trader will be explored below.

CPI release dates

CPI release dates usually occur every month, but in some countries, such as New Zealand and Australia, quarterly. Some nations also offer yearly results, such as Germany’s index. The US Bureau of Labor Statistics has reported the CPI monthly since 1913.

The following table shows a selection of major economies and information about their CPI releases.

Country/jurisdiction Compiling body Frequency of releases
Australia Australian Bureau of Statistics Quarterly
Canada Statistics Canada Monthly
China National Bureau of Statistics of China Monthly
Eurozone European Central Bank Twice monthly
Germany Federal Statistical Office of Germany Monthly, yearly
Italy Istat Monthly
India Ministry for Statistics and Programme Implementation Monthly
Japan Statistics Japan Monthly
UK Monetary Policy Committee Monthly
US US Bureau of Labor Statistics Monthly

Why forex traders should follow CPI data

Understanding CPI data is important to forex traders because it is a strong measure of inflation, which in turn has a significant influence on central bank monetary policy.

So how does CPI affect the economy? Often, higher inflation will translate to higher benchmark interest rates being set by policymakers, to help dampen the economy and subdue the inflationary trend. In turn, the higher a country’s interest rate, the more likely its currency will strengthen. Conversely, countries with lower interest rates often mean weaker currencies.

The release and revision of CPI figures can produce swings in a currency’s value against other currencies, meaning potentially favorable volatility from which skilled traders can benefit.

Also, CPI data is often recognized as a useful gauge of the effectiveness of the economic policy of governments in response to the condition of their domestic economy, a factor that forex traders can consider when assessing the likelihood of currency movements.

The CPI can also be used in conjunction with other indicators, such as the Producer Price Index, for forex traders to get a clearer picture of inflationary pressures.

What to consider when trading forex against CPI data

When using CPI data to influence forex trading decisions, traders should consider the market expectations for inflation and what is likely to happen to the currency if these expectations are met, or if they are missed.

Similar to any major release, it may be beneficial to avoid having an open position immediately before. Traders might consider waiting for several minutes after the release before looking for possible trades, since forex spreads could widen significantly right before and after the report.

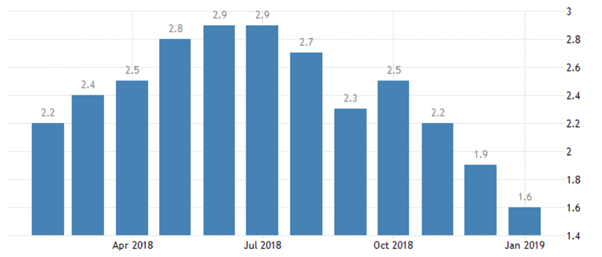
Below is a chart displaying the monthly inflation rates for the US. For the latest month, expectations are set at 1.6% inflation compared to last year’s data. If CPI is released higher or lower than expectations this news event does have the ability to influence the market.

Chart to show US inflation levels in 2018/19. Source: TradingEconomics.com. US Bureau of Labor Statistics

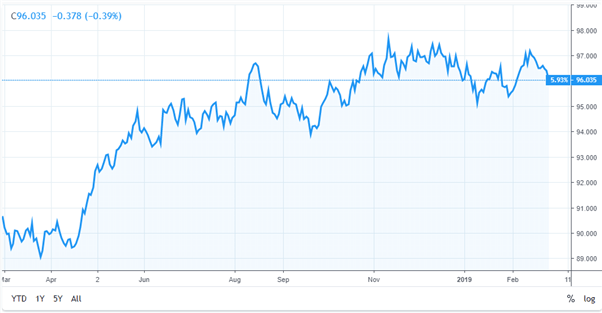
One way the effects of CPI data can be interpreted is by monitoring the US Dollar Index, a 2018/19 example chart for which is below. If CPI is released away from expectations, it is reasonable to believe this may be the catalyst to drive the Index to fresh highs, or to rebound from resistance.

Since the Index is comprised of EUR/USD, USD/JPY, and GBP/USD, by watching the US Dollar we can get a full interpretation of the events outcome.

As can be observed in the example above, as inflation rose during the first half of 2018, the US Dollar Index went up accordingly. But with US inflation drifting lower in the following months and with a missed target of 2%, this pushed US interest rate hikes off the agenda. As a result, the dollar struggled and weakened against a basket of other currencies.

Not every fundamental news release works out through price as expected.

Once the CPI data has been released and analyzed, traders should then look to see if the market price is moving through or rebounding off any areas of technical importance. This will help traders understand the short-term strength of the move and/or the strength of technical support or resistance levels, and help them make more informed trading decisions.

Read more on CPI, inflation and forex

Make sure you bookmark our economic calendar to stay tuned in to the latest CPI data released by a range of countries, and stay abreast of all the DailyFX news and analysis updates. Also, reserve your place at our Central Bank Weekly webinar series to learn about news events, market reactions, and macro trends.

For more information on inflation and its impact on forex decisions, take a look at our article Understanding Inflation for Currency Trading.

AUD Price Forecast: Chinese Data Provides Much Needed Reprieve for Aussie Dollar

AUD Price Forecast: Chinese Data Provides Much Needed Reprieve for Aussie Dollar

AUSTRALIAN DOLLAR FUNDAMENTAL BACKDROP

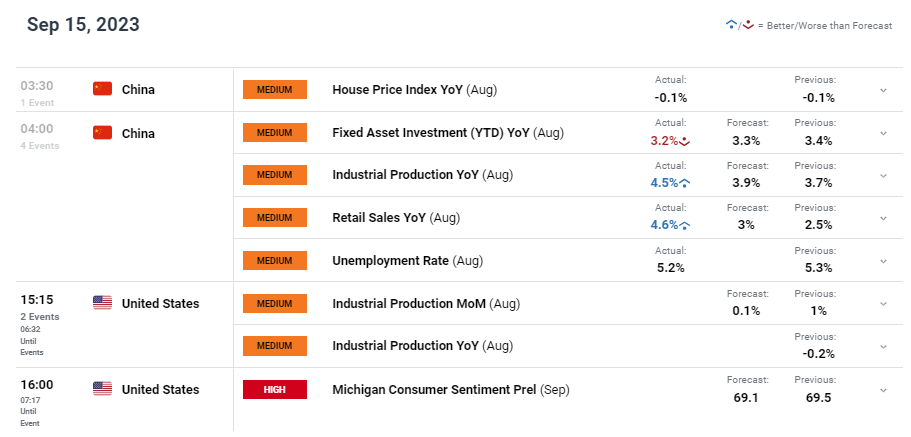
The Australian dollar is tentatively pushing higher this morning after being depressed for some time. Chinese economic data (see economic calendar below) bolstered the ‘pro-growth’ currency as industrial production and retail sales surprised to the upside. A welcome statistic for Chinese officials considering recent data has suggested weak economic growth leaving closely linked currencies like the AUD weakened.

Although the US dollar is trading marginally lower today, yesterday’s robust US data should reinforce the ‘higher for longer’ message. Today’s industrial production and Michigan consumer sentiment are expected to soften that could allow for the AUD to hold on to its gains heading into next week. Some key risk events to look out for next week include RBA meeting minutes, US building permits report, Fed interest rate decision and Australian PMI’s.

AUD/USD ECONOMIC CALENDAR (GMT +02:00)

image1.png

On a side note, RBA Governor Philip Lowe handed over the reigns to his Deputy Michele Bullock who will commence the role of Governor next week Monday. This had little impact on the currency showing markets confidence in the new RBA leader.

TECHNICAL ANALYSIS

AUD/USD DAILY CHART

image2.png

Chart prepared by Warren Venketas, TradingView

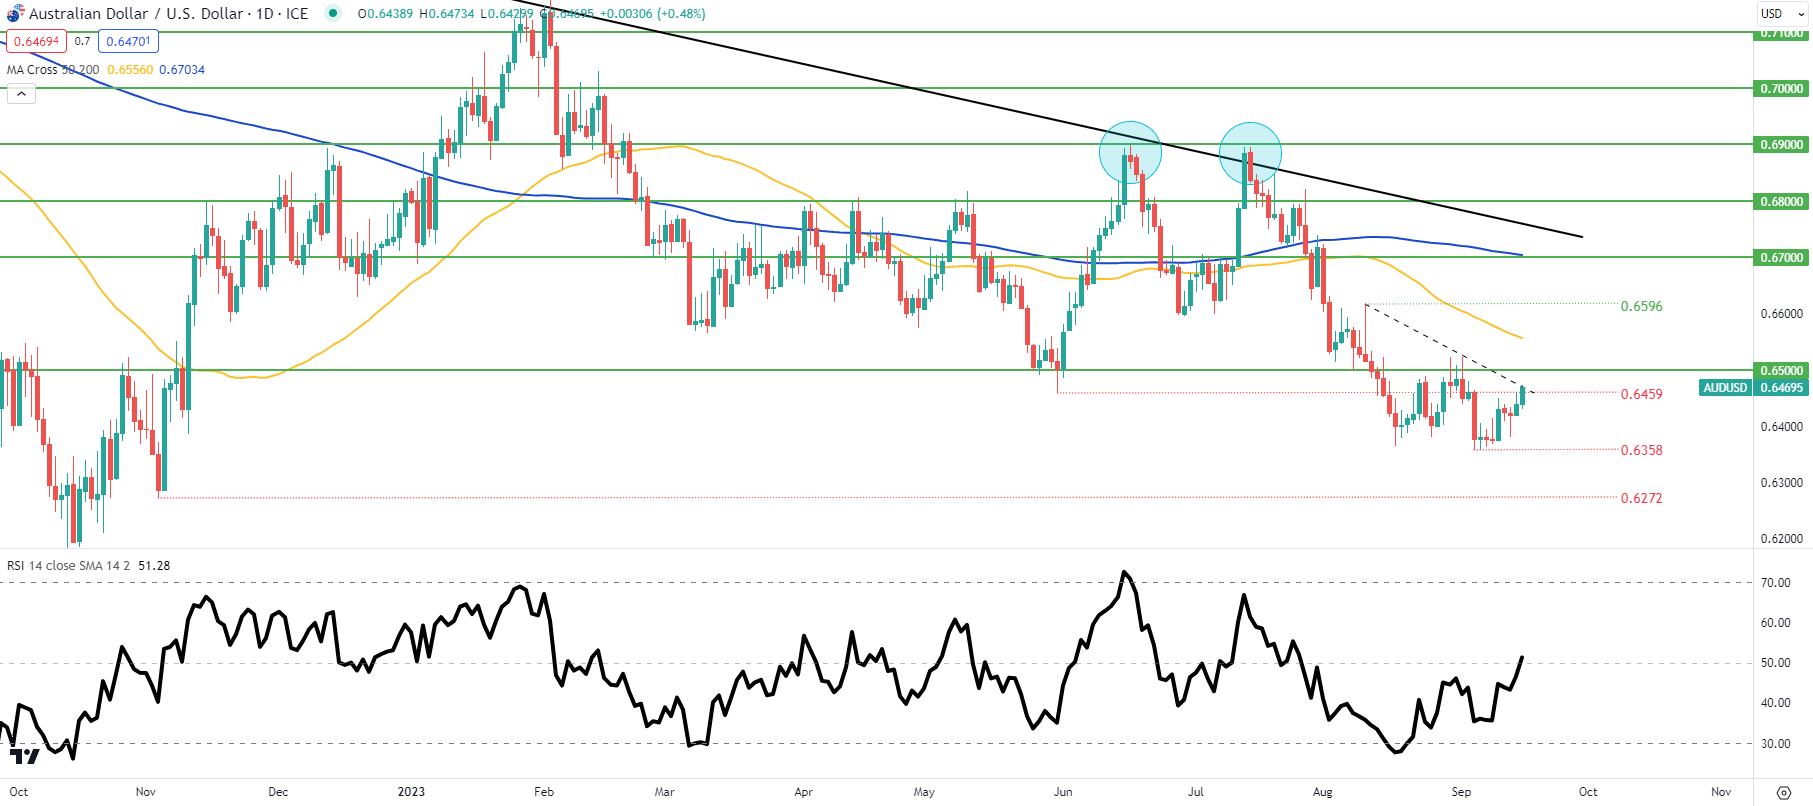
Daily AUD/USD price action looks to test the short-term trendline resistance (dashed black line) that coincides with the 0.6459 swing level. A confirmed break above this zone could see a retest of the 0.6500 psychological handle but the pair remains firmly within a bearish trend. Next week’s Fed rate announcement could provide the catalyst to short-term directional bias; whereby a hawkish slant may keep the pair subdued and vice versa.

Natural Gas Storage Build Exceeds Estimates

Natural Gas Storage Build Exceeds Estimates

On September 14, EIA released its Weekly Natural Gas Storage Report, which indicated that working gas in storage increased by 57 Bcf from the previous week.

Analysts expected that working gas in storage would grow by 48 Bcf, so the report exceeded expectations.

At current levels, stocks are 445 Bcf higher than last year at this time and 203 Bcf above the five-year average of 3002 Bcf.

The current demand for natural gas is low, and the recent changes in weather forecasts were bearish. However, natural gas made an attempt to gain upside momentum today as traders focused on the strike action at Chevron’s LNG projects in Australia, which could have a material impact on global LNG markets.

While traders’ mood has been rather bullish, the disappointing EIA report may put material pressure on natural gas prices, which have already moved lower after the release of the report.

Stocks are building faster than expected while demand is projected to be low in the second half of the month, so it remains to be seen whether natural gas will find enough catalysts to push natural gas prices above the strong resistance in the $2.80 – $2.85 range.

Oil Prices Forecast: Brent, WTI Futures Boosted by Supply Shortfalls

Oil Prices Forecast: Brent, WTI Futures Boosted by Supply Shortfalls

Oil Prices Rally Amidst Supply Tightness

Oil markets are edging higher on Thursday, rebounding as investors refocused on the looming tightness in crude supply for the remainder of 2023, coupled with robust demand anticipated well into the following year.

Supply Constraints and Price Surge

Spot Brent crude surged by 16 cents to reach $92.65 a barrel, and Spot West Texas Intermediate crude (WTI) climbed 32 cents, landing at $89.13. These gains come on the back of mounting concerns regarding supply shortfalls, driven by producers maintaining stringent production cuts. Saudi Arabia and Russia’s recent commitment to extend output reductions until the close of 2023 has led the International Energy Agency (IEA) to predict a substantial market deficit in the fourth quarter. The IEA largely upheld its demand growth estimates for this year and the next. However, failing to implement cuts at the start of 2024 could tip the scales toward surplus, albeit with uncomfortably low stock levels.

Trading Derivatives carries a high level of risk to your capital and you should only trade with money you can afford to lose. Trading Derivatives may not be suitable for all investors, so please ensure that you fully understand the risks involved, and seek independent advice if necessary. A Product Disclosure Statement (PDS) can be obtained either from this website or on request from our offices and should be considered before entering into a transaction with us. Raw Spread accounts offer spreads from 0.0 pips with a commission charge of USD $3.50 per 100k traded. Standard account offer spreads from 1 pips with no additional commission charges. Spreads on CFD indices start at 0.4 points. The information on this site is not directed at residents in any country or jurisdiction where such distribution or use would be contrary to local law or regulation.

OPEC’s Optimism and Near-Term Outlook

Meanwhile, the Organization of the Petroleum Exporting Countries (OPEC) continues to project robust growth in global oil demand for 2023 and 2024. The oil market appears tightly balanced for the next two to three quarters, owing to persistent supply constraints amidst sustained demand. Geopolitical risks and economic uncertainties are expected to drive Saudi Arabia’s decision to maintain production cuts into the first quarter of 2024.

Volatility Fueled by Inventories Boost

Both Brent and WTI benchmarks achieved 10-month highs on Wednesday, but sentiment took a hit after a surprise increase in U.S. crude and fuel inventories raised concerns about demand. U.S. crude inventories unexpectedly rose by 4 million barrels last week, defying analyst expectations of a 1.9 million-barrel drop. Simultaneously, fuel inventories exceeded forecasts due to increased refining activity.

Economic Factors at Play

On the economic front, the latest U.S. inflation figures have strengthened expectations that the Federal Reserve will hold off on raising interest rates in the near term. This decision could further boost hopes of sustained oil demand. Higher interest rates typically increase borrowing costs, potentially dampening economic growth and reducing oil consumption.

Short-Term Outlook

In conclusion, oil markets are currently characterized by tight supply conditions and persistent demand, buoyed by producer commitments to output cuts. However, near-term market volatility is a possibility due to unforeseen supply and demand fluctuations, as demonstrated by the recent unexpected increase in U.S. crude inventories. Traders and investors will closely monitor geopolitical developments and economic indicators for clues about the future direction of oil prices.

Technical Analysis

4-Hour Light Crude Oil FuturesThe current 4-hour price for Light Crude Oil Futures stands at 89.06, slightly higher than the 50-4H moving average of 87.27 and significantly above the 200-4H moving average of 82.82, suggesting an overall bullish trend. The 14-4H RSI reading of 63.43 indicates healthy momentum, leaning towards the overbought territory but not excessively.

The main support lies between 84.89 to 83.81, while the main resistance ranges from 90.10 to 93.74. Minor levels are absent. Considering these factors, the market sentiment appears bullish, with strong potential for further upside movement.

DAX Index: Economic Woes and ECB Rate Hike Rumors – How Dax Stocks React

DAX Index: Economic Woes and ECB Rate Hike Rumors – How Dax Stocks React

ECB and Fed Uncertainty Leave the DAX on the Back Foot

Eurozone industrial production slid by 1.1% in July versus a 0.4% increase in June. Economists forecast a 0.7% decline. The latest report from the euro area provided more evidence of a euro area-wide recession.

Trading Derivatives carries a high level of risk to your capital and you should only trade with money you can afford to lose. Trading Derivatives may not be suitable for all investors, so please ensure that you fully understand the risks involved, and seek independent advice if necessary. A Product Disclosure Statement (PDS) can be obtained either from this website or on request from our offices and should be considered before entering into a transaction with us. Raw Spread accounts offer spreads from 0.0 pips with a commission charge of USD $3.50 per 100k traded. Standard account offer spreads from 1 pips with no additional commission charges. Spreads on CFD indices start at 0.4 points. The information on this site is not directed at residents in any country or jurisdiction where such distribution or use would be contrary to local law or regulation.

Market uncertainty toward the ECB monetary policy decision added to the gloomy sentiment. The chances of a 25-basis point ECB rate hike increased from 40% to 64% on Wednesday. Rising bets came despite the European Commission forecasting the German economy will contract by 0.4% in 2023.

CPI Report Cements September Fed Pause

The US CPI Report eased investor fears of further rate hikes to tame inflation. A softer US core annual inflation rate was enough for the markets, with the DAX recovering from heavier losses.

According to the CME FedWatch Tool, the probability of a Fed pause in September rose from 92% to 97% in response to the CPI Report. Significantly, investors were less divided over the November interest rate decision. The chance of a 25-basis point Fed rate hike fell from 41.1% to 38.9%.

The Wednesday Market Movers

Bayer was the worst performer, falling 4.63% in response to JPMorgan (JPM) placing the stock on a negative catalyst watch.

Bank stocks cushioned the downside, with Deutsche Bank and Commerzbank seeing gains of 2.85% and 1.12%, respectively.

However, Siemens Energy AG was also among the front runners, gaining 1.27%. News of the EU planning on rolling out measures to support the wind power industry drove buyer demand.

Auto stocks gave up early gains from news of the EU planning to investigate subsidies given to EV manufacturers in China. BMW and Volkswagen rose by 0.75% and 0.06%, respectively. However, Continental slid by 0.74%, with Porsche and Mercedes Benz Group seeing losses of 0.10% and 0.09%, respectively.

Today’s Session

The European Central Bank (ECB) will deliver its monetary policy decision. Economists predict the ECB will leave interest and deposit facility rates unchanged at 4.25% and 3.75%, respectively.

However, rising bets on an ECB rate hike will test buyer appetite. Rumors of an upward revision to inflation forecasts fueled bets on an ECB hike despite economic woes across the euro area.

An ECB hold on rates would shift the market focus to the ECB Press Conference. While investors would feel relief from a pause, a hawkish policy outlook and grim economic and inflation forecasts would pressure stocks.

The DAX Futures was up 29 points this morning.

US Jobs, Inflation, and Consumption in the Spotlight

US jobless claims, retail sales, and producer prices will be in focus today. A jump in retail sales and hotter-than-expected producer prices could test the Fed pause theory. An unexpected rise in bets on a Fed rate hike and a hawkish ECB would pressure stocks.

Economists forecast a 0.2% (July: +0.7%) increase in retail sales and a 0.4% (July: +0.3%) rise in producer prices in August. However, labor market conditions must remain tight to support hawkish bets. Economists forecast initial jobless claims to rise from 216k to 225k.

Short-Term Forecast

Downside risks linger, with the prospect of a euro area recession and hawkish ECB bearish for stocks. However, easing bets on further Fed rate hikes would cushion the blow. For the Thursday session, we expect the ECB outlook on inflation, the economy, and interest rates to be the key driver.

DAX Technical Indicators

Daily Chart

On Wednesday, the trend line rejected a DAX move toward the 50-day EMA and 16,007 resistance level for a second session. However, the DAX broke below the 15,663 support level (now the resistance level) on rising bets on an ECB rate hike.

A break above the 15,663 resistance level and a move toward the trend line hinges on the ECB policy decision and press conference. A dovish pause should offer market relief. However, a rate hike would bring the 15,459 support level and 200-day EMA into play. Buying pressure will build at 15,450, with the 200-day EMA confluent with the 15,459 support level.

The 14-Daily RSI reading of 41.69 signals the DAX can target the 15,459 support level before hitting oversold territory.

DAX Daily Chart sends bearish near-term price signals.
DAX 140923 Daily Chart

4-Hourly Chart

The DAX sits below the 50-day and 200-day EMAs, affirming bearish price signals. If the DAX breaks above the 15,663 resistance level, it could approach the trend line and 50-day EMA. However, the ECB would need to hit pause and deliver a neutral stance press conference to drive buyer demand.

Failure to break above the 15,663 resistance level would leave sub-15,500 and the 15,459 support level in play.

The 41.30 RSI reading indicates the DAX can fall to sub-15,500 before entering oversold territory.

4-Hourly Chart affirms bearish price signals.
DAX 140923 4-Hourly Chart
EUR/USD Prices Forecast: Flat Ahead of ECB Decision to Hike or Pause

EUR/USD Prices Forecast: Flat Ahead of ECB Decision to Hike or Pause

Euro Holds Steady Ahead of ECB Decision

EUR/USD traders are keeping a close watch on the European Central Bank’s (ECB) impending monetary policy statement and interest rate decision on Thursday, with the Euro trading nearly flat against the U.S. Dollar. This comes as uncertainty prevails regarding whether the ECB will raise rates amidst growing concerns about inflation. The U.S. inflation data released on Wednesday failed to sway expectations of a Federal Reserve pause next week.

Early Cautious Stance

As of 09:00 GMT, the EUR/USD pair is trading at 1.0734, marking a slight increase of 0.04% or 0.004 points. The Euro has managed to recover marginally from a three-month low against the Dollar. However, it remains in a cautious stance as traders await the ECB’s decision, with the looming meeting acting as a cap on significant moves.

Trading Derivatives carries a high level of risk to your capital and you should only trade with money you can afford to lose. Trading Derivatives may not be suitable for all investors, so please ensure that you fully understand the risks involved, and seek independent advice if necessary. A Product Disclosure Statement (PDS) can be obtained either from this website or on request from our offices and should be considered before entering into a transaction with us. Raw Spread accounts offer spreads from 0.0 pips with a commission charge of USD $3.50 per 100k traded. Standard account offer spreads from 1 pips with no additional commission charges. Spreads on CFD indices start at 0.4 points. The information on this site is not directed at residents in any country or jurisdiction where such distribution or use would be contrary to local law or regulation.

ECB Dilemma: Hike or Pause?

Market expectations for the ECB’s meeting are divided between a rate pause and a 25 basis point rate increase. Notably, there’s a leaning towards a hike, partly driven by reports suggesting that the ECB expects inflation to stay above 3% next year, exceeding the 2% target.

Euro’s Fate Tied to ECB’s Inflation View

The Euro’s future trajectory hinges on the ECB’s updated economic forecasts, especially regarding inflation. The central bank faces a tough decision as it grapples with persistent high inflation, currently above 5%, against a backdrop of slowing economic growth.

A Last Hike or a Pause?

Analysts and investors had anticipated a rate pause, but the mood has shifted due to the prospect of higher inflation in the ECB’s forecasts. Currently, money markets assign a 63% probability of a rate hike, which would be the last in a cycle initiated in July 2022.

Risks and Economic Impact

The brisk tightening cycle undertaken by the ECB has started affecting the Eurozone economy, particularly in manufacturing and lending to businesses and households. Germany, the largest Eurozone economy, is showing signs of heading into recession. The ECB is also expected to lower its growth projections, raising concerns about the need for further tightening.

Short-Term Outlook

In summary, the Euro maintains a cautious stance as traders await the ECB’s rate decision, which could either mark the end of a tightening cycle or continue it amidst inflationary pressures. Economic uncertainties persist, with implications for both the Euro and the Eurozone’s economic outlook.

Technical Analysis

4-Hour EUR/USDThe EUR/USD market currently stands at 1.0732, slightly below the 4-hour close of 1.0734. The 200-4H moving average is 1.0865, indicating the price is below this long-term average. The 50-4H moving average at 1.0736 aligns closely with the current price. The 14-4H RSI reading of 47.97 suggests neutral momentum.

Major support rests at 1.0671 to 1.0638, with the main resistance at 1.0766 to 1.0772. Overall, the market sentiment appears neutral, with price proximity to key moving averages and RSI near 50, suggesting indecision. Further analysis is advised for a clearer trend. Traders expect more clarity after the release of the ECB statements. Bullish news could trigger a breakout over 1.0772.

Silver Prices Forecast: XAG/USD Faces Bearish Trend Amid Rate Uncertainty

Silver Prices Forecast: XAG/USD Faces Bearish Trend Amid Rate Uncertainty

Silver (XAG/USD) Prices Near One-Month Lows Amidst Dollar Strength and Fed Rate Pause Expectations

Silver (XAG/USD) prices are facing downward pressure as they approach one-month lows. This decline is primarily attributed to the strengthening U.S. dollar and the growing likelihood of a Federal Reserve rate pause. The recently released U.S. inflation data, although mixed, has solidified expectations of the Fed maintaining interest rates next week. This has diminished the attractiveness of non-interest-bearing assets like Silver in the eyes of investors.

While U.S. consumer prices surged in August, driven by soaring gasoline costs, the annual increase in underlying inflation was the smallest in nearly two years. This discrepancy has created uncertainty regarding the Fed’s rate trajectory for 2024.

Trading Derivatives carries a high level of risk to your capital and you should only trade with money you can afford to lose. Trading Derivatives may not be suitable for all investors, so please ensure that you fully understand the risks involved, and seek independent advice if necessary. A Product Disclosure Statement (PDS) can be obtained either from this website or on request from our offices and should be considered before entering into a transaction with us. Raw Spread accounts offer spreads from 0.0 pips with a commission charge of USD $3.50 per 100k traded. Standard account offer spreads from 1 pips with no additional commission charges. Spreads on CFD indices start at 0.4 points. The information on this site is not directed at residents in any country or jurisdiction where such distribution or use would be contrary to local law or regulation.

Traders Expect Unchanged Rates This Week with a Possibility of a Rate Hike in November

Market sentiment currently suggests a 97% probability that the Fed will keep interest rates unchanged in the upcoming week. However, there is a 40% chance of a rate hike in November, according to the CME’s FedWatch Tool. Simultaneously, the European Central Bank is considering raising its key interest rate. The decline in holdings of the SPDR Gold Trust by 0.3% further underscores weakening demand for gold and silver.

Impact of a Stronger Dollar and Fed’s Intent to Maintain Rates

The stronger U.S. dollar, reinforced by the inflation data, has made Silver relatively more expensive for investors holding other currencies. While the Consumer Price Index (CPI) figures largely met expectations, they imply that the Federal Open Market Committee (FOMC) is inclined to keep interest rates steady.

This expectation has provided a temporary support level for Silver. As the outlook for the Fed points towards maintaining rates both in September and potentially in November (with a 60% likelihood), investors are increasingly drawn to higher-yielding assets such as U.S. Treasury bonds, diverting their attention away from zero-interest Silver.

Shifting Investor Concerns from Inflation to Opportunity Costs

Investors are now primarily concerned about the opportunity costs associated with holding Silver in an environment of rising interest rates. The focus is shifting from inflation worries to the implications of keeping a non-interest-bearing asset like Silver amidst increasing interest rates.

All eyes are now on forthcoming economic data, including U.S. August producer prices and retail sales figures, along with the European Central Bank’s interest rate decision. These events precede the highly anticipated Fed policy announcement scheduled for September 20.

Bearish Pressure on Silver Due to Strong Dollar, Expected Fed Rate Pause, and Reduced Demand

In summary, Silver is currently facing bearish pressure driven by multiple factors, including the strength of the U.S. dollar, the prospect of a Federal Reserve rate pause, and a decline in demand as indicated by the reduced holdings of the SPDR Gold Trust. These combined factors challenge the appeal of Silver as a non-interest-bearing asset in an environment where interest rates are on the rise.

Technical Analysis

4-Hour Silver (XAG/USD)Spot Silver (XAG/USD) currently trades at $22.53, below the 200-4H moving average of $23.47 and 50-4H moving average of $23.23, indicating a bearish trend. The 14-4H RSI at 27.59 signals an oversold condition, reflecting weakened momentum.

The main support area lies between $22.70 and $22.28, while the main resistance zone ranges from $25.00 to $25.27. Presently, the price is inside the support zone but below resistance levels. This analysis suggests a bearish sentiment in the market. Traders should exercise caution, monitoring for potential reversals due to the oversold conditions.

US Stock Futures Rise Ahead of PPI Release

US Stock Futures Rise Ahead of PPI Release

US Stock Futures Rise Ahead of PPI Release

US stock futures climbed Thursday morning, with futures tied to the Dow Jones Industrial Average advancing by 77 points or 0.22%. This movement came in anticipation of the August producer price index (PPI), a crucial measure of wholesale inflation. Meanwhile, S&P 500 futures and Nasdaq 100 futures also saw modest increases, by 0.32% and 0.35%, respectively. This is despite the 30-stock Dow losing 0.2% during Wednesday’s session, primarily due to a decline in 3M shares. However, both the Nasdaq Composite and the S&P 500 managed to close in the green, up by nearly 0.3% and 0.1% respectively.

Impact of Recent CPI Readings on the Market

The August reading of the consumer price index (CPI) held immense significance for traders. The core CPI, which strips out food and energy, rose 0.3% from July and 4.3% YoY. These figures somewhat exceeded economists’ expectations, leading to heightened market speculations. The data fueled uncertainty regarding the Federal Reserve’s upcoming monetary decisions. The central bank’s stance on interest rates, influenced by economic indicators like inflation, has been the subject of keen observation. As it stands, there’s a 97% chance the rates will remain unchanged in the Fed’s September meeting. However, future sessions might see a shift, with a 40% possibility of a rate hike announcement in November.

Trading Derivatives carries a high level of risk to your capital and you should only trade with money you can afford to lose. Trading Derivatives may not be suitable for all investors, so please ensure that you fully understand the risks involved, and seek independent advice if necessary. A Product Disclosure Statement (PDS) can be obtained either from this website or on request from our offices and should be considered before entering into a transaction with us. Raw Spread accounts offer spreads from 0.0 pips with a commission charge of USD $3.50 per 100k traded. Standard account offer spreads from 1 pips with no additional commission charges. Spreads on CFD indices start at 0.4 points. The information on this site is not directed at residents in any country or jurisdiction where such distribution or use would be contrary to local law or regulation.


Treasuries and Further Economic Reports

U.S. Treasury yields remained largely unchanged as market participants pondered inflation’s trajectory after the recent CPI announcement. Specifically, the 10-year Treasury saw a minor increment to 4.2545%.

As we move forward, traders have their eyes on the imminent release of the PPI, expected to rise by 0.4%, slightly outpacing July’s 0.3% gain. Upcoming retail sales figures and Friday’s consumer sentiment report will also play a crucial role in shaping market sentiment.

Global Market Movements

On the global front, shares of Japanese holding giant Softbank experienced a dip after its subsidiary, Arm, announced its IPO pricing at $51 per share. This IPO values Arm, set to trade on the Nasdaq, at an impressive fully diluted market capitalization of over $54 billion. Softbank is expected to retain control of approximately 90% of Arm’s outstanding shares.

Short-Term Forecast: Bullish with Volatility

While the central bank might hold steady on rates for now, markets will likely see increased volatility. Futures data suggests a near-even split on the possibility of a rate increase in November. This uncertainty, combined with other economic indicators, makes a bullish short-term forecast with a side of volatility through year-end highly probable. Assets that have pushed the market up this year might soon appear overvalued in light of rising yields.