Have Bitcoin & Ethereum Capitulated? BTC/USD & ETH/USD Price Setups

Have Bitcoin & Ethereum Capitulated? BTC/USD & ETH/USD Price Setups

BITCOIN: Holds above 25000

Over the past few weeks, Bitcoin has been holding above strong horizontal trendline support since mid-August, roughly coinciding with the June low of 24750. Last week, BTC/USD attempted to rise above immediate resistance at the early-September high of 26500. While the price action is still unfolding – BTC/USD hasn’t broken above 26500 cleanly – the ongoing attempt to rise above 26500 raises the chances that the worst could be over.

BTC/USD 240-Minute Chart
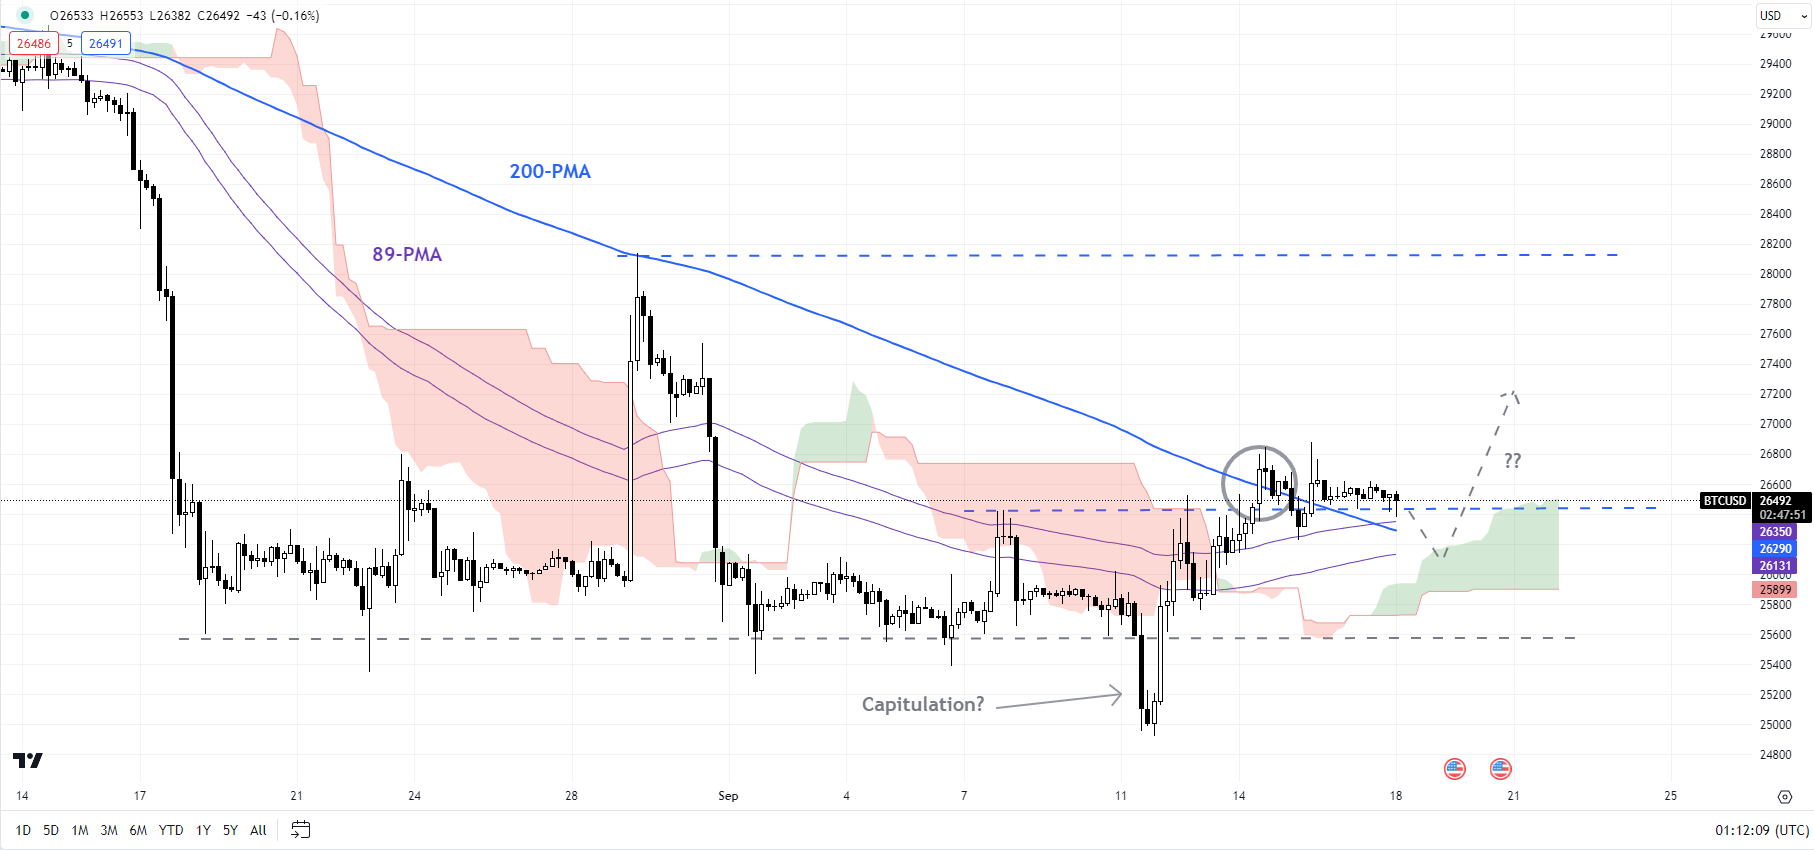
image1.png

That’s because trends generally turn with capitulation. And the brief dip below 25000 last week coupled with the attempt to rise past 26500 suggests the tide could be turning temporarily in favour of BTC/USD. Still, a decisive rise above the resistance is needed for the imminent downside risks to fade. Such a break could open the upside toward the end-August high of 28150.

BTC/USD Weekly Chart
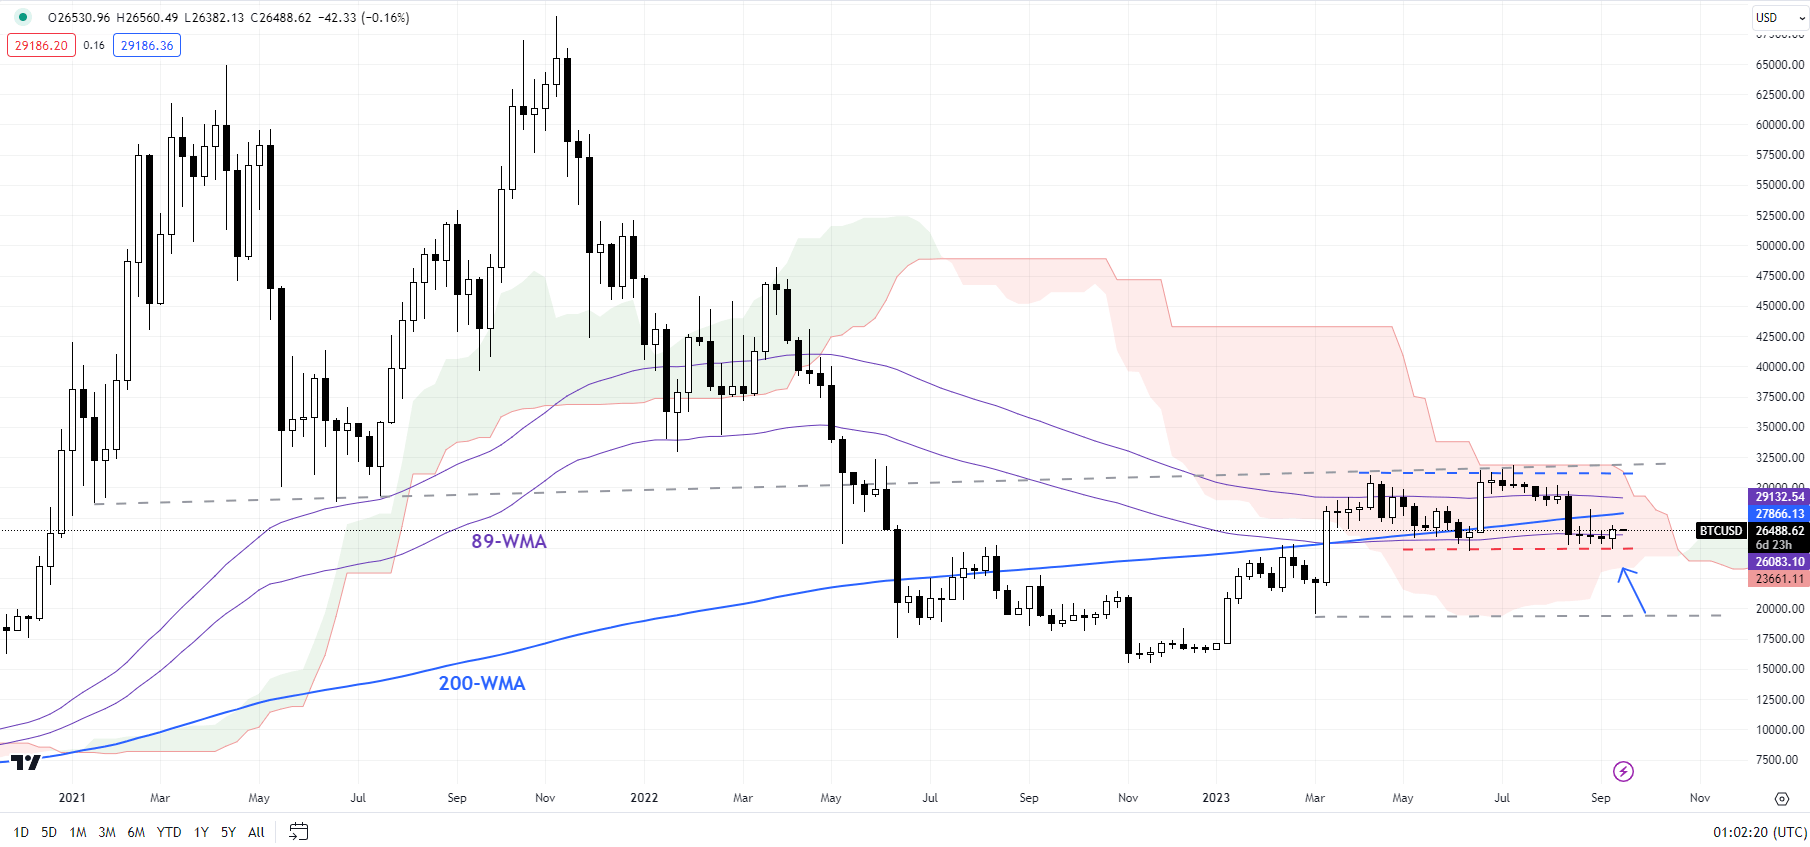
image2.png

Having said that, a fall below 24750-2500 would negate the above scenario, potentially triggering a double top (the April and July highs), pointing to a deeper retracement toward the March low of 19550. For more discussion on this, see “Bitcoin & Ethereum Influenced by Thick Cloud Cover; BTC/USD & ETH/USD Price Setups,” published September 5.

ETH/USD Daily Chart
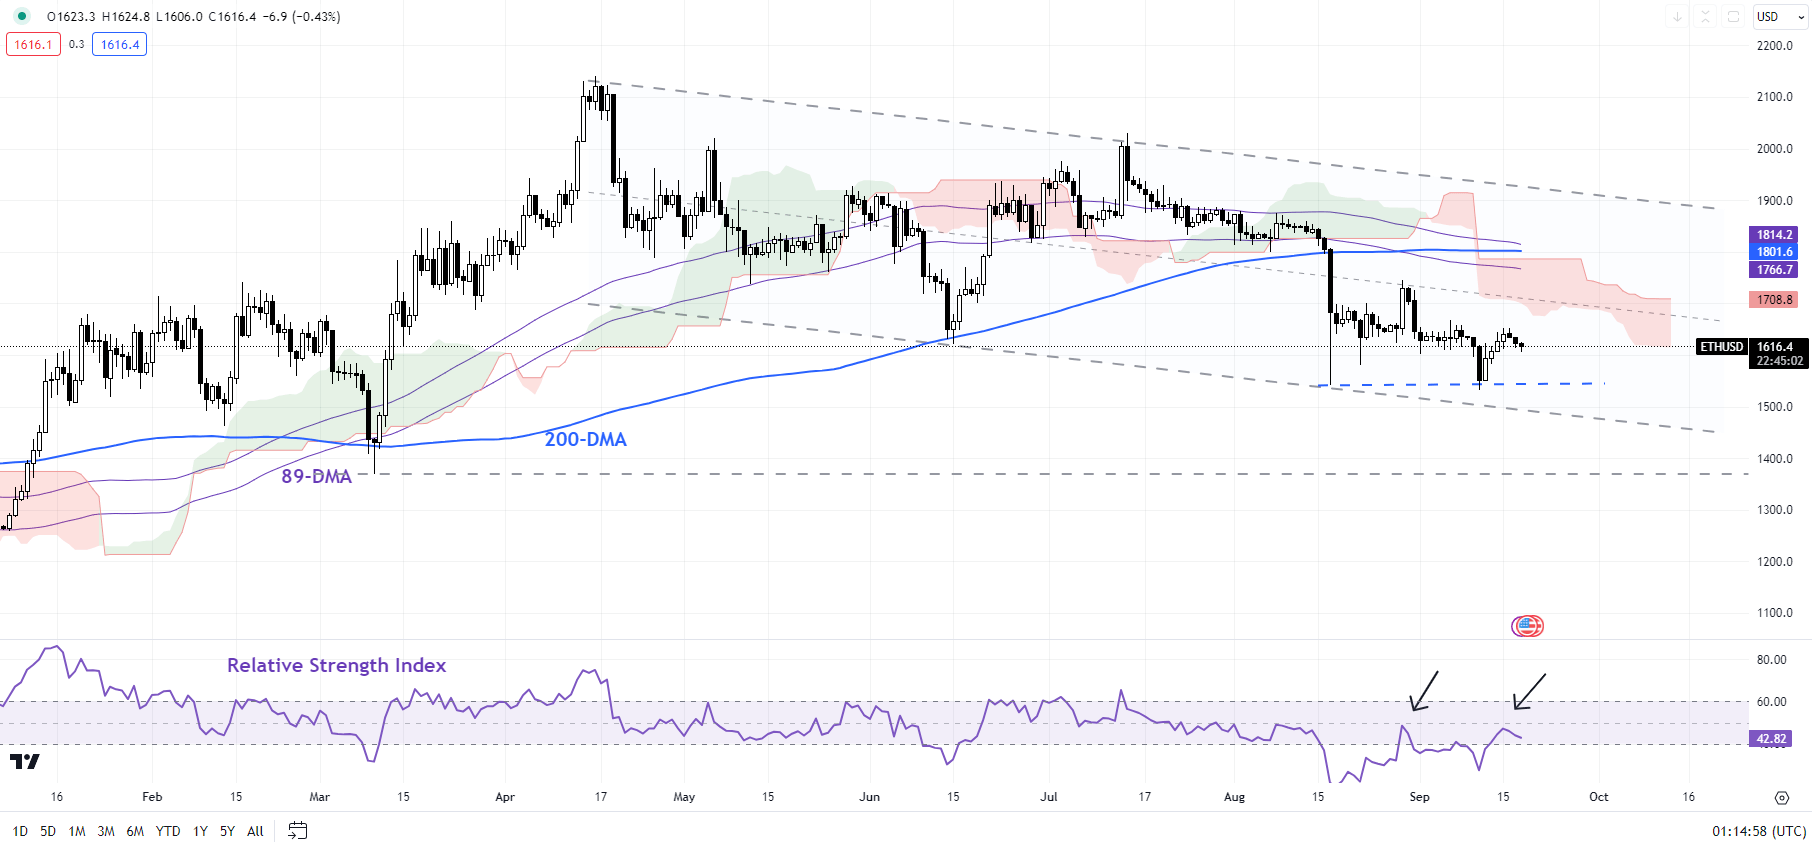
image3.png

ETHEREUM: Awaiting confirmation of a low

In contrast, while Ethereum has been holding above its August low of 1550, ETH/USD has yet to rise above a meaningful resistance. In line with BTC/USD, similar resistance for ETH/USD is at the early-September high of 1660. Until some sort of upward momentum develops, the balance of risks for ETH/USD remains toward the downside in the near term – not the 14-day Relative Strength Index has been capped at the 50-mark – indicating a corrective rally, rather than the start of a new uptrend.

ETH/USD 240-Minute Chart
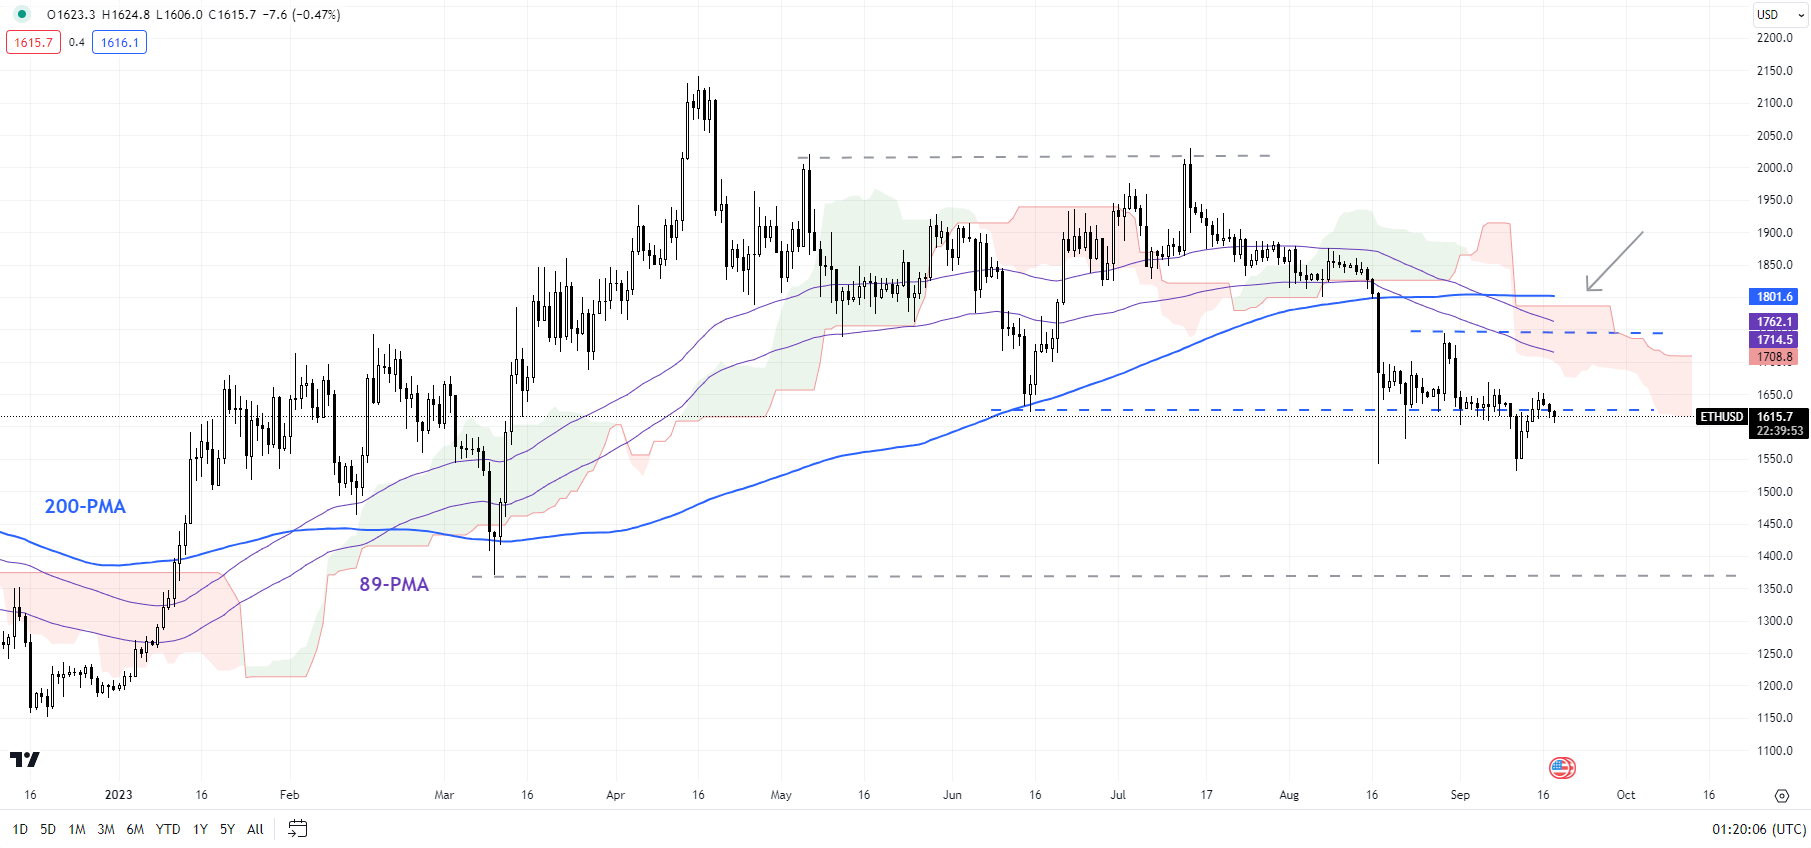
image4.png

Below the August low of 1550, the next support is on the lower edge of a downtrend channel since April (now at about 1500). A break below the 1500-1550 region could pave the way toward the October low of 1370.

As noted earlier this month, ETH/USD has been under the influence of the bearish Ichimoku cloud cover on the weekly charts. Furthermore, in recent weeks, ETH/USD has been snowed under the Ichimoku cloud on the daily charts. At a minimum, Ethereum needs to surpass 1660. A stronger signal that an interim low was in place would be a crack above the end-August high of 1750.

Gold Price Gains Amid Risk Aversion Ahead of Fed, BoE and BoJ. Higher XAU/USD?

Gold Price Gains Amid Risk Aversion Ahead of Fed, BoE and BoJ. Higher XAU/USD?

The gold price added to last Friday’s gain to start the week with risk aversion creeping into markets on Monday ahead of several central bank meetings this week.

China property woes continue with Country Garden looking to renegotiate its debt obligations for CNY bonds and is due to pay a coupon on its USD note today.

The Evergrande shemozzle continues to unfurl with Chinese police detaining some staff from the wealth management unit over the weekend.

As a result, Chinese companies listed in Hong Kong fell with the Hang Seng Index (HSI) down over 1% today. Australia’s S&P ASX 200 also dropped but to a lesser degree.

Japan is on holiday today so the cash market there is closed, but Nikkei 225 futures found higher ground with the Yen continuing to trade near its lowest level since November last year, just shy of 148.

Other currencies have had a quiet start to the week so far after the US Dollar notched up gains last week against CHF, EUR, GBP and JPY.

Futures markets are pointing to a steady start to the Wall Street cash session.

APAC bonds are generally lower as yields tick higher. The benchmark 10-year Treasury bond finished last week at 4.33% after trading at a 16-year high of 4.36% on Thursday.

Crude oil prices are close to the 10-month peak seen on Friday. The WTI futures contract is near US$ 91.50 bbl while the Brent contract is around US$ 94.50 bbl.

Saudi Energy Minister Prince Abdulaziz bin Salman will be speaking at the 24th World Petroleum Congress in Canada later today.

A plethora of central banks will be meeting this week to decide on monetary policy. The Federal Reserve and the Bank of Japan are anticipated to hold policy steady on Wednesday and Friday respectively.

GOLD TECHNICAL ANALYSIS SNAPSHOT

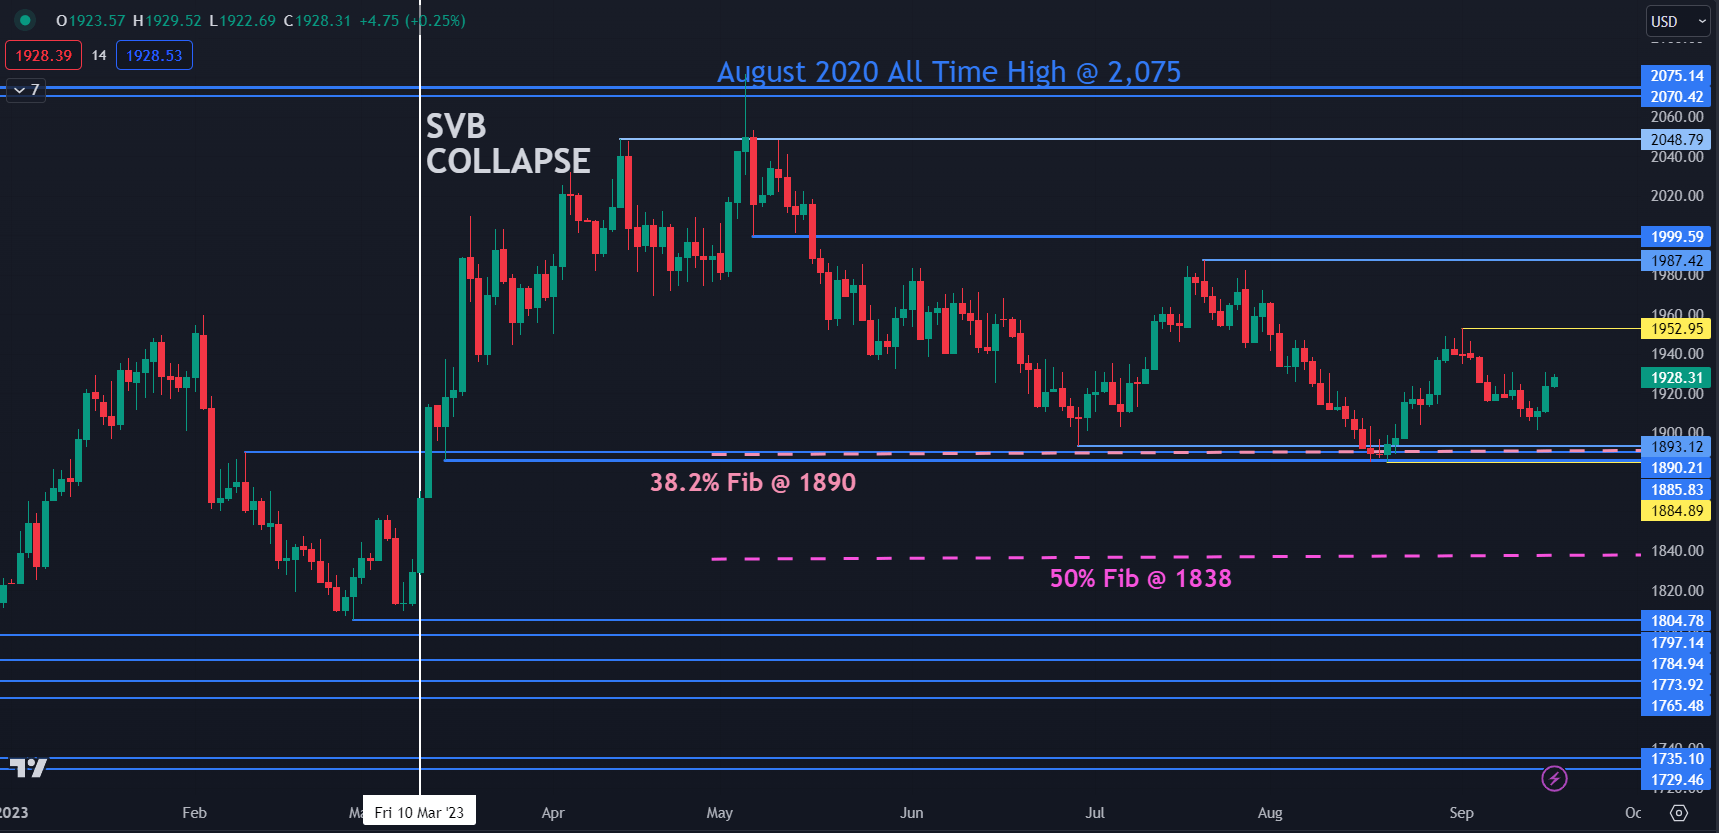
Spot gold had seen a range of US$ 1,885 – 1,997 over the past 4 months.

A break on either side could be the catalyst for momentum to unfold in that direction. Click on the banner below to learn more about range trading.

Support could be in the 1885 – 1895 area where there are a series of prior lows, a breakpoint, and the 38.2% Fibonacci Retracement level of the move from 1614 up to 2062.

Further down the 50% Fibonacci Retracement at 1838 might lend support.

On the topside, resistance might be at the recent peaks of 1953 and 1987 or the psychological level of 2000 where there is also the breakpoint nearby.

SPOT GOLD CHART

image1.png


Oil Prices Forecast: WTI Rises Amidst China’s Robust Economic News

Oil Prices Forecast: WTI Rises Amidst China’s Robust Economic News

Surging Demand in China

Oil prices increased on Friday, poised for their third consecutive weekly gain. This trend is supported by robust Chinese economic data and record-breaking oil consumption, indicating that the demand for oil in the world’s second-largest crude consumer remains robust.

China’s industrial output and retail sales exceeded expectations in August, indicating the nation’s steady recovery from the COVID-19 pandemic.

Trading Derivatives carries a high level of risk to your capital and you should only trade with money you can afford to lose. Trading Derivatives may not be suitable for all investors, so please ensure that you fully understand the risks involved, and seek independent advice if necessary. A Product Disclosure Statement (PDS) can be obtained either from this website or on request from our offices and should be considered before entering into a transaction with us. Raw Spread accounts offer spreads from 0.0 pips with a commission charge of USD $3.50 per 100k traded. Standard account offer spreads from 1 pips with no additional commission charges. Spreads on CFD indices start at 0.4 points. The information on this site is not directed at residents in any country or jurisdiction where such distribution or use would be contrary to local law or regulation.

Additionally, Chinese oil refinery processing reached a staggering 64.69 million tonnes in August, marking a 19.6% rise from the previous year. This equates to 15.23 million barrels per day.

The surge is attributed to high run rates set by Chinese processors during the summer travel season and the advantageous margins for exporting to Asian consumers.

Supply Concerns Amplify

While China’s refining rates soar, major producers like Russia and Saudi Arabia are cutting their output, stirring concerns about a tightening supply. Such worries have propelled both Brent and WTI to their highest since November. The OPEC+ decision last month has further convinced markets of a tight oil scenario for the fourth quarter. Reinforcing these concerns, the International Energy Agency recently projected that extended oil output cuts by Saudi Arabia and Russia would lead to a market deficit throughout the fourth quarter.

Market Mentality & Investor Moves

Despite brief setbacks from bearish U.S. inventory reports, the oil market’s upward trajectory remains undeterred, reflecting the prevailing market sentiment. Hedge funds have consistently bought crude oil futures over recent weeks, primarily driven by a rising demand for gasoline and diesel. Additionally, both the IEA and the Organization of the Petroleum Exporting Countries (OPEC) anticipate a supply deficit in 2023, provided production cuts persist. With Russia and Saudi Arabia’s decisions possibly impacting supply during the northern hemisphere’s peak demand in winter, market concerns about adequate supply are escalating.

Global Interest Rate Scenarios

Amidst the oil scenario, central banks worldwide are making significant moves. The European Central Bank has hiked its key interest rate, although it hints at no further rate adjustments. Investors are 97% certain that the U.S. Federal Reserve will maintain its current interest rates in the upcoming September 20 meeting. In contrast, China’s central bank has decided to reduce the cash reserves banks must hold, aiming to enhance liquidity and foster economic recovery.

Short-Term Forecast

Given China’s consistent demand and the prevailing supply constraints, the outlook for oil prices remains bullish in the short term. However, key central bank decisions worldwide could introduce some volatility in the markets.

Technical Analysis

4-Hour Light Crude OIl FuturesThe current 4-hour price of Light Crude Oil Futures stands at 90.91, showing a minor increase from the previous 4-hour price of 90.76. While the commodity is trading well above its 200-4H moving average of 83.09, it’s 50-4H moving average of 87.82 is the nearest support. The 14-4H RSI reading of 76.87 indicates that the market is in overbought territory.

Although there’s a strong resistance zone between 90.10 and 93.74, the current price is trading inside this area. Given the RSI and moving average positions, the market sentiment for Light Crude Oil Futures currently leans bullish.

DAX Index: ECB Shocks, US Soothes, But DAX Market Focus Turns to China’s Revival

DAX Index: ECB Shocks, US Soothes, But DAX Market Focus Turns to China’s Revival

The DAX gained 0.97% on Thursday. Reversing a 0.39% loss from Wednesday, the DAX ended the session at 15,805.

ECB Fails to Send the DAX into the Red Despite Surprise Hike

On Thursday, the ECB raised interest rates by 25 basis points to 4.50%. While catching the markets by surprise, the ECB offered comfort by stating,

Trading Derivatives carries a high level of risk to your capital and you should only trade with money you can afford to lose. Trading Derivatives may not be suitable for all investors, so please ensure that you fully understand the risks involved, and seek independent advice if necessary. A Product Disclosure Statement (PDS) can be obtained either from this website or on request from our offices and should be considered before entering into a transaction with us. Raw Spread accounts offer spreads from 0.0 pips with a commission charge of USD $3.50 per 100k traded. Standard account offer spreads from 1 pips with no additional commission charges. Spreads on CFD indices start at 0.4 points. The information on this site is not directed at residents in any country or jurisdiction where such distribution or use would be contrary to local law or regulation.

“Based on its current assessment, the Governing Council considers that the key ECB interest rates have reached levels that, maintained for a sufficiently long duration, will make a substantial contribution to the timely return of inflation to the target.”

US Set to Avoid a Hard Landing

US retail sales, producer prices, and jobless claims painted a rosy picture of the US economy. The better-than-expected numbers failed to boost the chances of a Fed rate hike but eased market fears of a hard landing.

The US equity markets responded to the numbers. The Dow rose by 0.96%, with the S&P 500 and NASDAQ Composite Index seeing gains of 0.84% and 0.81%, respectively.

The Thursday Market Movers

Auto stocks sat at the bottom of the table. BMW and Continental fell by 1.46% and 1.05%, respectively. Porsche and Mercedes Benz Group saw losses of 0.66% and 0.58%, respectively. Volkswagen ended the session down 0.39%. The war of words between the EU and China on electric vehicle subsidies and the threat of a US auto strike weighed on auto stocks.

Siemens Energy AG (+4.20%) enjoyed another breakout session on the news of the EU planning measures to support the wind power industry.

The Friday Session

The futures markets are pointing to a bullish end to the week. The DAX is up 73 points, with the NASDAQ gaining 36 points.

China Economic Indicators Set the Tone

Economic indicators from China offered investors hope of a turnaround in the macroeconomic environment. Industrial production increased by 4.5% year-over-year in August versus 3.7% in July. Retail sales were up 4.6% year-over-year versus 2.5% in July, with the unemployment rate falling from 5.3% to 5.2%.

Economists forecast retail sales and industrial production to rise by 3.0% and 3.9%, respectively, and the unemployment rate to increase to 5.4%. Fixed asset investments rose by a more modest 3.2% versus 3.4% in July. Economists forecast a 3.3% increase.

The Asian markets responded favorably to the latest figures and hopes of the US avoiding a hard landing. This morning, the ASX 200 led the way, gaining 1.78%, with the Hang Seng Index up 1.45%.

Euro Area Trade Likely to Play Second Fiddle to the China Numbers

Eurozone trade figures will draw investor interest later today. Economists forecast a narrowing in the trade surplus from €23 billion to €20 billion. Barring a marked narrowing, we expect investors to ignore the numbers.

The latest economic indicators from China will raise hopes of improved trade terms, allowing investors to discount the July trade figures.

However, ECB President Christine Lagarde could influence investor sentiment after the surprise ECB rate hike.

Other economic indicators include finalized inflation numbers from France, which will have a limited impact on the DAX.

US Consumer Confidence to Test Investor Optimism

Later today, Michigan Consumer Sentiment figures for September will draw interest. After the better-than-expected numbers from the US on Thursday, a slump in confidence could test the soft-landing theory.

A slump in confidence would signal a pullback in spending and a deterioration in US service sector activity. Private consumption accounts for about 70% of the US economy.

Economists forecast the Sentiment Index to fall from 69.5 to 69.2. Sub-68 would likely spook investors.

Short-Term Forecast

Investors will redirect their focus from monetary policy to the global economic outlook. While Germany remains on course for a recession, improving numbers from China and robust economic indicators from the US should support further near-term gains.

DAX Technical Indicators

Daily Chart

On Thursday, the DAX broke above the trend line to target the 50-day EMA. Economic indicators from China support a DAX move to the 50-day EMA. A break above the 50-day EMA would bring the 16,007 resistance level into play.

However, a break below the trend line would give the bears a run at the 15,663 support levels.

The 14-Daily RSI reading of 49.95 indicates a neutral position, leaving the DAX in the hands of economic indicators and central bank chatter.

DAX Daily Chart sends bearish price signals.
DAX 150923 Daily Chart

4-Hourly Chart

The DAX sits above the 50-day EMA, a bullish price signal, while remaining below the 200-day EMA, reaffirming bearish longer-term price signals. A DAX break above the 200-day EMA would bring the 16,007 resistance level into play.

However, a break below the 50-day EMA and trend line would give the bears a run at the 15,663 support levels. Buying pressure will likely intensify at 15,800, with the 50-day EMA confluent with the trend line.

The 54.89 RSI reading signals a DAX move through the 200-day EMA before entering overbought territory.

4-Hourly Chart sends bullish near-term price signals.
DAX 150923 4-Hourly Chart
EUR/USD Forecast: Lagarde’s Words to Dictate EUR USD Fate Amid Trade Data Watch

EUR/USD Forecast: Lagarde’s Words to Dictate EUR USD Fate Amid Trade Data Watch

On Thursday, the EUR/USD slid by 0.80%. Following a 0.23% loss on Wednesday, the EUR/USD ended the day at $1.06429. The EUR/USD rose to a high of $1.07521 before falling to a low of $1.06318.

French Inflation and Eurozone Trade Data in Focus

Finalized inflation figures from France will draw interest this morning. However, barring upward revisions to preliminary numbers, the markets will likely disregard them. The ECB delivered a surprise 25-basis point interest rate hike on Thursday. Significantly, the ECB also announced that the current interest rate environment should bring inflation to target.

Trading Derivatives carries a high level of risk to your capital and you should only trade with money you can afford to lose. Trading Derivatives may not be suitable for all investors, so please ensure that you fully understand the risks involved, and seek independent advice if necessary. A Product Disclosure Statement (PDS) can be obtained either from this website or on request from our offices and should be considered before entering into a transaction with us. Raw Spread accounts offer spreads from 0.0 pips with a commission charge of USD $3.50 per 100k traded. Standard account offer spreads from 1 pips with no additional commission charges. Spreads on CFD indices start at 0.4 points. The information on this site is not directed at residents in any country or jurisdiction where such distribution or use would be contrary to local law or regulation.

Considering the ECB stance, investors will likely redirect their focus to the Eurozone economy.

Trade data for the Eurozone will have more influence on investor sentiment later today. Economists expect a narrowing of the trade surplus from €23 billion to €20 billion. A more marked narrowing would reduce buyer interest.

Investors are looking for improved trade terms to boost economic activity and ease the threat of a prolonged economic recession. We expect investors to scrutinize trade terms with key trading partners, including China and the US.

Beyond the numbers, ECB President Christine Lagarde speaks today. A deviation from the Thursday script would influence the EUR/USD pair. The ECB insinuated an end to the monetary policy tightening cycle. Suggestions of further rate hikes would surprise the markets and offer EUR/USD support.

US Consumer Sentiment to End the Week

Later today, Michigan Consumer Sentiment and Expectation figures for September will move the dial. Economists forecast the Michigan Consumer Sentiment Index to slip from 69.5 to 69.2.

A marked decline in consumer sentiment would paint a gloomy consumption outlook. Weaker consumption would raise the threat of a hard landing. Private consumption accounts for about 70% of the US economy. A slump in consumption would impact the US economy, the all-important services sector, and the labor market.

Short-Term Forecast:

Following the ECB surprise rate hike, the focus will turn to the macroeconomic environment. While the euro area economy heads toward a recession, US economic indicators suggest continued growth, favoring the dollar.

EUR/USD Price Action

Daily Chart

The EUR/USD held above the $1.06342 support level. However, the EUR/USD remained below the 50-day and 200-day EMAs, reaffirming bearish price signals. A EUR/USD return to $1.07 would support a EUR/USD move toward the $1.07635 resistance level.

However, ECB President Lagarde has to deliver hawkish comments to support a EUR/USD rebound.

A break below the $1.06342 support level would give the bears a look at sub-$1.06.

The 14-period Daily RSI at 32.41 shows the EUR/USD can break below the $1.06342 support level before entering oversold territory.

EUR/USD Daily Chart sends bearish price signals,
EURUSD 150923 Daily Chart

4-Hour Chart

The EUR/USD remains below the 200-day and 50-day EMAs, reaffirming the bearish price signals. A EUR/USD return to $1.07 would support a EUR/USD move toward the 50-day EMA and the $1.07635 resistance level.

However, a break below the $1.06342 support level would support a EUR/USD move toward $1.06.

The 14-period 4-Hourly RSI at 31.29 leaves the EUR/USD on the border of oversold territory.

4-Hourly Chart affirms bearish price signals.
EURUSD 150923 4 Hourly Chart 

Silver Prices Forecast: XAG/USD Gains Amid Yuan’s Rise and Economic Optimism

Silver Prices Forecast: XAG/USD Gains Amid Yuan’s Rise and Economic Optimism

Silver’s Ascension Amid Economic Indicators

Silver prices witnessed a noticeable uptick as the dollar weakened against the yuan, primarily spurred by positive economic data from China. This surge has revived optimism surrounding economic recovery. However, anticipated U.S. interest rate hikes cast a shadow of caution among investors.

China’s Economic Performance and Yuan Dynamics

China’s economic metrics pleasantly surprised the market on various fronts, bolstering overall sentiment. As a result, the offshore yuan saw a 0.3% appreciation against the dollar. This appreciation contrasts starkly with the yuan’s dip following China’s central bank’s announcement of a reserve ratio cut. Even as the bank rolls out measures to bolster the economy and ensure liquidity, the yuan’s future looks uncertain with consumer confidence wavering. The recent data on China’s factory output and retail sales, however, has painted a rosier picture, leading to a two-week yuan high against the dollar.

Trading Derivatives carries a high level of risk to your capital and you should only trade with money you can afford to lose. Trading Derivatives may not be suitable for all investors, so please ensure that you fully understand the risks involved, and seek independent advice if necessary. A Product Disclosure Statement (PDS) can be obtained either from this website or on request from our offices and should be considered before entering into a transaction with us. Raw Spread accounts offer spreads from 0.0 pips with a commission charge of USD $3.50 per 100k traded. Standard account offer spreads from 1 pips with no additional commission charges. Spreads on CFD indices start at 0.4 points. The information on this site is not directed at residents in any country or jurisdiction where such distribution or use would be contrary to local law or regulation.

U.S. Economic Data and Impending Rate Decisions

The U.S. has unveiled data showing a considerable rise in producer prices and retail sales, both pushed higher by rising gasoline costs. Given the previous month’s uptick in consumer prices, further Federal Reserve rate hikes seem plausible. The robust U.S. economic backdrop doesn’t indicate a need for rate cuts, potentially pushing such decisions to next year.

European Central Bank Takes Action

The European Central Bank (ECB) took the financial world by surprise by hiking its principal interest rate to a staggering 4%. Current signals hint at this being their concluding rate increment. Historically, such hikes, introduced to mitigate inflation, have negatively impacted the demand for assets like silver which don’t yield interest.

A Glimpse Into Silver’s Immediate Future

Taking into account the prevailing U.S. economic conditions and the banking sector’s rate decisions, silver prices might be heading south. The prevalent market sentiment leans bearish in the near term, primarily due to potential forthcoming rate hikes from the Federal Reserve. Yet, the day’s trading hints at the XAG/USD becoming a sought-after asset due to perceived oversold conditions.

Technical Analysis

4-Hour Silver (XAG/USD)The XAG/USD, with its current 4-hour price of 23.06, hovers near its 50-4H moving average of 23.07, hinting at a possible short-term upward shift. Its positioning below the 200-4H average of 23.42, alongside an RSI reading of 55.14, implies emerging bullish momentum.

Notably, the incremental rise from its previous 4-hour price of 22.93 underlines this potential. While the commodity might not be gearing up to challenge the main resistance zone between 25.00 to 25.27 soon, traders seem to be showing notable respect for the established support zone ranging from 22.70 to 22.28. This reinforces a cautiously optimistic market sentiment.

Gold Prices Forecast: XAU/USD Rises Amid Yuan’s Response to Robust Economic News

Gold Prices Forecast: XAU/USD Rises Amid Yuan’s Response to Robust Economic News

Gold Prices and Economic Data

Gold (XAU/USD) prices experienced a surge as Friday saw the dollar declining against the yuan, following encouraging economic figures from China. The latter ignited hopes of economic rejuvenation in the premier gold consumer. Nevertheless, the looming potential of more interest rate hikes in the U.S. has left investors cautious.

Yuan’s Response to Economic Indicators

China’s economic data exceeded expectations on several fronts, bringing a refreshing boost in market sentiment. Consequently, the offshore yuan appreciated by over 0.3% against the dollar. However, this comes after the yuan’s decline on Thursday due to the People’s Bank of China’s announcement of a reserve requirement ratio cut.

Trading Derivatives carries a high level of risk to your capital and you should only trade with money you can afford to lose. Trading Derivatives may not be suitable for all investors, so please ensure that you fully understand the risks involved, and seek independent advice if necessary. A Product Disclosure Statement (PDS) can be obtained either from this website or on request from our offices and should be considered before entering into a transaction with us. Raw Spread accounts offer spreads from 0.0 pips with a commission charge of USD $3.50 per 100k traded. Standard account offer spreads from 1 pips with no additional commission charges. Spreads on CFD indices start at 0.4 points. The information on this site is not directed at residents in any country or jurisdiction where such distribution or use would be contrary to local law or regulation.

Despite these measures to ensure liquidity and aid the fragile economic revival, the yuan’s value could diminish further. While the central bank’s stimulus measures have been incremental, consumer confidence remains a challenge. Nonetheless, after the release of encouraging data regarding China’s factory output and retail sales, the yuan witnessed two-week highs against the dollar.

U.S. Inflation and Interest Rates

Recent U.S. data unveiled a significant rise in producer prices and a surge in retail sales, both influenced by gasoline price hikes. This trend followed the previous month’s spike in U.S. consumer prices, keeping the possibility of more Federal Reserve rate hikes alive. Due to the resilient U.S. economic landscape, there appears to be no pressing need for rate reductions, postponing such prospects until next year.

European Central Bank’s Move

The European Central Bank (ECB) elevated its key interest rate to an unprecedented 4%. However, signals indicate this might be their final hike. Typically, rate increases to combat inflation can reduce bullion demand, as gold doesn’t yield interest.

Short-term Forecast

Considering the U.S. economic health and rate decisions by major banks, gold prices face downward pressure. The market sentiment tilts bearish for the short term, especially with potential rate hikes on the horizon.

Technical Analysis

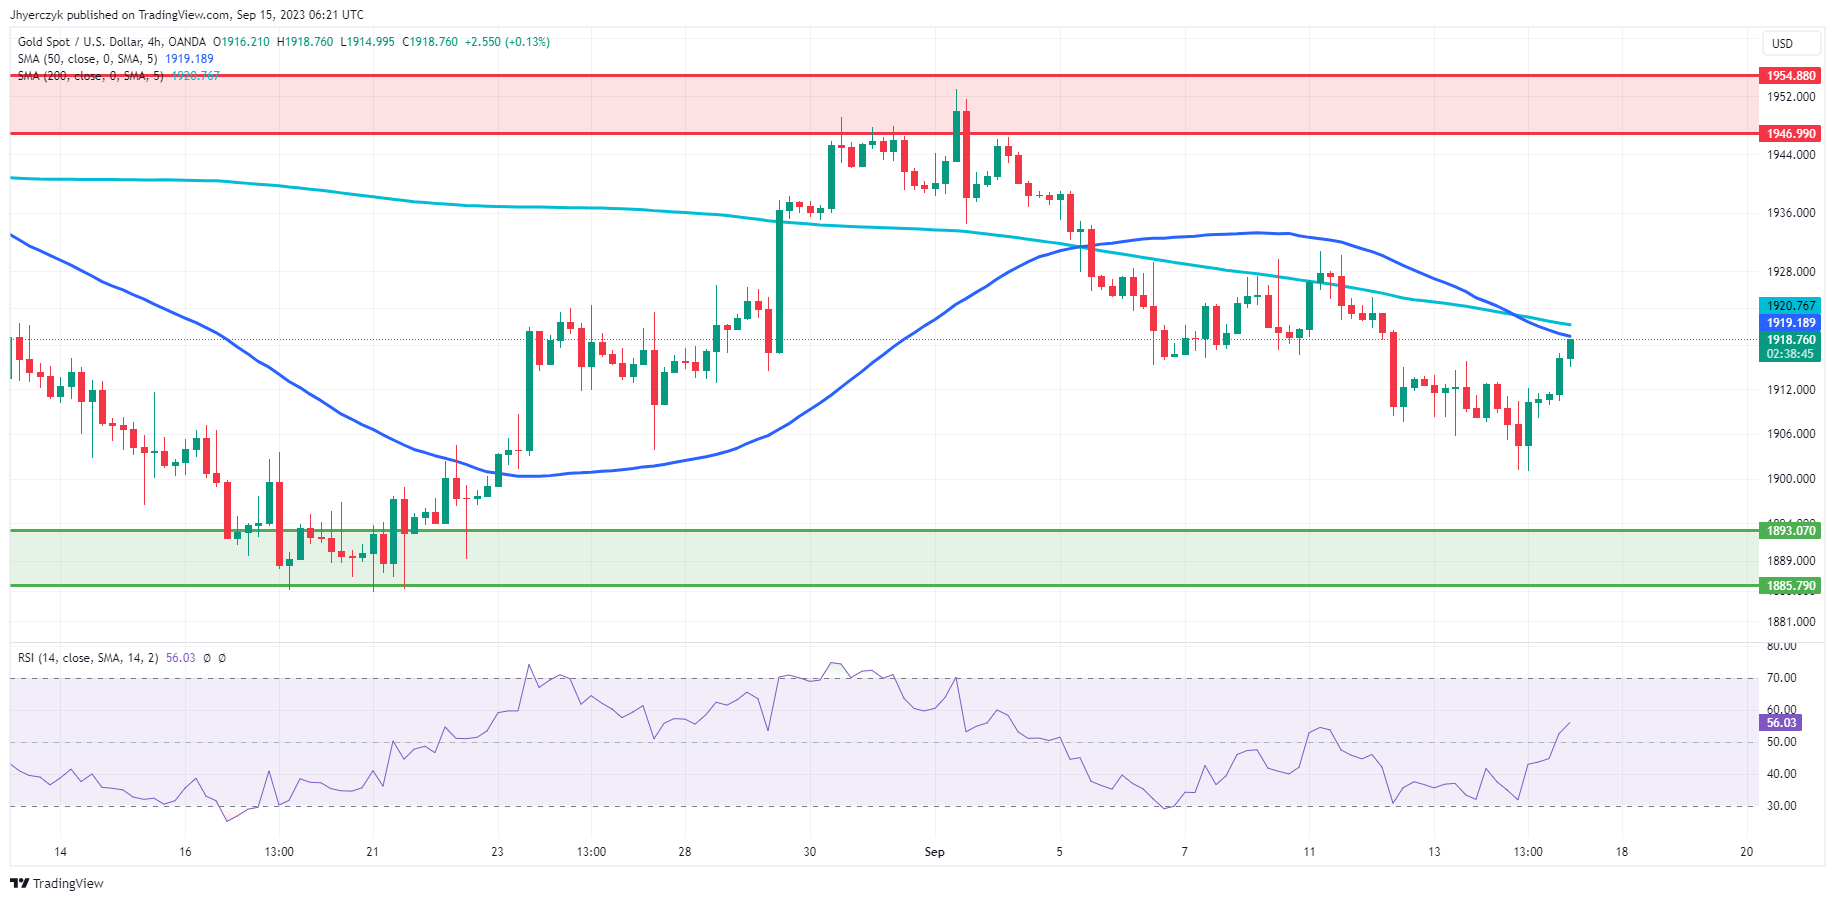
4-Hour Gold (XAU/USD)The current 4-hour price of XAU/USD sits slightly below its 200-4H moving average and is nearly at par with the 50-4H moving average. The 14-4H RSI reading of 57.05 suggests slightly strengthened momentum but isn’t in the overbought territory.

Despite the recent price increment from 1916.21 to 1919.00, Spot Gold remains within the main support and resistance zones. Specifically, it’s positioned closer to the main support area, which ranges from 1893.07 to 1885.79, while the main resistance looms between 1946.99 and 1954.88. Given these factors, the market sentiment leans cautiously bullish, though it’s nearing a pivotal zone.

The price action also suggests the market may be poised for an upside breakout if the buying is strong enough to overcome the 200-4H moving average at 1920.77.

Japan’s Tertiary Sector Surges: 0.9% Monthly Gain Defies Expectations

Japan’s Tertiary Sector Surges: 0.9% Monthly Gain Defies Expectations

Tertiary Industry Activity Shows Strong Resurgence in July 2023

In the most recent report on Indices of Tertiary Industry Activity, published on September 15, 2023, the tertiary sector continues to exhibit remarkable resilience and growth. With a 2015 average set at 100, this vital economic indicator reveals promising insights into the health of service-based industries. Here are the key takeaways.

Impressive Monthly Gains

July 2023 witnessed significant upswings in the tertiary sector, with the seasonally adjusted index climbing to 101.8, marking an impressive 0.9% increase from the previous month. This was better than the 0.2% forecast and well-above June’s revised -0.7%. The original index, equally robust, stood at 101.4, signifying an even more remarkable 2.7% year-on-year growth. These numbers reflect a sector not only bouncing back but thriving amidst dynamic economic conditions.

Personal and Business Services Lead the Charge

Within the tertiary sector, Broad-ranging Personal Services and Broad-ranging Business Services played pivotal roles. Personal Services saw a modest 0.3% monthly increase, reaching an index of 101.5, and a 2.6% annual growth. Simultaneously, Business Services soared with an index of 102.2, marking an impressive 1.5% monthly surge, and an equally substantial 2.6% year-on-year rise. This indicates that both consumer-centric and professional services continue to flourish, driven by evolving consumer needs and business demands.

Driving Forces Behind the Surge

A closer look at the industries contributing to these positive changes reveals some noteworthy trends. Transport and Postal Activities, particularly Road Freight Transport, played a significant role, with a 6.9% monthly increase and a 5.7% year-on-year growth. Retail Trade, Electricity, Gas, Heat Supply, and Water, Real Estate, Finance and Insurance, and Living and Amusement-related Services also contributed positively, underscoring the breadth of the sector’s recovery.

Challenges in Certain Sectors

While the overall outlook is optimistic, some sectors faced challenges. Business-related Services saw a minor dip of -0.8% monthly, primarily due to changes in Technical Services and Employment and Worker Dispatching Services. Additionally, Medical, Health Care, and Welfare, as well as Information and Communications, experienced slight declines. Goods Rental and Leasing remained flat, and this segment faces a year-on-year decrease of -1.4%.

Short-term Outlook: Bullish

In the short term, the tertiary sector is expected to remain bullish. The notable growth across various industries, coupled with increasing consumer and business confidence, suggests continued expansion. While challenges persist in specific sectors, the overall trajectory is one of recovery and progress. July’s positive performance affirms the resilience of the tertiary industry in navigating the ever-evolving economic landscape.

Asia Day Ahead: VIX Back at Year-to-Date Low, Nikkei 225 Hits Two Month High

Asia Day Ahead: VIX Back at Year-to-Date Low, Nikkei 225 Hits Two Month High

A significantly stronger-than-expected US August retail sales (0.6% month-on-month versus 0.2% forecast), along with firm expectations for a rate hold from the Fed next week, fed into some soft landing hopes overnight. Major US indices registered a new one-week high, while the VIX heads back to retest its year-to-date low as a reflection of risk-on sentiments.

The improved risk mood came despite a hotter-than-expected read in US headline Producer Price Index (PPI), largely as continued moderation in both the core producer and consumer prices still warrants room for the Fed to consider a prolonged rate hold through the rest of the year. The US dollar firmed 0.7%, with gains partly amplified further by euro weakness.

Oil prices continued its climb (+2%), with lingering tighter-supplies conditions overriding US dollar strength. Despite a surprise build in US crude inventories this week, the broader trend over the past month is still on significant supplies drawdowns.

Gold prices attempt to stabilise as well (-0.1%), but more conviction for buyers remains to be sought with its lower-highs-lower-lows formation in place since May this year.

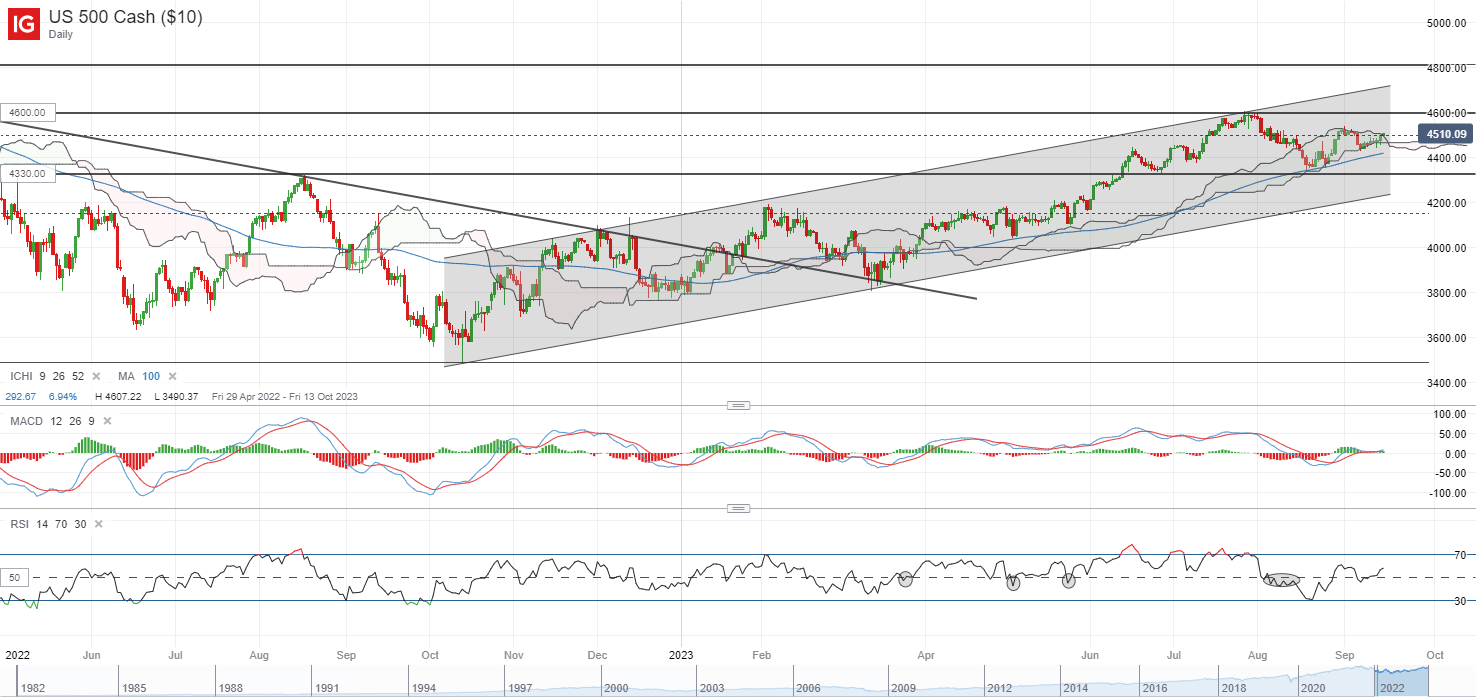
Aside, the Nasdaq 100 index is currently making an attempt to retest its early-September high, well-guided lately by the lower edge of its Ichimoku cloud support on its daily chart. A series of support line remains on watch as well, which includes its 100-day moving average (MA). Further upside may leave its July 2023 peak at the 4,600 level on watch for a retest next, overcoming this level could potentially leave its all-time high in sight at the 4,812 level back in January 2022.

image1.png

Asia Open

Asian stocks look set for a positive open, with Nikkei +0.88%, ASX +1.67% and KOSPI +0.90% at the time of writing. Ahead, focus will be on a series of economic data out of China (fixed asset investment, retail sales, industrial production), where the data will provide fresh updates on growth conditions, given the series of supportive policy measures so far.

Earlier today, the People’s Bank of China (PBoC) kept its one-year medium-term lending facilities (MLF) rate unchanged at 2.5%, but announced a 191 billion yuan injection to boost liquidity. This follows after the China’s central bank cut its banks’ reserve requirements yesterday, with the series of supportive moves suggesting that today’s data release may potentially stay downbeat, in line with the broad downside surprises seen over the past months. Nevertheless, investors will remain on the lookout for growth conditions to reflect any worst-is-over as an indication of policy success, before finding the conviction for a further move back into Chinese equities.

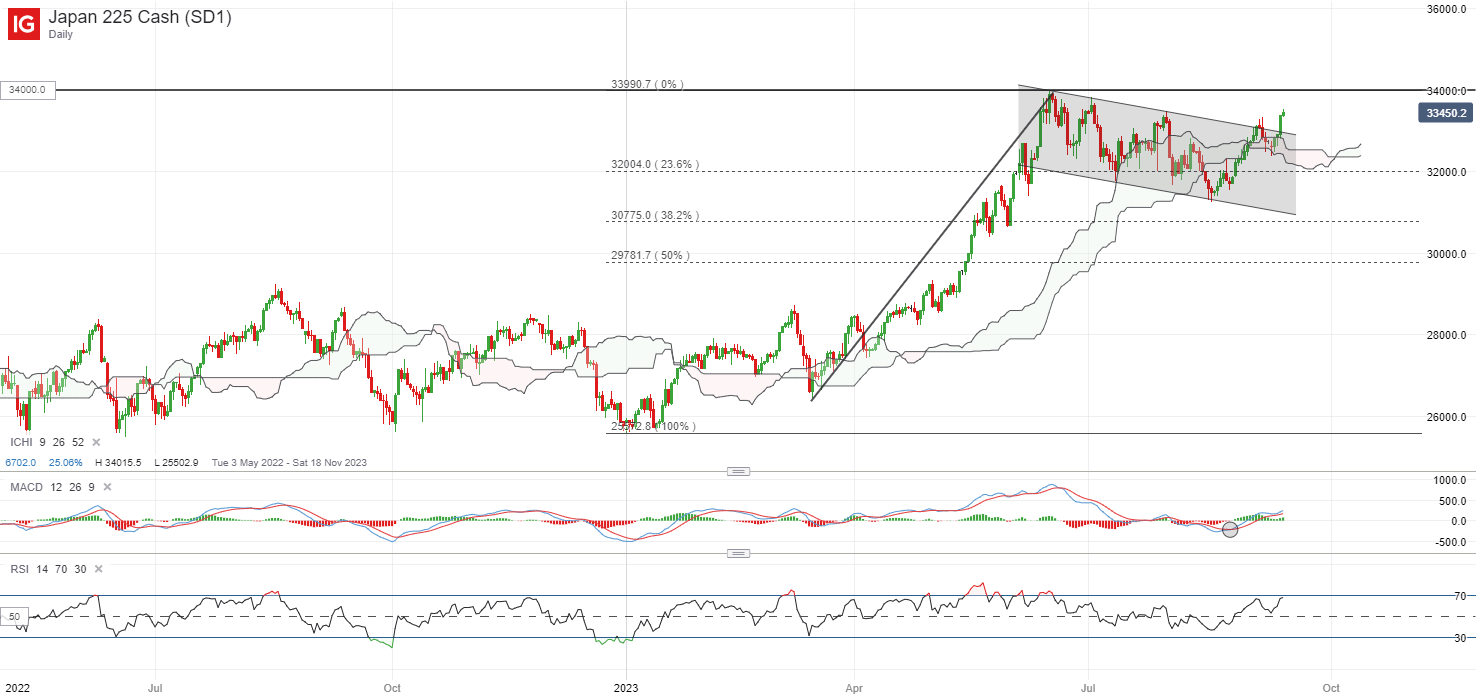
After a short blip early this month, the Nikkei 225 index is back on the rise once more, finding support off the lower edge of its Ichimoku cloud on the daily chart to trigger a break above a near-term descending channel consolidation pattern. A broader bullish flag formation remains in place for now, which may leave its year-to-date high at the 34,000 level on watch for a retest ahead. On the downside, the upper channel trendline may now serve as a resistance-turned-support at the 32,800 level.

image2.png

On the watchlist: EUR/USD back to retest June 2023 low

In line with an upward revision in inflation forecasts for 2023 and 2024, the European Central Bank (ECB) delivered a 25 basis-point (bp) hike in yesterday’s meeting. But the market takeaway is that of a dovish hike, as focus revolves around the central bank’s guidance that the current hiking cycle may have likely come to an end. The official statement guided that current key ECB interest rates have reached levels that will contribute substantially for inflation to return to target, if maintained for a sufficiently long duration.

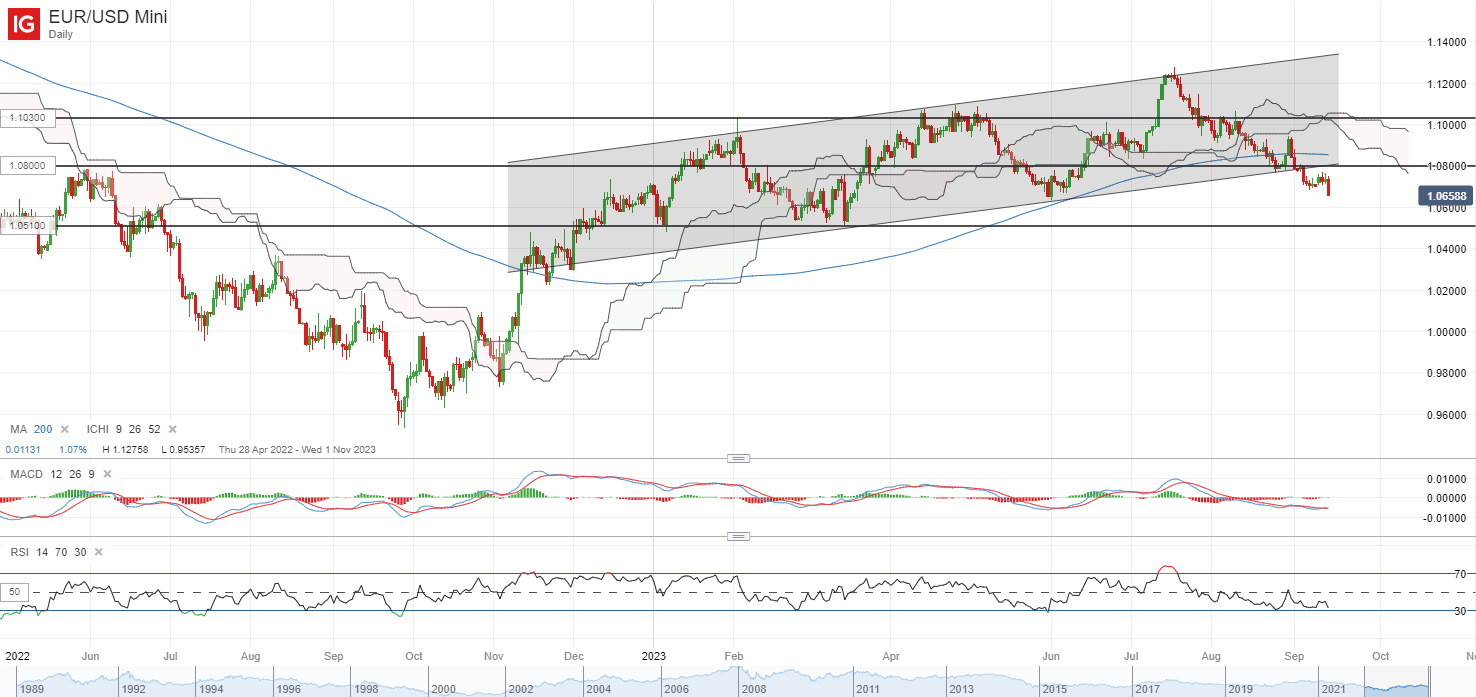
With that, the EUR/USD reacted strongly to the downside overnight (-0.7%), with its June 2023 low under threat of a breakdown. Its daily RSI has been below its key 50 level since July this year, reflecting sellers largely in control. Further downside may leave its year-to-date low at the 1.051 level on watch as the next line of support to hold, failing which may pave the way to retest the 1.030 level next.

image3.png


Oil – US Crude IG Client Sentiment: Our data shows traders are now at their least net-long Oil – US Crude since Aug 10 when Oil – US Crude traded near 82.39.

Oil – US Crude IG Client Sentiment: Our data shows traders are now at their least net-long Oil – US Crude since Aug 10 when Oil – US Crude traded near 82.39.

Number of traders net-short has increased by 12.59% from last week.

SYMBOL TRADING BIAS NET-LONG% NET-SHORT% CHANGE IN LONGS CHANGE IN SHORTS CHANGE IN OI
Oil – US Crude BULLISH 34.95% 65.05% -9.36% Daily

-3.19% Weekly

8.88% Daily

12.59% Weekly

1.73% Daily

6.52% Weekly

Oil – US Crude: Retail trader data shows 34.95% of traders are net-long with the ratio of traders short to long at 1.86 to 1. Our data shows traders are now at their least net-long Oil – US Crude since Aug 10 when Oil – US Crude traded near 82.39. The number of traders net-long is 9.36% lower than yesterday and 3.19% lower from last week, while the number of traders net-short is 8.88% higher than yesterday and 12.59% higher from last week.

We typically take a contrarian view to crowd sentiment, and the fact traders are net-short suggests Oil – US Crude prices may continue to rise.

Traders are further net-short than yesterday and last week, and the combination of current sentiment and recent changes gives us a stronger Oil – US Crude-bullish contrarian trading bias.