Dax Index: ECB and Fed Uncertainties Weigh on Dax 30 Performance

Dax Index: ECB and Fed Uncertainties Weigh on Dax 30 Performance

DAX Hits Reverse on Central Bank Rate Hike Jitters

On Tuesday, the DAX fell by 0.54%. Reversing a 0.39% gain from Monday, the DAX ended the session at 15,716.

Deteriorating Economic Sentiment Sends Mixed Signals

Economic indicators from the euro area tested buyer appetite. The German ZEW Economic Sentiment Index unexpectedly increased from -12.3 to -11.4 in September. However, sentiment toward the Eurozone economy fell by more than forecasts, suggesting more euro area-wide doom and gloom ahead.

Trading Derivatives carries a high level of risk to your capital and you should only trade with money you can afford to lose. Trading Derivatives may not be suitable for all investors, so please ensure that you fully understand the risks involved, and seek independent advice if necessary. A Product Disclosure Statement (PDS) can be obtained either from this website or on request from our offices and should be considered before entering into a transaction with us. Raw Spread accounts offer spreads from 0.0 pips with a commission charge of USD $3.50 per 100k traded. Standard account offer spreads from 1 pips with no additional commission charges. Spreads on CFD indices start at 0.4 points. The information on this site is not directed at residents in any country or jurisdiction where such distribution or use would be contrary to local law or regulation.

While investors grapple with the increasing threat of a euro area economic recession, ECB monetary policy uncertainty added to the cautious mood.

Fed Uncertainty Resurfaces as CPI Report Looms

Sentiment toward the Fed interest rate outlook remained divided. While investors expect the Fed to leave rates unchanged in September, uncertainty lingers over the November decision.

Investors are betting on the Fed hitting pause on interest rate hikes despite economists forecasting a pickup in headline inflation.

The Tuesday Market Movers

MTU Aero continued to sit at the bottom of the table, sliding by 6.89%. The news of inspection plans and financial burdens left MTU Aero down 12.10% on Monday.

However, auto stocks continued to lead the way on hopes of improved demand from China. Mercedes Benz Group gained 1.03%, with Porsche and Volkswagen gaining 0.91% and 0.87%, respectively.

Today’s Session

Eurozone industrial production will be in the spotlight today. Economists forecast a 0.7% fall in production in July after a 0.5% increase in June. While worse-than-expected production figures would test buyer appetite, ECB and Fed monetary policy goals remain the focal point.

The ECB and the Fed remain focused on inflation, limiting the impact of manufacturing sector data on policy bets.

The DAX Futures was down 85 points this morning.

US CPI Report to Dictate Near-Term Fed Policy Goals

The heavily anticipated US CPI Report will influence buyer appetite. An unexpected pickup in core inflation would fuel bets on further Fed rate hikes and impact buyer appetite.

Economists forecast the US core inflation rate to soften from 4.7% to 4.3% while expecting headline inflation to accelerate to 3.6%. With the markets betting on a Fed pause in September, the CPI Report could materially alter the Fed policy outlook.

The Eurozone economy faces turbulent times ahead. A more hawkish Fed could reignite fear of a US hard landing, another reason for investors to remain cautious before the CPI Report.

Short-Term Forecast

With the weakening euro area macroeconomic backdrop, hawkish bets on ECB and Fed monetary policy decisions remain headwinds. The lack of a meaningful stimulus package from Beijing to boost the Chinese economy is another consideration.

DAX Technical Indicators

Daily Chart

On Tuesday, the trend line rejected a DAX move toward the 15,663 support level. However, rising bets on ECB and Fed interest rate hikes would support a break below the trend line to target the 15,663 support level.

Hotter-than-expected US inflation figures would refuel Fed rate hike bets. However, investors must also consider the threat of a 25-basis point ECB rate hike. A deteriorating macroeconomic environment and hawkish bets on interest rates would weigh on investor sentiment.

In contrast, cooler-than-expected US inflation numbers could close the door on further Fed rate hikes. An end to the Fed rate hike cycle would bring the 50-day EMA and 16,007 resistance level into play.

The 14-Daily RSI reading of 44.46 signals the DAX can fall through the trend line and 15,663 support level before hitting oversold territory.
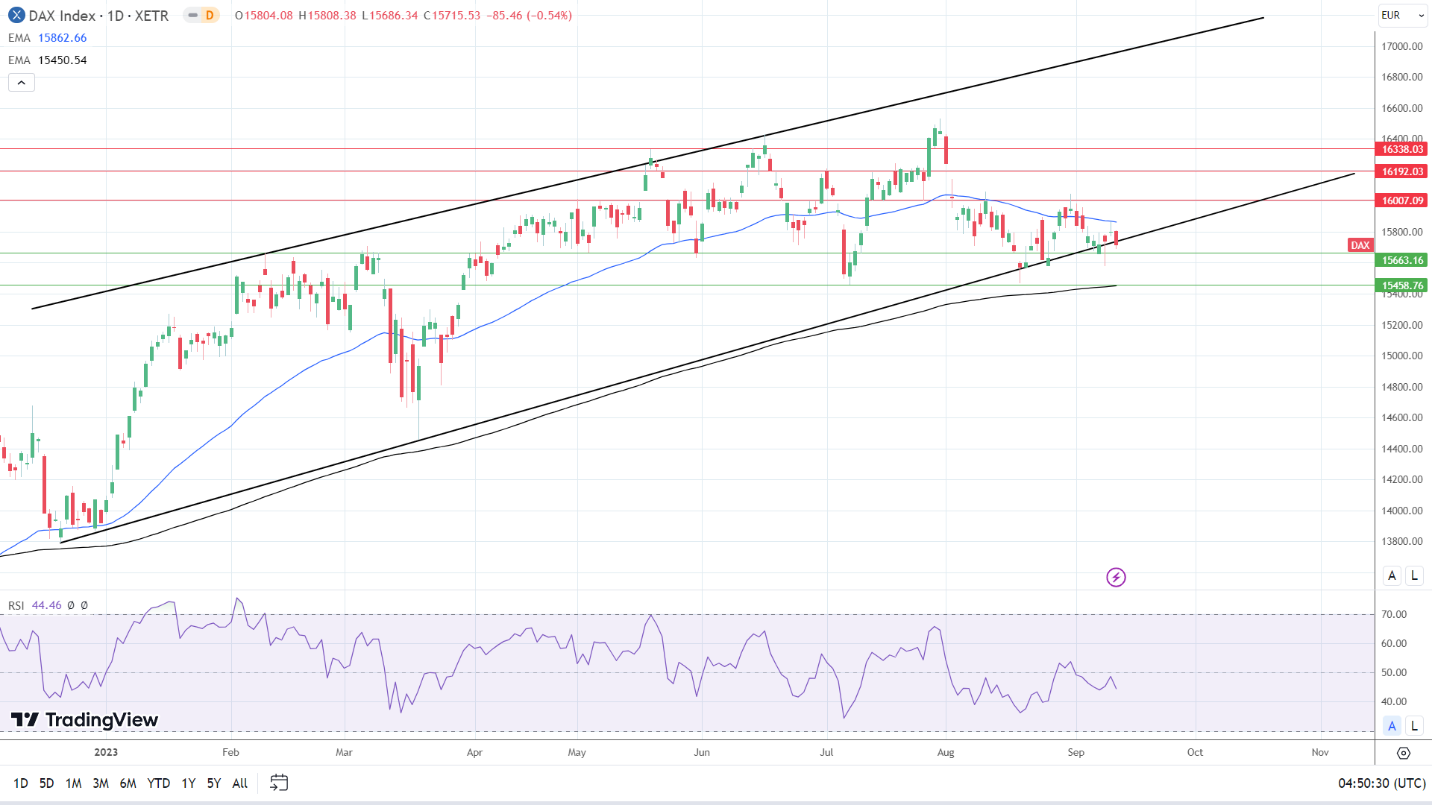
DAX Daily Chart sends bearish near-term price signals.
DAX 130923 Daily Chart

4-Hourly Chart

The DAX remains below the 50-day and 200-day EMAs, sending bearish price signals. Easing bets on an ECB rate hike and softer US inflation numbers would support a break above the trend line to target the 50-day EMA.

However, hotter-than-expected US inflation figures would give the DAX a run at the 15,663 support level.

The 43.63 RSI reading shows the DAX can fall to sub-15,600 before entering oversold territory.
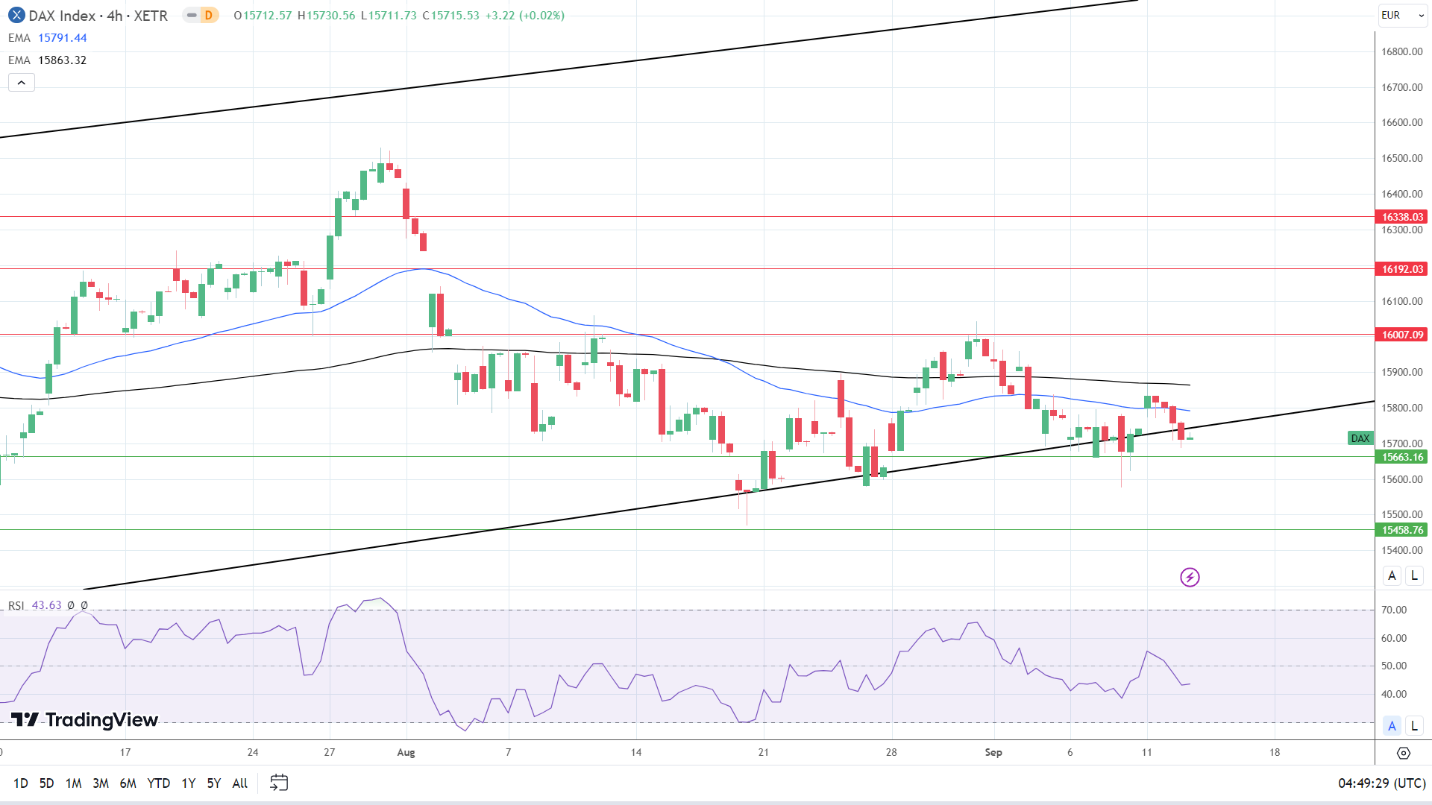
4-Hourly Chart affirms bearish near-term price signals.
DAX 130923 4-Hourly Chart

Dax Index: ECB and Fed Uncertainties Weigh on Dax 30 Performance

EUR/USD Forecast: Eurozone Production and US CPI – A Dual Analysis

EUR/USD Forecast: Eurozone Production and US CPI – A Dual Analysis

On Tuesday, the EUR/USD gained by 0.03%. After a 0.49% rise on Monday, the EUR/USD ended the day at $1.07538. The EUR/USD rose to a high of $1.07679 before falling to a low of $1.07055.

Eurozone Industrial Production to Set the Pre-ECB Tone

Eurozone industrial production will give investors more insight into the state of the Eurozone economy. Economists forecast a 0.7% decline in production for July, compared to a 0.5% increase in June.

Trading Derivatives carries a high level of risk to your capital and you should only trade with money you can afford to lose. Trading Derivatives may not be suitable for all investors, so please ensure that you fully understand the risks involved, and seek independent advice if necessary. A Product Disclosure Statement (PDS) can be obtained either from this website or on request from our offices and should be considered before entering into a transaction with us. Raw Spread accounts offer spreads from 0.0 pips with a commission charge of USD $3.50 per 100k traded. Standard account offer spreads from 1 pips with no additional commission charges. Spreads on CFD indices start at 0.4 points. The information on this site is not directed at residents in any country or jurisdiction where such distribution or use would be contrary to local law or regulation.

We expect increased sensitivity to manufacturing sector numbers. While the manufacturing sector accounts for less than 20% of the Eurozone economy, a continued deterioration in sector conditions would be a drag on the broader Eurozone economy.

Eurozone economic sentiment in September worsened beyond expectations, with the ZEW Indicator dropping from -5.5 to -8.9. A deteriorating Eurozone economy could reduce consumption and demand-driven inflation, potentially reducing the urgency for the ECB to address persistent inflation.

Despite the gloomy macroeconomic backdrop, rumors of an upward revision to inflation forecasts for 2024 will provide more ECB policy uncertainty. The uncertainty toward the Thursday interest rate decision will likely increase investor sensitivity to the economic calendar.

US CPI Report to Battle Elevated Eurozone Inflation Expectations

The US CPI Report will likely decide the outcome of the September Fed interest rate decision and influence the November decision.

Hotter-than-expected core inflation and a more marked acceleration in headline inflation could force the Fed to lift rates higher.

Labor market conditions and wage growth continue to support consumption. Higher interest rates would weaken labor market conditions, easing wage growth and consumption-driven inflation.

Economists forecast the core annual inflation rate to soften from 4.7% to 4.3%. However, economists expect the annual inflation rate to accelerate from 3.2% to 3.6%, well above the 2% target.

Short-Term Forecast:

An upward revision to Eurozone inflation forecasts would pressure the ECB to push rates higher. However, the Eurozone economy also faces the risk of an ECB-fueled economic recession. The threat of a prolonged Eurozone recession would likely put EUR/USD on the defensive.

EUR/USD Price Action

Daily Chart

The EUR/USD hovered below the 50-day and 200-day EMAs, reaffirming bearish price signals. The EUR/USD could target the $1.07635 resistance level if Eurozone industrial production numbers ease fears of an economic recession.

However, further euro area inflation chatter and the US CPI Report will likely impact the EUR/USD more. Cooler-than-expected US inflation numbers and rising bets on an ECB rate hike would give the EUR/USD a look at $1.08. A break above the $1.07635 pivot would support a EUR/USD move toward the trend line and 200-day EMA.

The 14-period Daily RSI at 40.17 signals a EUR/USD fall to sub-$1.0650 before entering oversold territory.

EUR/USD Daily Chart sends bearish price signals.
EURUSD 130923 Daily Chart

4-Hour Chart

The EUR/USD holds below the 200-day and 50-day EMAs, reaffirming the bearish price signals. A break above the 50-day EMA and the $1.07635 resistance level would signal a EUR/USD move toward the trend line. However, the US CPI Report should ease bets on further Fed rate hikes to support a EUR/USD breakout.

Failure to break above the $1.07635 resistance level could see the EUR/USD target levels below $1.07.

The 14-period 4-Hourly RSI at 53.72 gives the EUR/USD room to target $1.08 before hitting overbought territory.

4-Hourly Chart sends bearish price signals.
EURUSD 130923 4 Hourly Chart
Silver Prices Forecast: Inflationary Winds Shape XAG/USD’s Spot Value Trajectory

Silver Prices Forecast: Inflationary Winds Shape XAG/USD’s Spot Value Trajectory

Silver’s Price Dynamics Amid Inflation Expectations

Silver prices fluctuated early Wednesday, trading above their two-week low, as investors anticipate U.S. inflation data crucial for Federal Reserve rate decisions.

At 06:30 GMT, Spot Silver (XAG/USD) is trading $22.785, down $0.27 or -1.19%.

Trading Derivatives carries a high level of risk to your capital and you should only trade with money you can afford to lose. Trading Derivatives may not be suitable for all investors, so please ensure that you fully understand the risks involved, and seek independent advice if necessary. A Product Disclosure Statement (PDS) can be obtained either from this website or on request from our offices and should be considered before entering into a transaction with us. Raw Spread accounts offer spreads from 0.0 pips with a commission charge of USD $3.50 per 100k traded. Standard account offer spreads from 1 pips with no additional commission charges. Spreads on CFD indices start at 0.4 points. The information on this site is not directed at residents in any country or jurisdiction where such distribution or use would be contrary to local law or regulation.

U.S. Economic Health and the Federal Reserve

Ahead of the crucial August Consumer Price Index (CPI) data, the U.S. dollar has remained steady. This inflation data, arriving just a week before the Federal Reserve’s meeting to discuss interest rates, is anticipated to show a 0.6% monthly increase from the previous 0.2%, and a 3.6% rise year-on-year. While many anticipate the Fed to hold rates steady in its September session, the November meeting is more unpredictable. Recent economic data, especially from the employment sector, suggests a strong economy, sparking debates about potential rate hikes and their ramifications.

European Central Bank’s Outlook

On the European front, the Euro marked a subtle increase at $1.0753, reaching a peak of $1.0777 in prior sessions. Anticipations are high for the European Central Bank (ECB) rate verdict, especially given rumors of the ECB foreseeing the euro zone inflation to surpass 3% next year. This prediction strengthens arguments for another rate hike, despite persisting recession concerns.

Silver’s Vulnerability to Rate Alterations

Silver’s allure diminishes with climbing interest rates. If the upcoming inflation data surpasses market predictions, silver valuations might wane due to heightened expectations of a Fed rate hike this year. Contrarily, if the inflation data, especially from the energy sector, is milder than projected, silver might witness a surge.

Short-term Forecast

For silver (XAG/USD) traders, the spotlight is on the ECB’s rate decision and the U.S. CPI data. Potential outcomes could drive silver prices below the $22.50 mark. However, an unforeseen inflationary pullback might pave the way for silver’s upward trajectory. Presently, technical analyses hint at silver potentially retesting support levels between $22.66 and $22.59 per ounce. A break below these figures might push silver closer to the significant $20.00 benchmark.

Technical Analysis

4-Hour Silver (XAG/USD)Spot Silver (XAG/USD) is currently trading at $22.83, slightly below its previous 4-hour price of $22.91. The commodity is positioned beneath both the 200-4H moving average ($23.51) and the 50-4H moving average ($23.42), suggesting a bearish trend. The 14-4H RSI stands at 35.02, indicating weakened momentum and approaching oversold territory.
The current price is closely nestled above the main support area, ranging from $22.70 to $22.28. Despite being below the main resistance area ($25.00 to $25.27), the prevailing market sentiment leans bearish, with caution advised due to the near-oversold RSI conditions.

Gold Prices Forecast: XAU/USD Tensions Ahead of US Consumer Inflation Data

Gold Prices Forecast: XAU/USD Tensions Ahead of US Consumer Inflation Data

Gold Prices on the Edge: Awaiting Crucial U.S. and European Signals

Gold’s (XAU/USD) price has been on a seesaw this week, caught between macroeconomic forces and market sentiment. As spot gold lingers above a recent two-week low, investors are keenly awaiting U.S. inflation data—a significant influencer of Federal Reserve policy.

Investor Anticipation: The U.S. Inflation Factor

Spot gold trades cautiously at $1911.17 after dipping to $1,906.50 earlier this week. As the U.S. dollar index inches up by 0.2%, the market is fraught with anticipation for the U.S. Consumer Price Index (CPI) data. Some traders have opted for a tactical withdrawal, perhaps eyeing more favorable entry points post-data release.

Trading Derivatives carries a high level of risk to your capital and you should only trade with money you can afford to lose. Trading Derivatives may not be suitable for all investors, so please ensure that you fully understand the risks involved, and seek independent advice if necessary. A Product Disclosure Statement (PDS) can be obtained either from this website or on request from our offices and should be considered before entering into a transaction with us. Raw Spread accounts offer spreads from 0.0 pips with a commission charge of USD $3.50 per 100k traded. Standard account offer spreads from 1 pips with no additional commission charges. Spreads on CFD indices start at 0.4 points. The information on this site is not directed at residents in any country or jurisdiction where such distribution or use would be contrary to local law or regulation.

Interest Rates and Currency Dynamics

While the spotlight is on the U.S., the European Central Bank (ECB) is not to be overlooked. Facing its own economic headwinds, Europe’s impending rate decision could also sway the gold market. An unstable euro could trigger increased demand for gold as a safe haven, especially if the ECB opts for another rate hike.

Potential Price Directions for Gold

Should the inflation data come in hotter than expected, we could see gold plunge below the psychological $1,900 level. However, a tamer rise in inflation, particularly in energy prices, could offer gold a rebound. With traders attributing a near 50% chance for a Fed rate hike in November, gold remains at the mercy of rate expectations.

Short-term Forecast

The short-term landscape for gold (XAU/USD) is a mixed bag. A potential break below the support zone of $1,893.07 to $1,885.79 per ounce could signal a tumble towards the $1,850 level. As a non-yielding asset, gold’s attractiveness dwindles with each interest rate hike, adding another layer of complexity to its near-term outlook.

To summarize, gold prices hang in a precarious balance, driven by imminent economic data and global monetary policy shifts. The coming days are crucial, promising to either buoy or sink investor sentiment. For now, the market waits with bated breath.

Technical Analysis

4-Hour Gold (XAUUSD)The current 4-hour price of $1909.82 sits below both the 200-4H ($1923.65) and 50-4H ($1926.43) moving averages, suggesting a bearish trend. The 14-4H RSI at 33.39 also confirms an oversold condition, adding weight to a bearish sentiment.

While the price is slightly above the main support area of $1893.07 to $1885.79, it remains considerably lower than the main resistance area of $1946.99 to $1954.88. Although no minor support or resistance levels are noted, the overall market sentiment for Spot Gold appears to be bearish based on these technical indicators.

UK Economy Contracted by 0.5% in July on Slide in Service Sector Output

UK Economy Contracted by 0.5% in July on Slide in Service Sector Output

UK Economy Contracts in July

This morning, the spotlight was on the UK GDP report. Recent UK economic indicators, such as retail sales and services sector PMI numbers, indicated a deteriorating macroeconomic environment.

The UK economy contracted by 0.5% in July versus 0.5% growth in June. Economists forecast the economy to contract by 0.2%. Significantly, the July GDP Report aligned with the BoE plans to leave interest rates unchanged.

According to the Office for National Statistics,

  • All three main sectors reported contractions.
  • Service sector output declined by 0.5%, the main contributor to the fall in the headline GDP number. In June, service sector output rose by just 0.2%.
  • Consumer-facing services reported no growth in July versus growth of 0.5% in June.
  • Manufacturing production slid by 0.8%, leaving industrial production down 0.7%.

Considering the July Labor Market Overview Report, an upward trend in unemployment would likely weigh more heavily on the service sector output. The UK services sector accounts for 80% of the UK economy, suggesting a deeper contraction in August. August service PMI numbers align with a more marked August contraction.

GBP to USD Reaction to the UK GDP Report

Before the UK GDP Report, the GBP to USD pair rose to a pre-stats high of $1.25024 before falling to a low of $1.24809.

However, in response to the GDP Report, the GBP/USD pair rose to a post-stat high of $1.24862 before sliding to a low of $1.24530.

This morning, the GBP/USD was down 0.23% to $1.24580.

GBP to USD responds to UK economic contraction.
Up NextWith the UK GDP Report closing the door further on BoE rate hikes, the focus will turn to the Fed. The US CPI Report will influence market sentiment toward Fed interest rate hikes.

Economists forecast the US annual inflation rate to accelerate from 3.2% to 3.6%. However, economists expect core inflation to soften from 4.7% to 4.3%. With the markets targeting core inflation to sway the Fed toward a hold on interest rates, the focus will remain on core inflation.

Higher-than-expected figures could reignite bets on a September Fed rate hike. This could also refuel fears of a US hard landing.

Crude Oil Price Outlook: WTI Soars to Resistance as Retail Traders Become More Bearish

Crude Oil Price Outlook: WTI Soars to Resistance as Retail Traders Become More Bearish

Crude oil prices are on pace to rise over 1.8 percent this week so far, with WTI also aiming for a 4th consecutive monthly gain. In response, we can see that retail traders have been becoming increasingly bearish the commodity. This can be seen by taking a look at IG Client Sentiment (IGCS), which often functions as a contrarian indicator. With that in mind, will oil continue higher next?

Crude Oil Sentiment Outlook – Bullish

According to IGCS, only 37% of retail traders are net-long crude oil. Since the majority of them are biased to the downside, this hints prices may continue rising down the road. This is as downside exposure increased by 10.17% and 12.70% compared to yesterday and last week, respectively. With that in mind, the combination of overall exposure and recent changes offers a stronger bullish contrarian outlook.

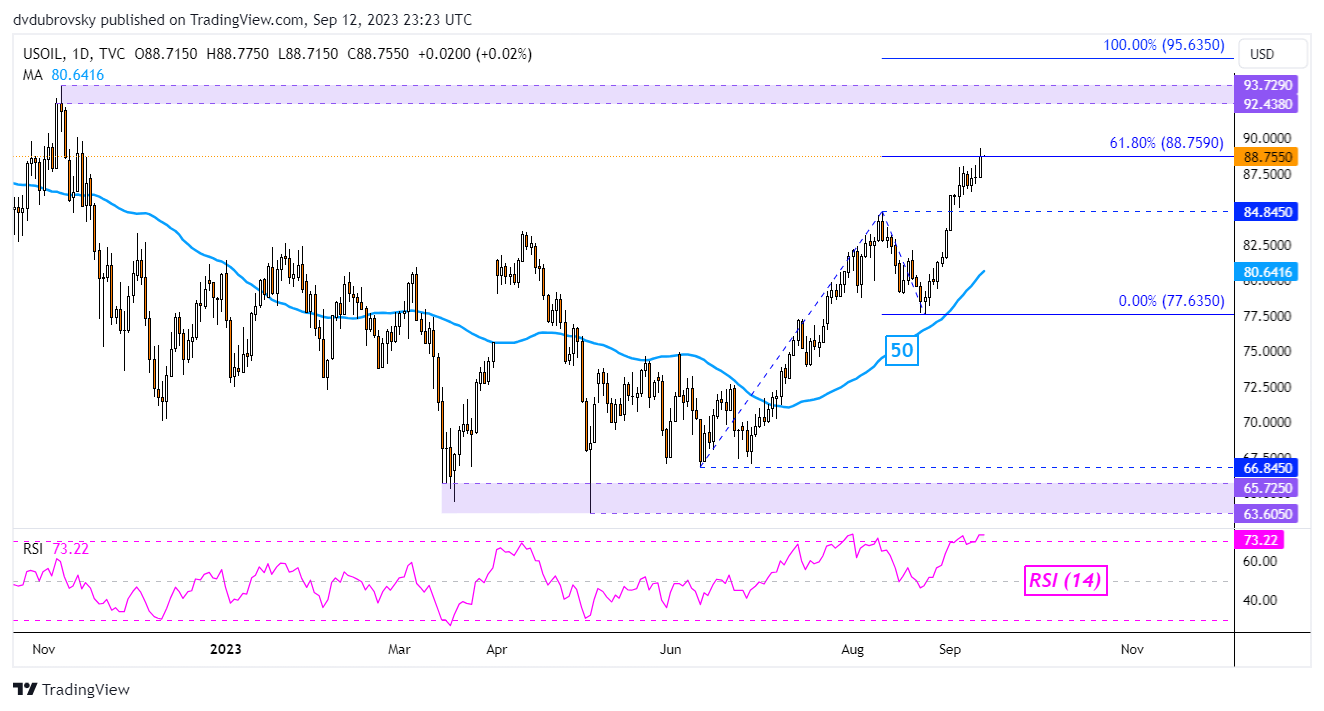
On the daily chart below, WTI has closed above a string of highs set over the past few days, reaching the highest since the middle of November. The push higher has also brought WTI to the 61.8% Fibonacci extension level at 88.75, which is immediate resistance. A confirmatory breakout higher exposes the 92.43 – 93.72 resistance zone from October.

That would open the door to an increasingly stronger bullish technical conviction. Meanwhile, immediate support seems to be the 84.84 inflection point from August. Just below that is the 50-day Moving Average, which could reinstate the broader upside focus in the event of a stronger dip lower.

Crude Oil Daily Chart

Crude Oil Daily Chart


Gold Price Slips as US Dollar Recovers Ahead of US CPI. Lower XAU/USD?

Gold Price Slips as US Dollar Recovers Ahead of US CPI. Lower XAU/USD?

The gold price dipped going into Wednesday’s trading session with the US Dollar consolidating after Monday’s rout and ahead of US CPI later today.

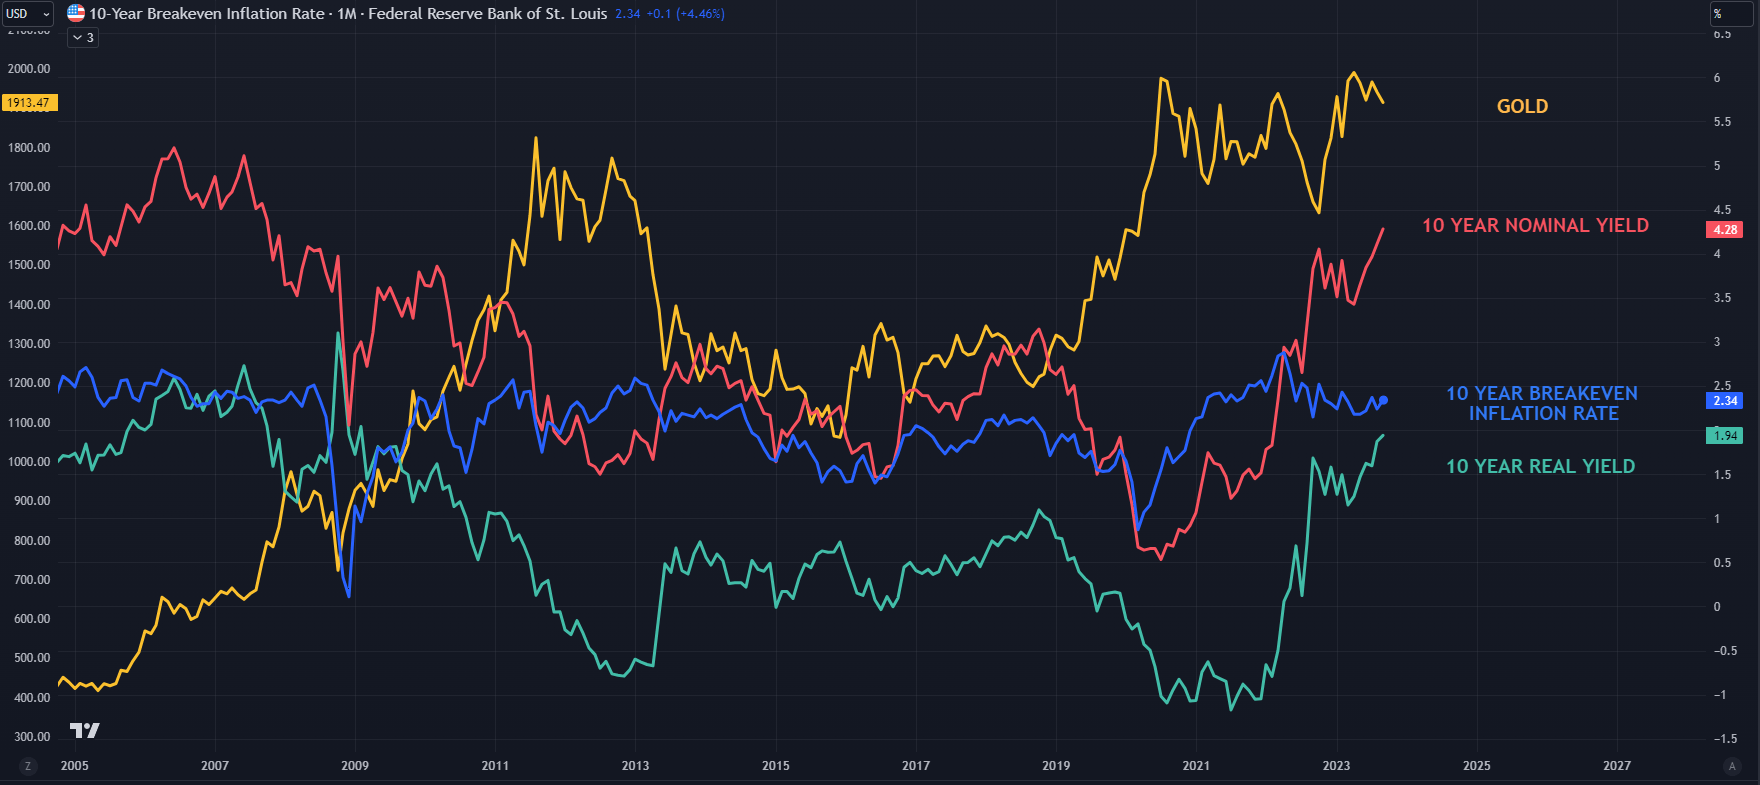
Undermining the precious metal is the continual climb of US real yields. When we step back and look at the bigger picture, the ascent of real yields might appear to be one-way traffic for now.

If today’s US CPI figure falls short of expectations, it might see long-term inflation expectations dip, adding to real yields.

If today’s US CPI figure beats estimates, it could add to worries of a tighter monetary policy from the Federal Reserve at next week’s Federal Open Market Committee (FOMC) meeting.

This could lead to the back end of the Treasury yield curve backing up, potentially underpinning real yields, particularly around the closely watched 10-year part of the curve.

A Bloomberg survey of economists is looking for headline CPI to print at 3.6% year-on-year to the end of August and 4.3% for the core reading.

Looking at the chart below, energy appears to be a notable contributing factor to CPI. Crude oil was little changed through August but it has rallied significantly in September.

image1.png

Source; Bloomberg and tastytrade

US real yields have been on the march higher for the better part of 2023 and recently stretched to a 14-year peak at the 10-year part of the curve, trading above 1.95%.

The real yield is the nominal yield less the market-priced inflation rate derived from Treasury inflation-protected securities (TIPS) for the same tenor.

It is looked at by markets as the true return of an investment as it allows for the time value of money that is impacted by price changes through inflation or deflation.

When we strip out the components of the real return, it is apparent that nominal yields have been driving real yields higher with the market-priced inflation expectations steady near 2.3%. That is slightly above the Fed’s CPI target of 2%.

The last time that real yields were this high was 2009 when spot gold was below US$ 1,000. More recently in 2018, when the real yield was near 1.0%, spot gold was under US$ 1,300 an ounce.

SPOT GOLD AGAINST US 10-YEAR REAL YIELD – THE BIGGER PICTURE

image2.png

Of course, a global pandemic and a European theatre of war have opened up a different era and consequent change in the dynamic of demand for gold.

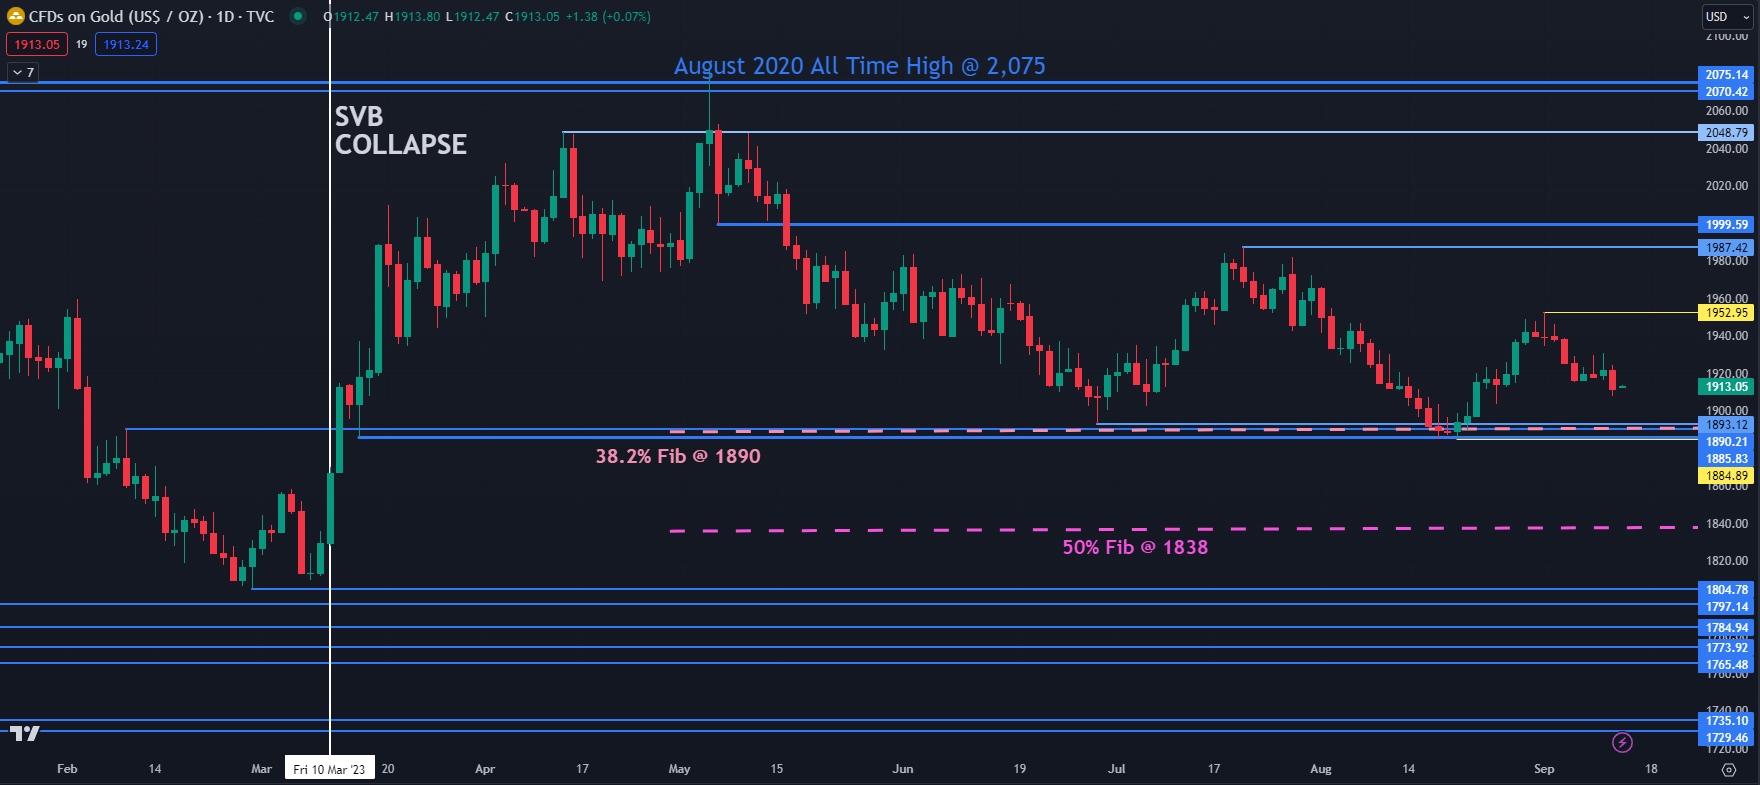
Looking ahead, a break of the recent range of US$ 1,885 – 1,900 could be the catalyst for the next notable move for XAU/USD. Click on the banner below to learn more about range trading.

GOLD TECHNICAL ANALYSIS SNAPSHOT

The gold price appears to be ensconced in the range for now, having traded between 1885 and 1897 for six months.

Support could be in the 1885 – 1895 area where there are a series of prior lows, a breakpoint, and the 38.2% Fibonacci Retracement level of the move from 1614 up to 2062.

Further down the 50% Fibonacci Retracement at 1838 might lend support.

On the topside, resistance might be at the recent peaks of 1953 and 1897 or the spsychological level of 2000 where there is also the breakpoint nearby.

SPOT GOLD CHART

image3.png


AUD/JPY IG Client Sentiment: Our data shows traders are now net-long AUD/JPY for the first time since Sep 05, 2023 18:00 GMT when AUD/JPY traded near 94.15.

AUD/JPY IG Client Sentiment: Our data shows traders are now net-long AUD/JPY for the first time since Sep 05, 2023 18:00 GMT when AUD/JPY traded near 94.15.

Number of traders net-short has increased by 9.13% from last week.

SYMBOL TRADING BIAS NET-LONG% NET-SHORT% CHANGE IN LONGS CHANGE IN SHORTS CHANGE IN OI
AUD/JPY BEARISH 50.65% 49.35% 15.92% Daily

22.63% Weekly

-2.58% Daily

9.13% Weekly

5.99% Daily

15.58% Weekly

AUD/JPY: Retail trader data shows 50.65% of traders are net-long with the ratio of traders long to short at 1.03 to 1. In fact, traders have remained net-long since Sep 05 when AUD/JPY traded near 94.15, price has moved 0.24% higher since then. The number of traders net-long is 15.92% higher than yesterday and 22.63% higher from last week, while the number of traders net-short is 2.58% lower than yesterday and 9.13% higher from last week.

We typically take a contrarian view to crowd sentiment, and the fact traders are net-long suggests AUD/JPY prices may continue to fall.

Our data shows traders are now net-long AUD/JPY for the first time since Sep 05, 2023 18:00 GMT when AUD/JPY traded near 94.15. Traders are further net-long than yesterday and last week, and the combination of current sentiment and recent changes gives us a stronger AUD/JPY-bearish contrarian trading bias.

British Pound Ahead of UK GDP: GBP/USD, EUR/GBP, GBP/JPY Setups

British Pound Ahead of UK GDP: GBP/USD, EUR/GBP, GBP/JPY Setups

The British pound is testing crucial support against the US dollar ahead of UK GDP data due later Wednesday.

The pound has been underperforming against some of its peers in recent weeks and so far, there is no sign of reversal. For more discussion on the underperformance, see “See “Pound’s Resilience Masks Broader Fatigue: GBP/USD, EUR/GBP, GBP/JPY Setups,” published August 23. The mixed UK jobs data on Tuesday did little to alter the soft bias. The blistering wage growth seals the case for a 25-basis points rate hike by the Bank of England (BoE) when it meets on September 22.

BoE Governor Andrew Bailey last week said interest rates might still rise further due to stick price pressures, but the central bank is “much nearer” to ending its tightening cycle. The key focus now shifts to UK GDP for July – expected 0.4% on-year, down from 0.9% in June. The three-month average, however, ticked up to 0.3% in July from 0.2% previously.

GBP/USD Daily Chart

image1.png

GBP/USD: Testing vital support

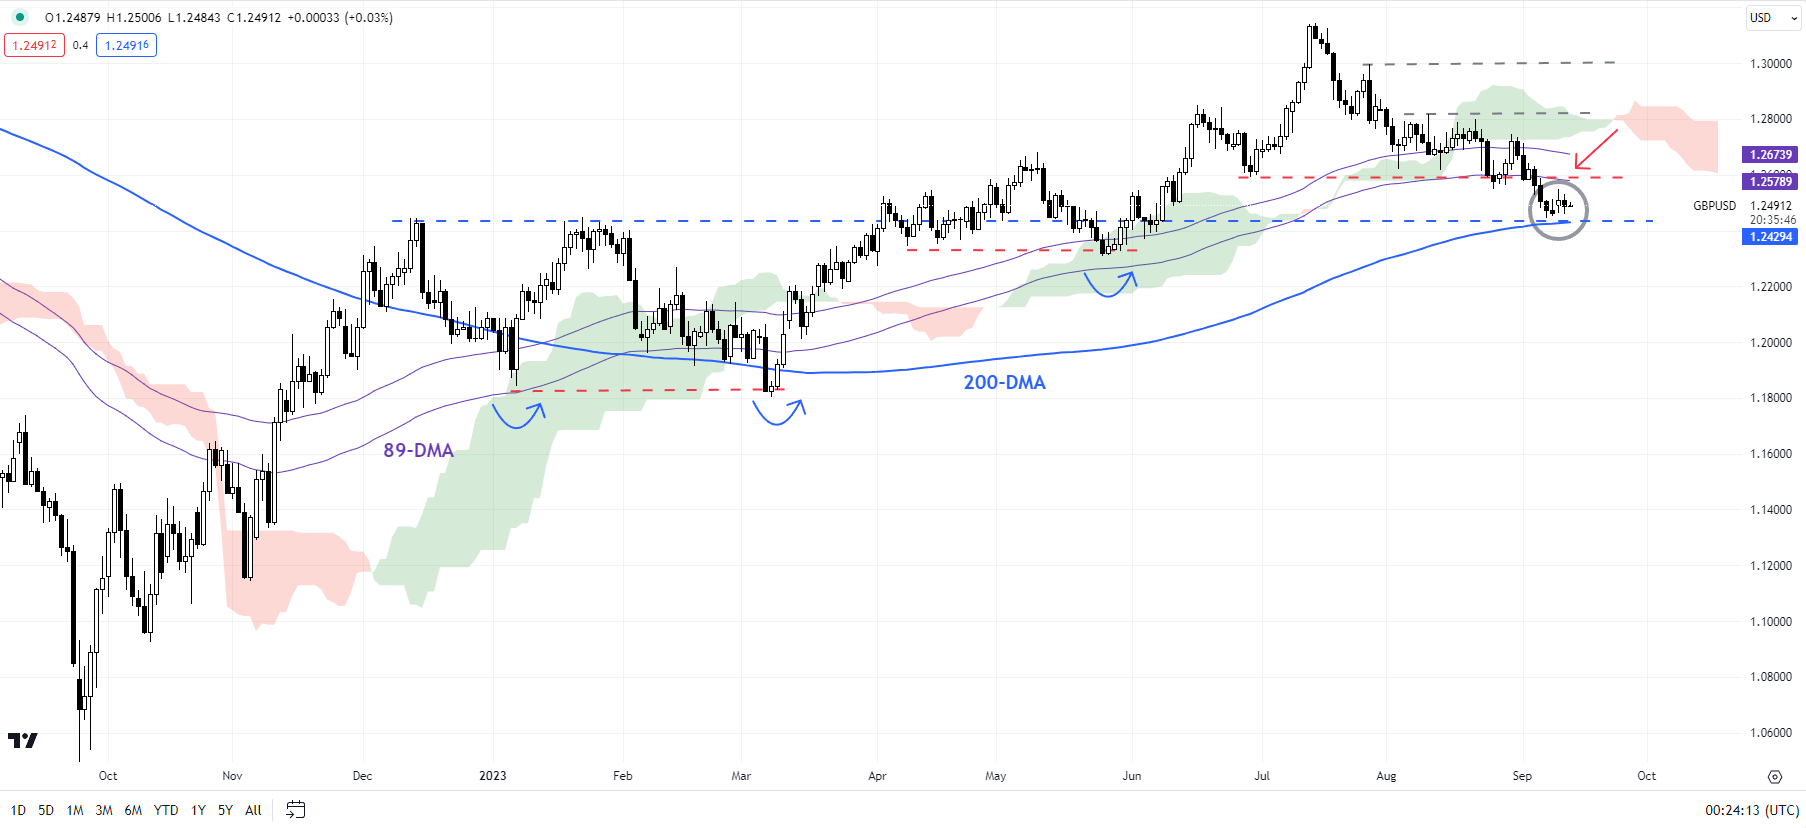
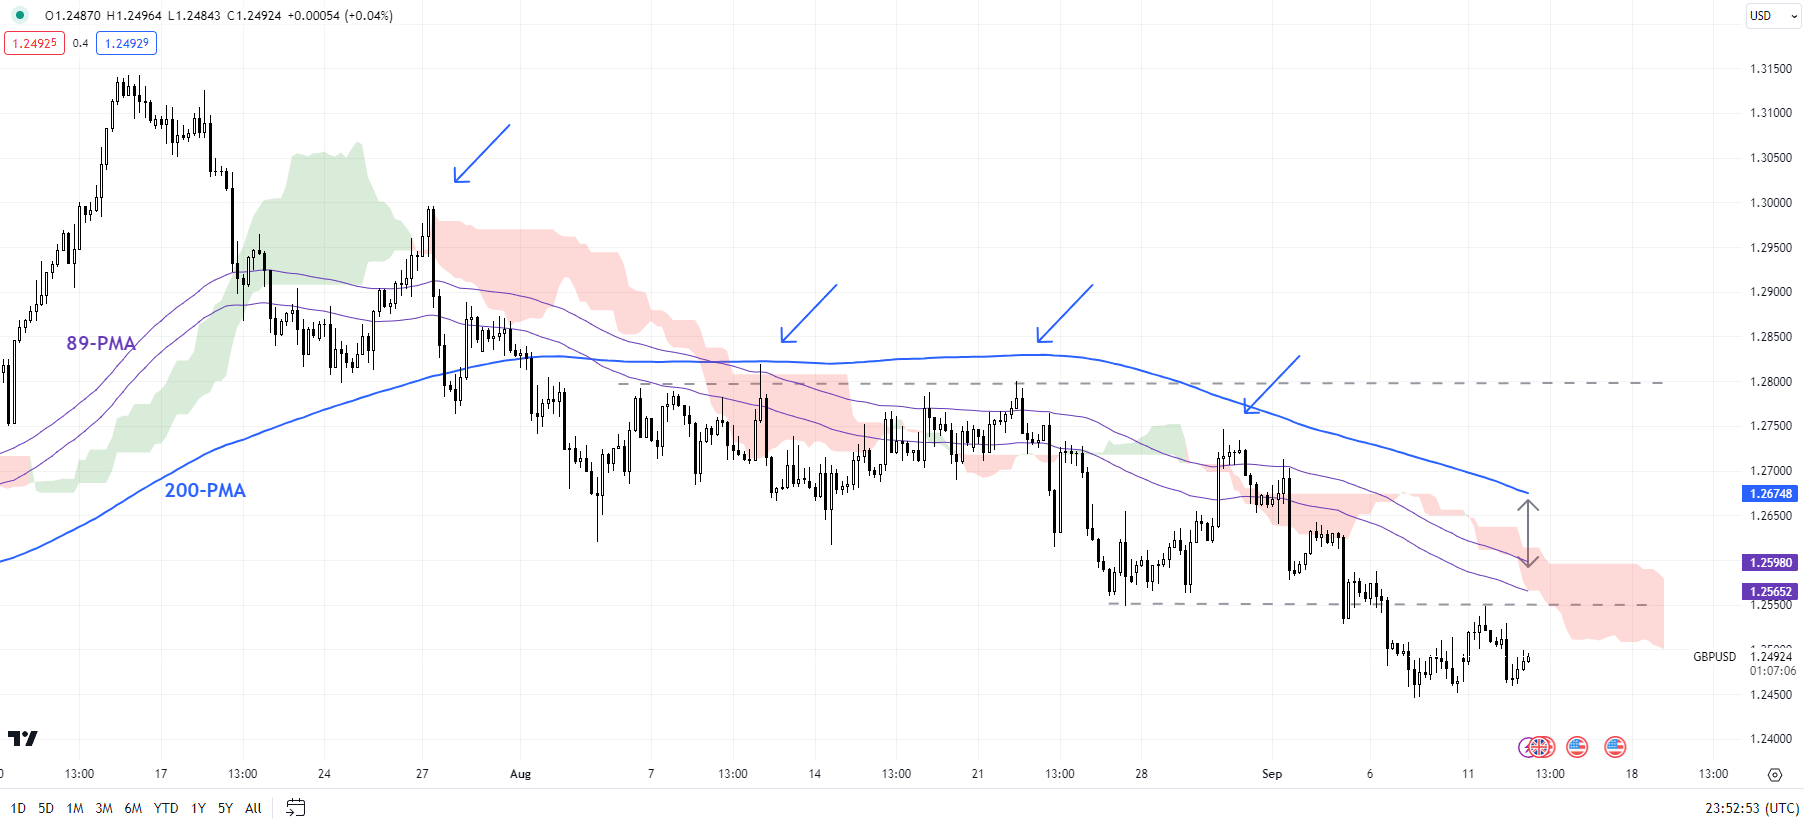
On technical charts, the failure so far this month to rise past immediate resistance at the early-August high of 1.2820 has kept the downward bias intact for GBP/USD – a risk highlighted in theprevious update. Furthermore, in a sign of weakness, GBP/USD has failed to hold above vital converged support on the 89-day moving average, the lower edge of the Ichimoku cloud on the daily charts, and the end-June low of 1.2600. On the previous two occasions since the end of 2022, the pair has rebounded from similar support (see the daily chart).

GBP/USD 240-Minute Chart

image2.png

The pair is now testing a crucial cushion on the 200-day moving average – the last time it was decisively below this average was in 2022. So, a hold above is key for the broader bias to stay constructive. From a medium-term perspective, the rise in July to a multi-month high has confirmed the higher-tops-higher-bottom sequence since late 2022, leaving open the door for some medium-term gains. (See “British Pound Buoyant Ahead of BOE: How Much More Upside?”, published May 8).

GBP/USD Monthly Chart

image3.png

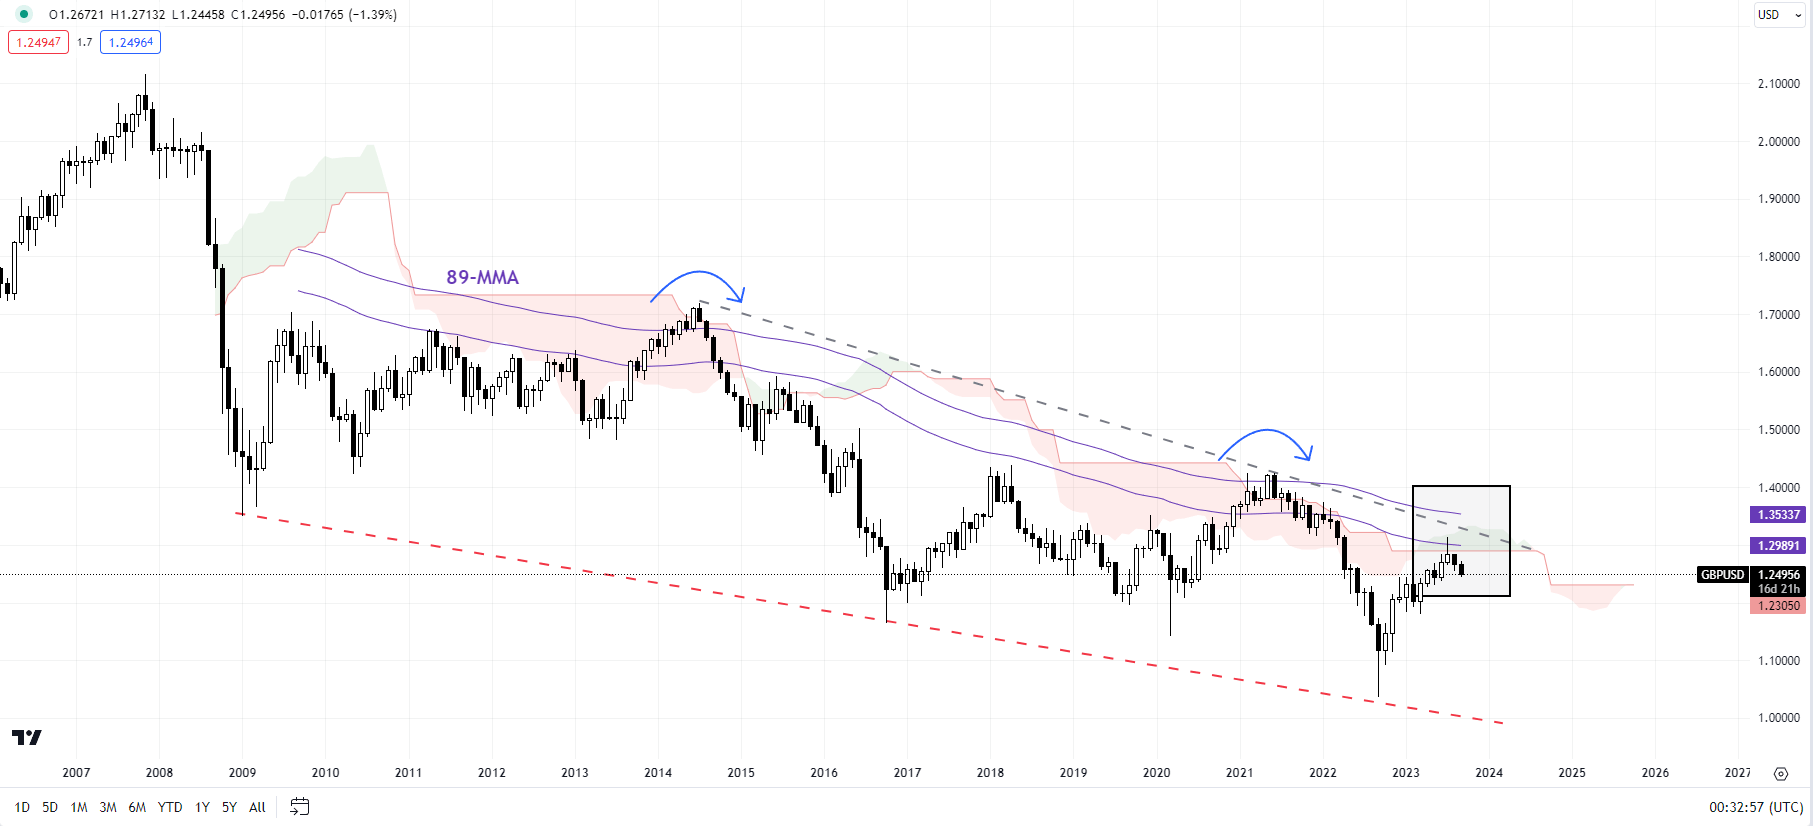
Importantly, as pointed out late last year, a higher high this year (relative to 2022) could be unfolding into something more than just a corrective rebound, that is, it opens the door for a reversal of GBP/USD’s medium-term downtrend (first highlighted in October – see “GBP/USD Technical Outlook: Forming an Interim Base?” published October 3.

Whether the medium-term rebound is the start of a long-term uptrend? To be fair, such evidence is lacking. GBP/USD remains below major resistance on the 89-month moving average and the Ichimoku cloud on the monthly charts, coinciding with a downtrend line from 2014, suggesting the long-term downtrend is yet to reverse.

EUR/GBP Daily Chart

image4.png

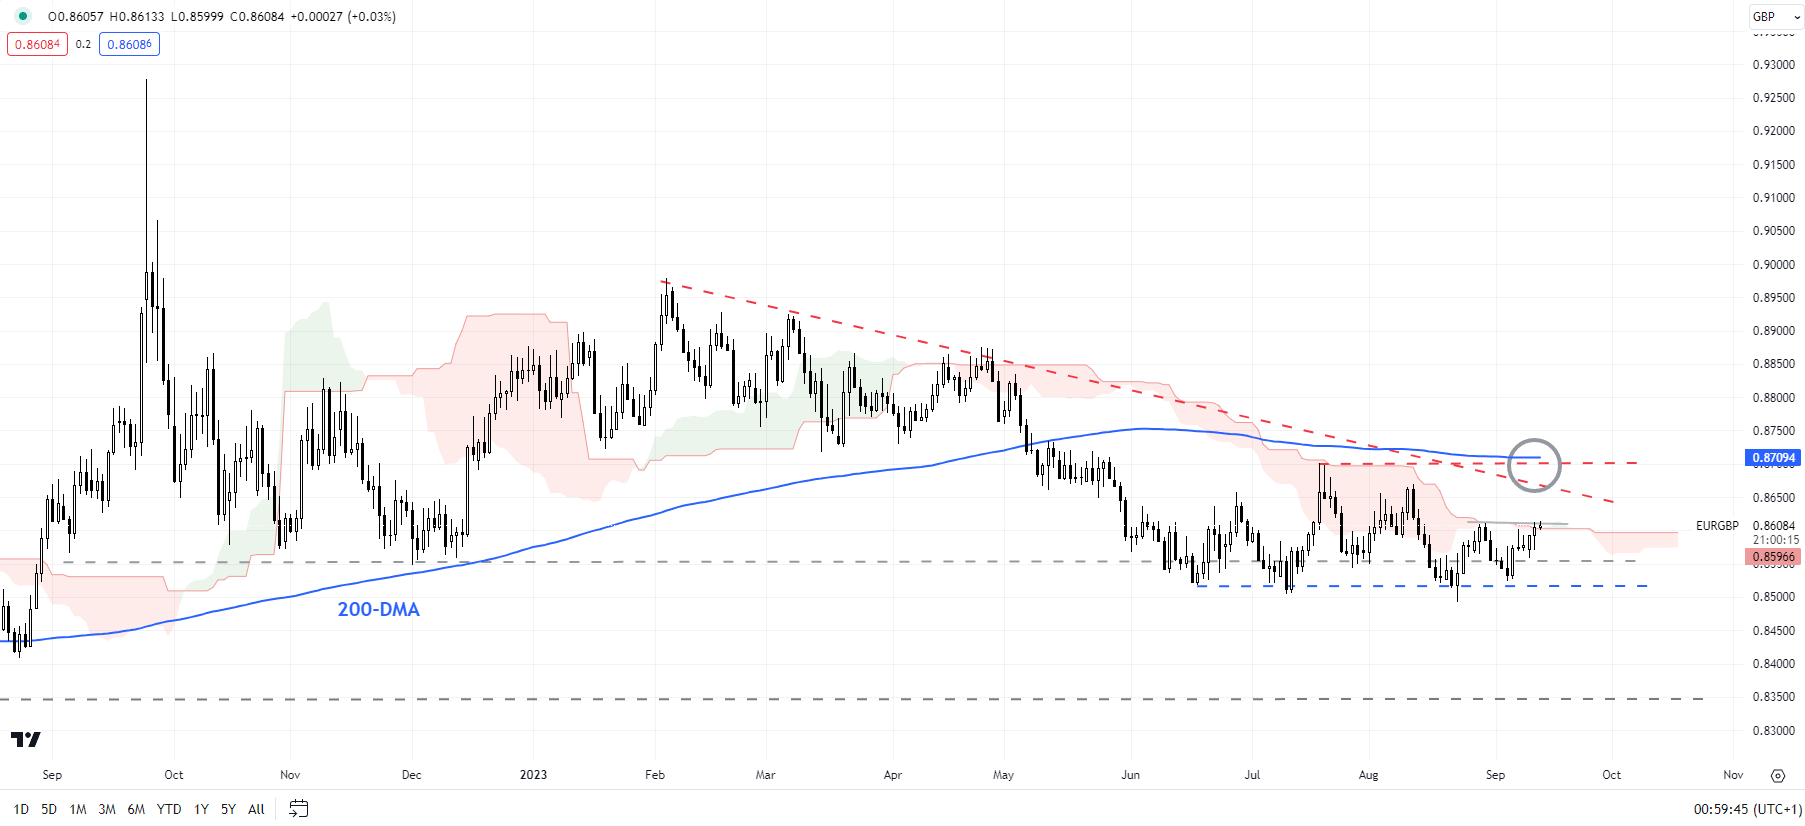
EUR/GBP: Still holding above Q2-2023 support line

EUR/GBP continues to hold above the converged floor on a horizontal trendline from June and another horizontal trendline since late 2022 (at about 0.8550-0.8600). Still, unless the cross clears resistance at the mid-July high of 0.8700, the path of least resistance is sideways to down.

GBP/JPY Daily Chart

image5.png

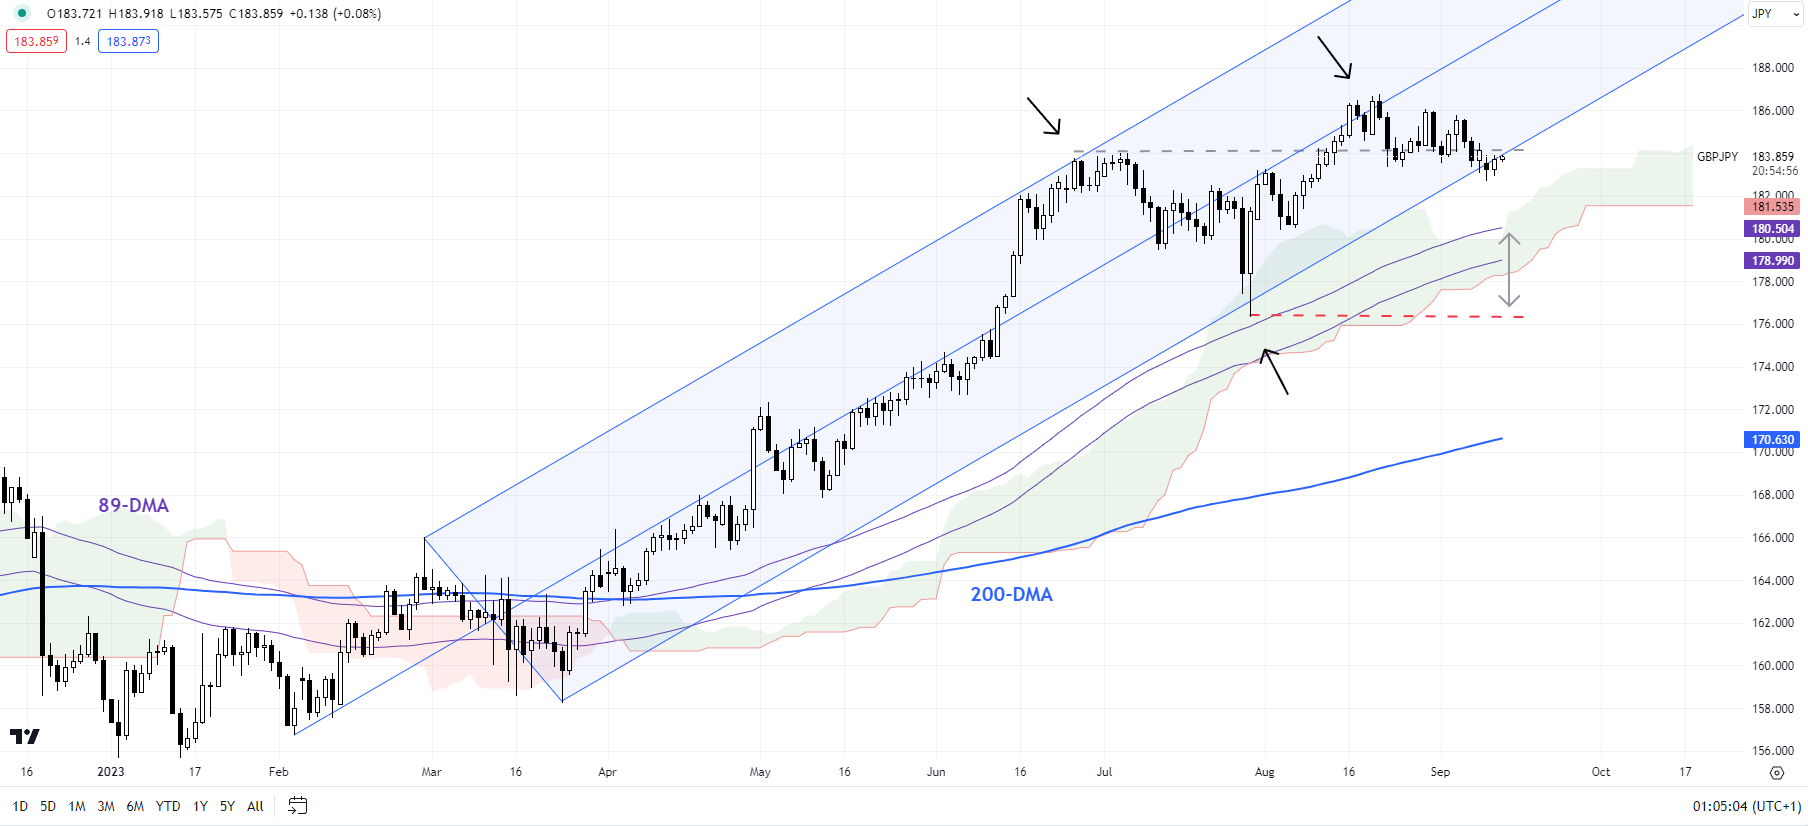
GBP/JPY: Consolidation within the uptrend

GBP/JPY has continued to be well-guided by the rising Pitchfork channel since early 2023. However, most recently the cross has been struggling to hold above the resistance-turned-support at the July high of 184.00. A decisive break below would indicate that the immediate upward pressure had faded but won’t necessarily imply a reversal of the broader uptrend. Only a break below the July low of 176.25 would puncture the broader uptrend.

Asia Day Ahead: Eyes on US CPI ahead, Brent crude prices at new 10-month high

Asia Day Ahead: Eyes on US CPI ahead, Brent crude prices at new 10-month high

Major US indices turned in weaker overnight, with the Nasdaq reversing its previous day’s gains, as big tech stocks faltered despite Treasury yields little changed. Apple’s new product launch failed to impress, prompting a 1.7% overnight drop in its share price. Its new iPhone selling prices seeing not much of an increase seems to provide testament to the still-soft demand for the global smartphone market, despite some improvement in global shipments in 2Q 2023.

Ahead, all eyes will be on the US Consumer Price Index (CPI) data tonight, with the story likely to revolve around a resurgence in headline pricing pressures, but also further cooling in US core inflation. The headline inflation is expected to head higher to 3.6% from a year ago, up from the previous 3.2%. On the other hand, the core aspect is expected to moderate to 4.3% from previous 4.7%, with the key focus on whether a softer core inflation read will be sufficient for the Fed to keep rates on hold into next year.

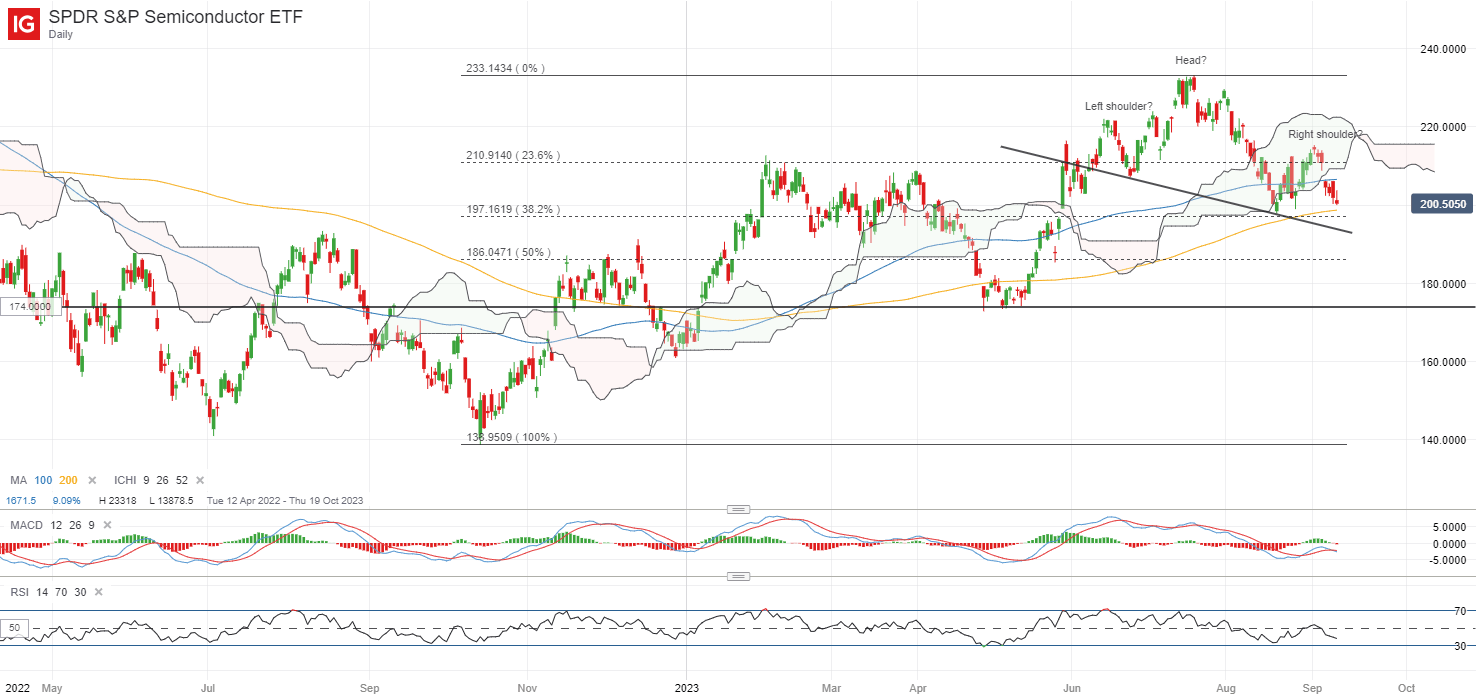
The US dollar is little changed into today’s session, while US equity futures tread on their usual wait-and-see. Perhaps one to watch ahead may be the SPDR S&P Semiconductor ETF, which seems to display a potential head-and-shoulder pattern in formation. The neckline support at the 193.00 level may be crucial for buyers to defend, failing to do so may potentially pave the way to retest its May 2023 bottom at the 174.00 level next. Its weekly relative strength index (RSI) is currently back at its neutral 50 level, which may suggest a point of reckoning ahead.

image1.png

Asia Open

Asian stocks look set for a mixed open, with Nikkei +0.27%, ASX -0.62% and KOSPI +0.44% at the time of writing. Higher oil prices may keep an overall cautious mood in place, given that most economies in the region are net oil importers, while little moves around the US dollar may also call for some wait-and-see ahead of the US CPI release. Chinese equities largely remain in its subdued state, as investors also look towards a slew of economic data out of China this Friday, where the trend of downside surprises over the past months may keep sentiments in check for now.

The economic calendar this morning saw South Korea’s unemployment rate head to a new record low in August (2.4% versus previous 2.8%), which may call for the Bank of Korea (BOK) to retain a hawkish stance and some policy flexibility for additional tightening if needed. That said, the USD/KRW did not see much of a move in today’s session, reflecting some reservations over prevailing growth risks justifying a prolonged rate hold for now. On the other hand, Japan’s wholesale inflation for August saw its eighth straight month of moderation, which provide room for the Bank of Japan (BoJ) for a more gradual policy normalisation process.

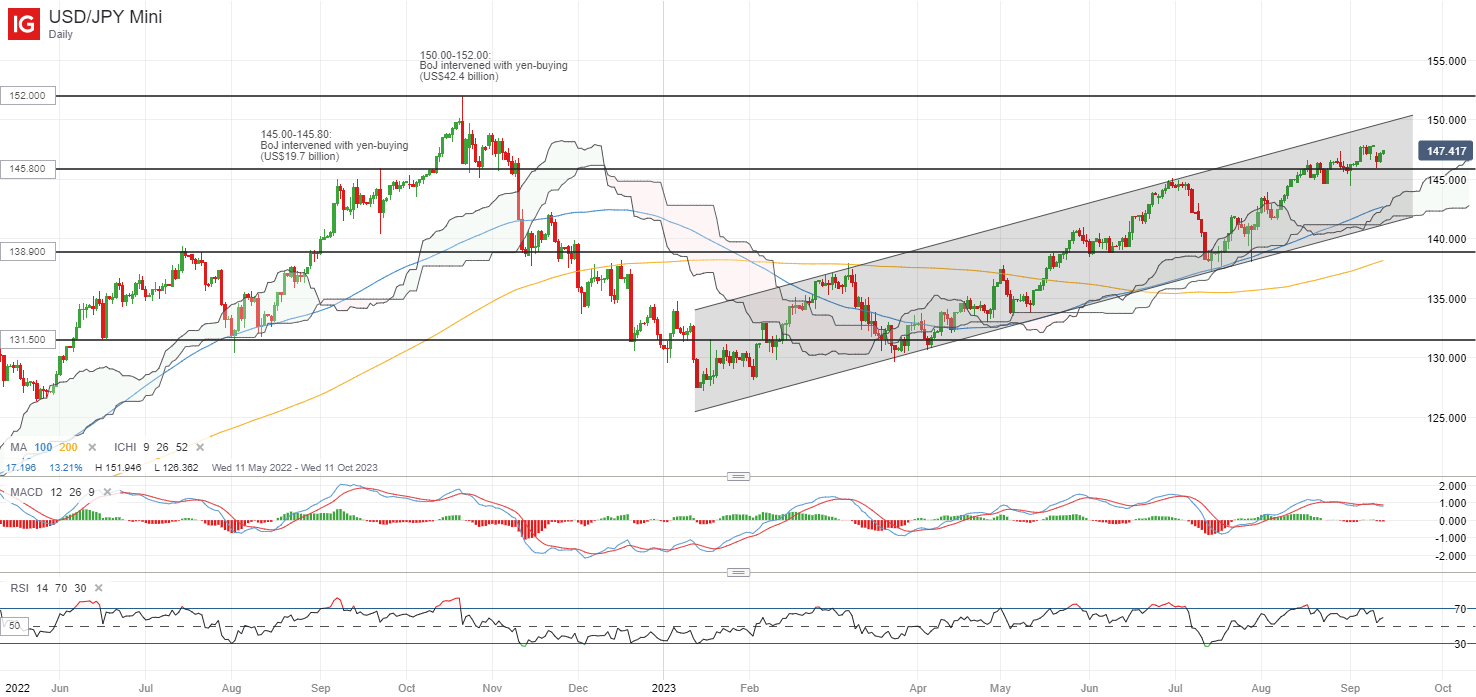
Upon a retest of the 145.80 level of support, the USD/JPY is back on its climb, further validating the level as a key support to defend for buyers. An ascending channel pattern remains broadly in place since the start of the year, which keep the overall trend bias to the upside. Further move above its early-September high could place the 149.90 level on watch next – the next level of yen-buying intervention by the BoJ back in October 2022.

image2.png

On the watchlist: Brent crude prices continue its ascent to new 10-month high

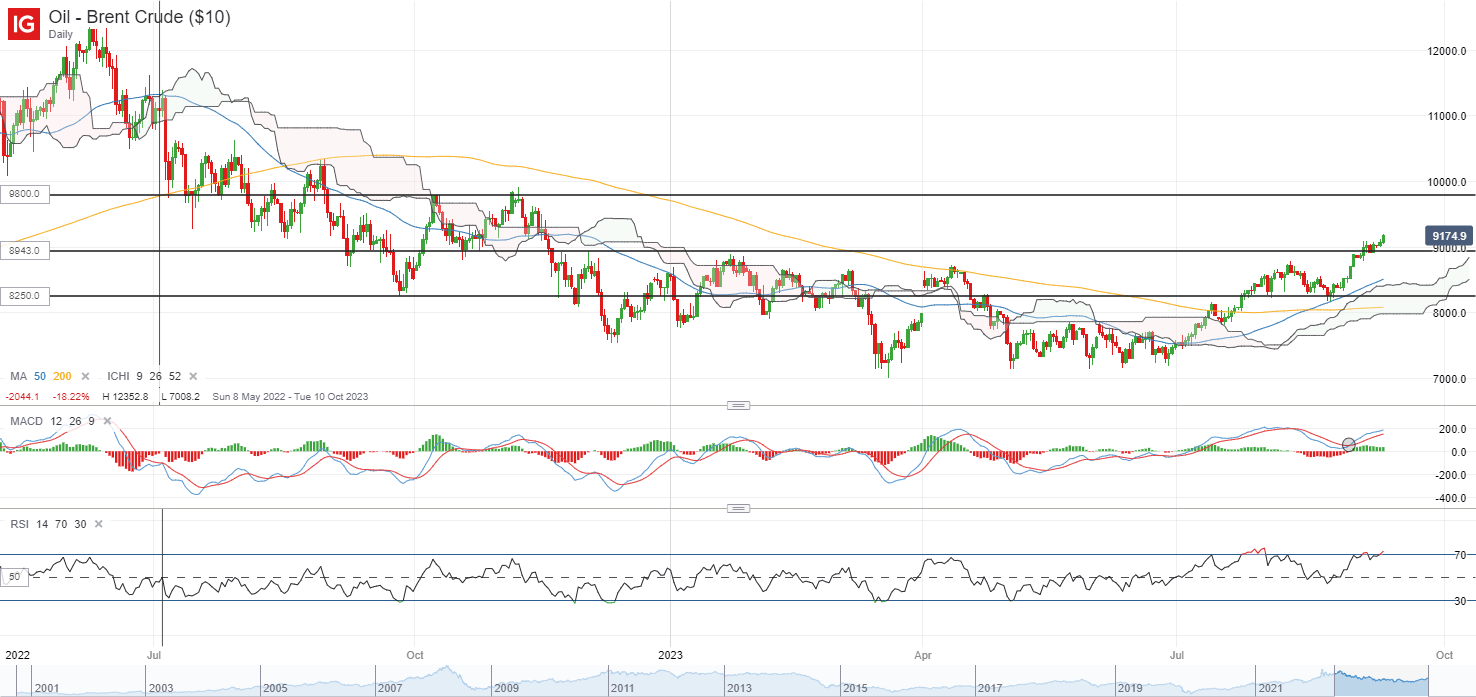
Following a slight consolidation over the past week, oil prices have resumed its ascent to deliver a new 10-month high overnight, successfully defending its key US$90.00 level for Brent crude. The latest surprise build in US crude oil API data may serve as a slight dampener, but given that the trend from the official inventory data (EIA) over the past month is still on heavy drawdowns, while the US Strategic Petroleum Reserve (SPR) inventories remain around its 40-year low, it may have to take more than a single data to overturn the tight-supplies narrative.

A firm stick by OPEC to its optimistic forecast for global oil demand into next year also provides some reassurances for the prevailing upward trend in oil prices since July this year. For now, as technical conditions head into near-term overbought territory, the US$90.00 will be on watch as immediate support to hold, while prices eye for a retest of the US$98.00 level ahead.

image3.png