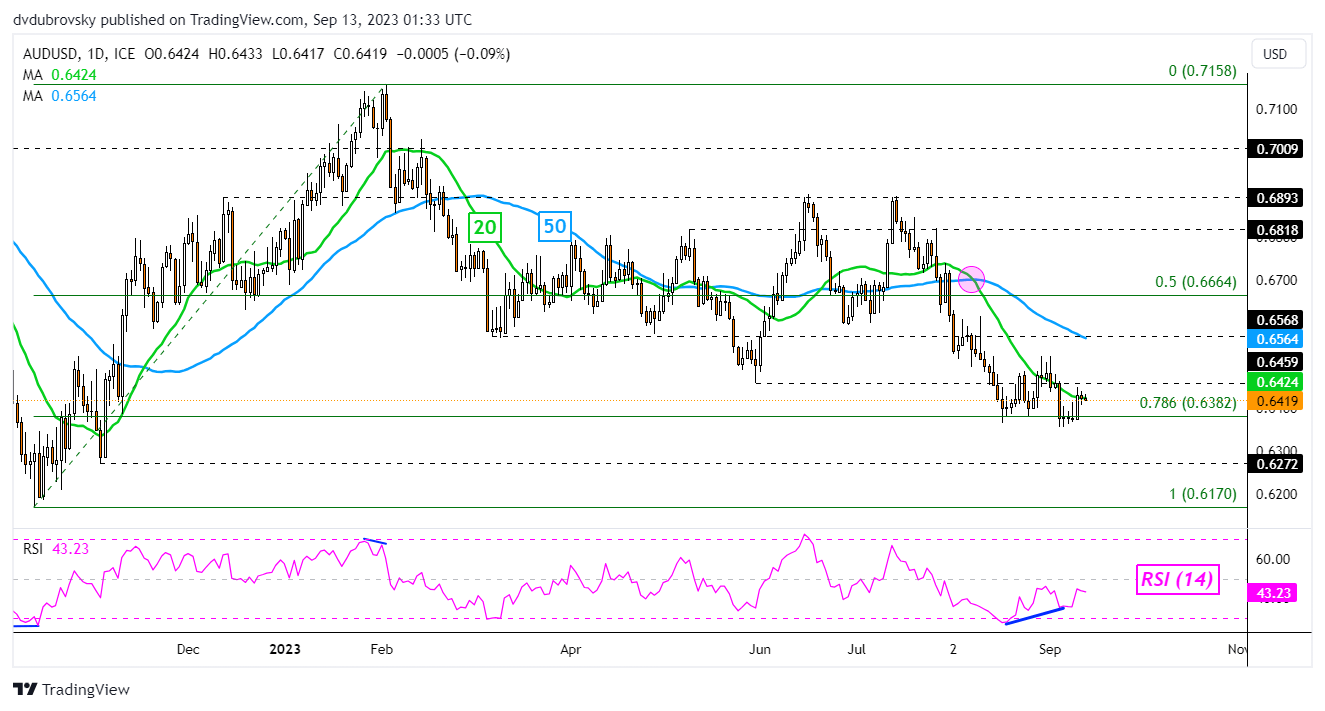
The Australian Dollar is hovering just above key support against the US Dollar, which is the 78.6% Fibonacci retracement level at 0.6382. Meanwhile, as prices struggled to break lower, positive RSI divergence emerged, showing that downside momentum was fading. This can at times precede a turn higher.
For now, the 20-day Moving Average (MA) held as resistance, preventing AUD/USD from pushing much higher. Moreover, a bearish Death Cross with the 50-day MA remains in play. The latter could hold as resistance, maintaining the broader downside focus.
If not, a drop through support would expose the November low of 0.6272 on the way toward the 2022 low of 0.617.
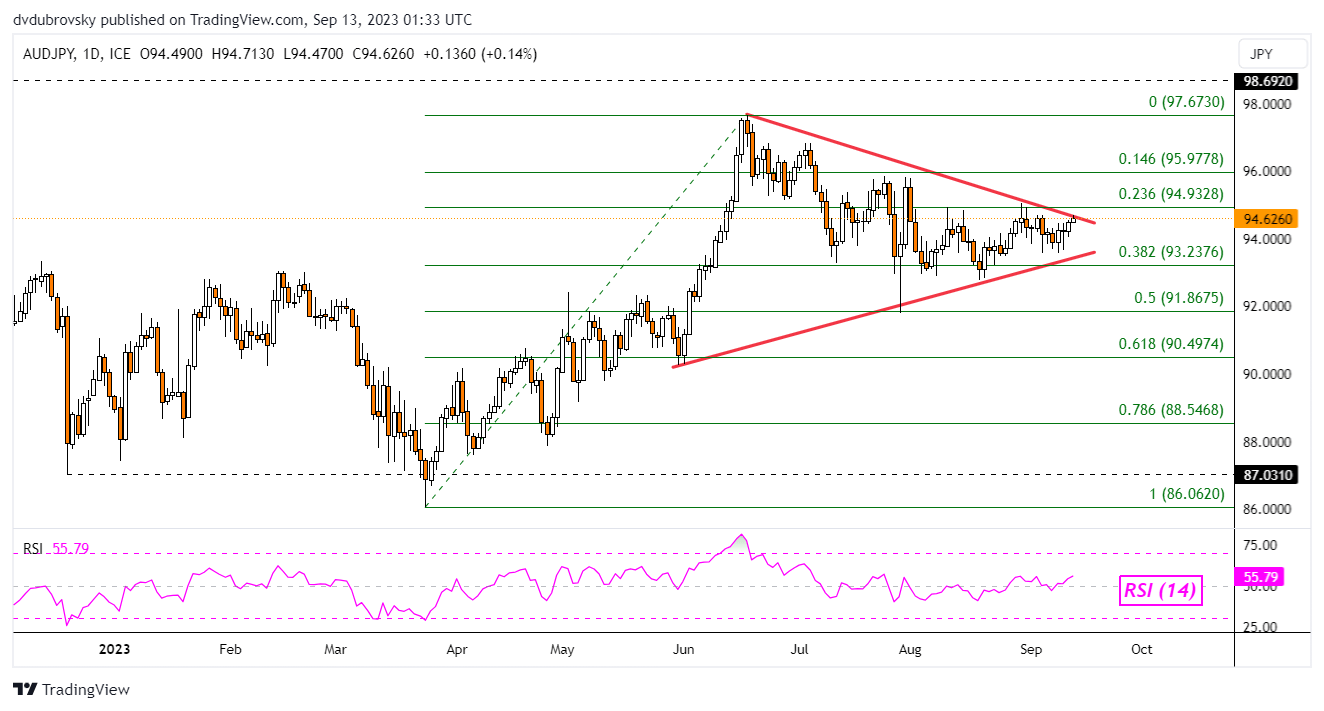
Against the Japanese Yen, the Australian Dollar continues to face a Symmetrical Triangle chart formation. This was created via the falling trendline from June and the rising support line from May. AUD/JPY is quickly running out of room to consolidate within this pattern.
The direction of the breakout could be key for the coming trend. A breach above resistance exposes the 23.6% Fibonacci retracement level of 94.93. Confirming a breakout above this point could open the door to a stronger bullish technical conviction.
That would place the focus on the minor 14.6% level at 95.97 before the current 2023 high of 97.67 kicks in. Otherwise, breaking lower places the focus on the 38.2% point at 93.23. Confirming lower offers a stronger bearish technical conviction towards the midpoint of the retracement at 91.86.
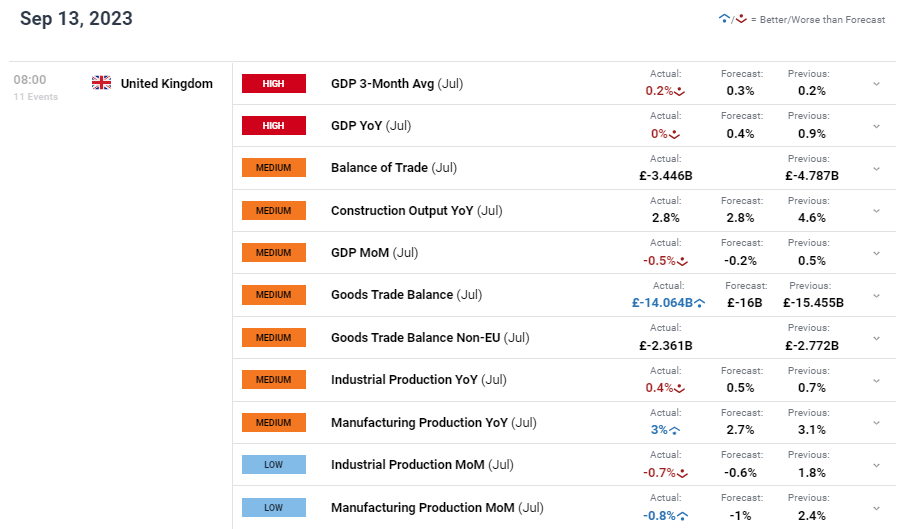
The British pound looks to enter the European trading session on the backfoot after UK GDP (see economic calendar below) missed on both 3-month average and YoY figures respectively. The MoM print is quite surprising in that the economy contracted by 0.5% (quickest pace in 7 months!) as opposed to the 0.2% expected. In contrast to the prior print, the UK economy seems to be slowing despite some positives in manufacturing and trade balance figures. A high interest rate environment is clearly weighing on economic growth. Yesterday UK labor data showed some weakness as well which has supplemented today’s downside move post-GDP.
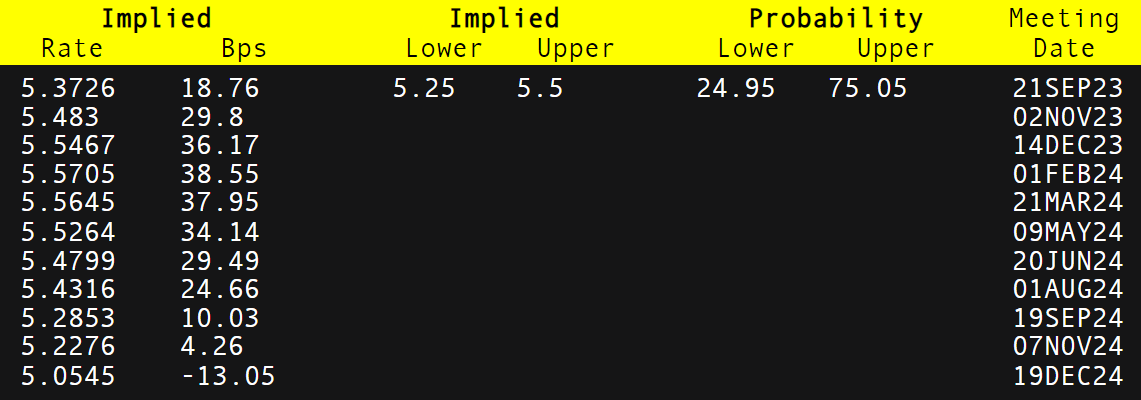
Bank of England (BoE) market expectations (refer to table below) did not see any material change and remain in favor of a 25bpsrate hike later this month. All eyes now shift to US CPI later today with any upside surprise likely taking out key support zones on GBP/USD.
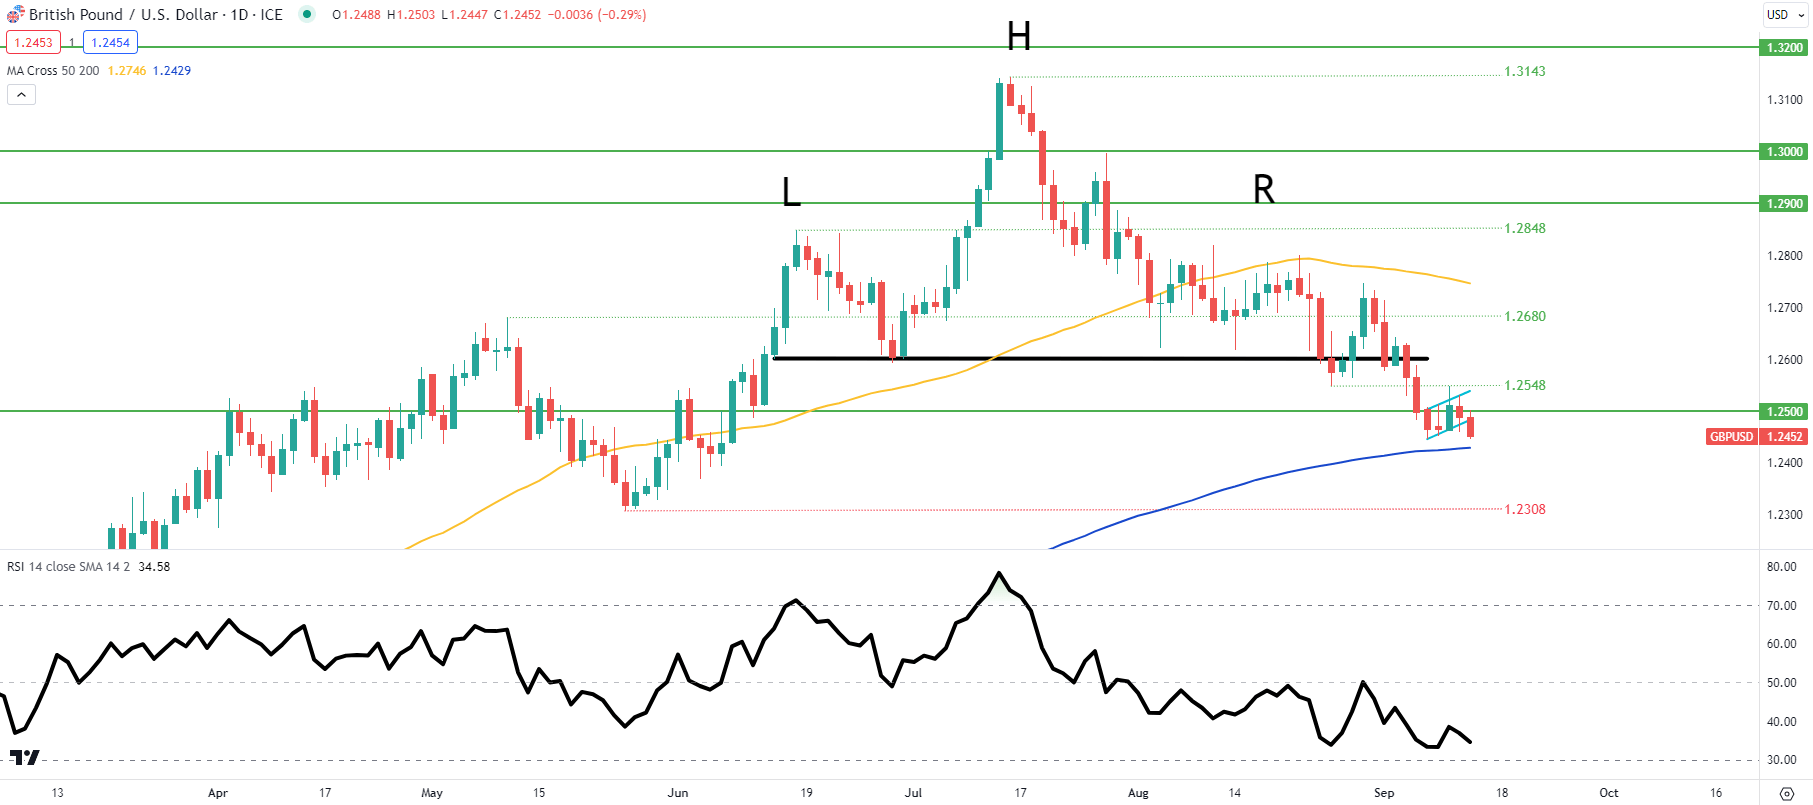
Price action on the daily cable chart has broken below bear flag support (light blue) as bears push towards the all important 200-day moving average (blue) as mentioned in my IG risk event for the week. A daily confirmation close is still required to confirm the breakout, placing more importance on US CPI.
German Economic Sentiment: Mixed Signals in September
In September, the German ZEW Economic Sentiment Index displayed a surprising resilience, registering at -11.4, a considerable improvement from its August score of -12.3. This figure surpassed market anticipations which were pegged at a more dismal -15.0. This upward tick offers a hint of cautious optimism among market watchers.
In contrast, the Current Situation Index took a plunge, nosediving to -79.4 from its previous position at -71.3, failing to meet the market’s projected figure of -75.0. This drop underscores growing concerns over Germany’s immediate economic landscape.
Adding to the complexity, the Eurozone’s ZEW Economic Sentiment Index for the same period deteriorated, registering at -8.9, a descent from August’s -5.5. Such figures suggest that broader European sentiment isn’t mirroring Germany’s tentative optimism.
However, looking at the broader picture, despite the more pessimistic view on Germany’s current economic condition compared to August 2023, the future might hold a silver lining. The uptick in the six-month economic horizon expectations indicates a burgeoning hope among experts. Furthermore, the international stock markets’ increasingly optimistic outlook adds another layer of positivity. This upbeat stance seems to derive, in part, from the growing consensus among experts who foresee stable interest rates in both the Eurozone and the USA.
Short-Term Forecast: Cautiously Bullish
For the short term, Germany’s economic sentiment hints at a bullish trend. Despite the prevailing uncertainties, the market is showing signs of resilience, buoyed by expectations of stable interest rates in major economies and the anticipation of a more lenient interest rate policy in China.
Brent crude futures remained steady, floating just above $90 a barrel this Tuesday. This stasis came as investors worldwide turned their eyes to impending macroeconomic data which might signal if Europe and the U.S. persist in their rate hike trajectory. Notably, last week saw Brent achieve the $90 milestone, a high not seen in nearly 10 months. This upswing was chiefly catalyzed by Saudi Arabia and Russia’s revelation of prolonged voluntary supply cuts—totaling a combined 1.3 million barrels per day—set to continue through year’s end.
Supply Cuts amidst Global Concerns
These announced supply reductions largely eclipse burgeoning concerns over China’s economic pulse. As global oil demand wanes, the curtailed supply chiefly compensates for this slump. To add, unforeseen disruptions might enter the fray, given the severe storms and floods wreaking havoc in eastern Libya. These natural calamities have necessitated the shutting down of major oil export hubs, such as Ras Lanuf and Brega.
Trading Derivatives carries a high level of risk to your capital and you should only trade with money you can afford to lose. Trading Derivatives may not be suitable for all investors, so please ensure that you fully understand the risks involved, and seek independent advice if necessary. A Product Disclosure Statement (PDS) can be obtained either from this website or on request from our offices and should be considered before entering into a transaction with us. Raw Spread accounts offer spreads from 0.0 pips with a commission charge of USD $3.50 per 100k traded. Standard account offer spreads from 1 pips with no additional commission charges. Spreads on CFD indices start at 0.4 points. The information on this site is not directed at residents in any country or jurisdiction where such distribution or use would be contrary to local law or regulation.
European Refinery Dynamics
Europe, on the other hand, is gearing up for a rather tepid refinery maintenance season this fall. The primary drive? Refiners’ ambition to capitalize on surging margins. Current projections by Wood Mackenzie consultancy suggest a 40% YoY decline in offline refinery capacity in Europe, landing at around 800,000 bpd.
Awaiting Key Macroeconomic Indicators
This week is heavy with anticipation. Stakeholders are keenly awaiting a swath of macroeconomic data that will unveil whether central banks, particularly in the U.S. and Europe, will persist with their aggressive rate-increase endeavors. Central to this is the U.S. August consumer price index (CPI) data slated for release on Wednesday. This index might very well chart the course for future interest rate adjustments.
Short-Term Forecast: Bullish yet Cautious
Overall, while Brent remains bullish, treading above the $90 mark, the market is awash with caution. Key indicators, including reports from stalwarts like the International Energy Agency (IEA) and the Organization of the Petroleum Exporting Countries (OPEC), will likely shape the narrative in the coming days. Notably, the IEA recently trimmed its 2024 oil demand growth forecast, pointing to subdued macroeconomic conditions. In contrast, OPEC’s August dispatch maintained its 2.25 million bpd growth forecast for the same year.
Technical Analysis
The current 4-hour price of Light Crude Oil Futures stands at $87.66, slightly up from the previous close at $87.32. The price is positioned above the 200-4H moving average ($82.27) and marginally above the 50-4H moving average ($86.02), indicating bullish momentum. The 14-4H RSI reads 61.05, suggesting stronger momentum but not yet overbought.
Regarding support and resistance levels, the primary support lies between $84.89 and $83.81, while the main resistance ranges from $90.10 to $93.74. With the price hovering above both mentioned moving averages and a positive RSI reading, the market sentiment leans bullish.
The DAX gained 0.39% on Monday. Following a 0.14% rise on Friday, the DAX ended the session at 15,901. Significantly, the DAX enjoyed a two-day winning streak for the first time since August.
China Inflation Delivers Support
China consumer and producer prices for August drove demand for riskier assets. The producer price index fell by 3.0% year-over-year in August versus -4.4% in July. Consumer prices increased by 0.1% year-over-year versus a 0.3% decline in July.
Trading Derivatives carries a high level of risk to your capital and you should only trade with money you can afford to lose. Trading Derivatives may not be suitable for all investors, so please ensure that you fully understand the risks involved, and seek independent advice if necessary. A Product Disclosure Statement (PDS) can be obtained either from this website or on request from our offices and should be considered before entering into a transaction with us. Raw Spread accounts offer spreads from 0.0 pips with a commission charge of USD $3.50 per 100k traded. Standard account offer spreads from 1 pips with no additional commission charges. Spreads on CFD indices start at 0.4 points. The information on this site is not directed at residents in any country or jurisdiction where such distribution or use would be contrary to local law or regulation.
The slower rate of decline in producer prices and rise in consumer prices suggested a moderate pickup in demand at the producer and retail levels.
Italian industrial production figures failed to dampen the mood despite a larger-than-expected fall in production. Industrial production fell by 0.7% in July (June: +0.5%).
Bets Rise on the Fed Ending Its Monetary Policy Tightening Cycle
According to figures from Monday, 1-Year US Consumer Inflation Expectations increased from 3.55% to 3.63%. The figures aligned with economic forecasts for the US inflation rate to rise from 3.2% to 3.6% in August. Despite economists predicting an uptick in headline inflation, economists forecast core inflation to soften from 4.7% to 4.3%.
Softer core inflation could close the door on further rate hikes, supporting riskier assets.
The Monday Market Movers
MTU Aero was the worst performer, tumbling by 12.10% on inspection plans and financial burden news.
However, banks and auto stocks were among the front runners for the second session.
Commerzbank and Deutsche Bank rose by 1.98% and 1.92%, respectively. Daimler Truck Holding led the auto sector, rallying 2.37%.
Inflation numbers from China and easing bets on further Fed rate hikes provided support.
Today’s Session
German wholesale prices for August will draw interest early in the European session. A less marked decline in the wholesale rate of inflation would signal a pickup in demand.
However, German and Eurozone ZEW Economic Sentiment numbers will likely have more impact on buyer appetite. Economists forecast the German ZEW Economic Sentiment Index to fall from -12.3 to -15.0 and the Eurozone Index to decline from -5.5 to -6.2.
While the ZEW Survey is unlikely to influence the ECB monetary policy decisions, a marked decline would signal darker clouds ahead for the German economy.
The DAX Futures was up 24 points this morning.
Inflation and Fed Rate Hike Bets Remain Key Drivers
Easing bets on further ECB and Fed rate hikes continue to support the DAX. However, investors will be mindful of the likely influences of the US CPI Report on the global financial markets.
On Wednesday, economists predict the US CPI Report will reveal softer core inflation. The expectation of softer core inflation continues to fuel bets on the Fed ending its monetary policy tightening cycle.
There are no US economic indicators to consider before the CPI Report. The lack of stats leaves US Treasury Yields and the US equity markets to provide late direction.
Short-Term Forecast
Investor sentiment toward Fed and ECB policy intentions continues to offset recessionary jitters. However, cracks in the US economy could redirect the focus to the economic outlook, which remains DAX-negative.
DAX Technical Indicators
Daily Chart
The DAX avoided the trend line and 15,663 support level on Monday. However, the 50-day EMA rejected a DAX run at the 16,007 resistance level.
Better-than-expected German wholesale prices and German ZEW Economic Sentiment figures would give the DAX another run at the 50-day EMA. A break above the 50-day EMA would give the bulls a look at the 16,007 resistance level.
However, weaker-than-expected ZEW numbers would see the DAX test the trend line. A break below the trend line would bring the 15,663 support level into play.
The 14-Daily RSI reading of 48.63 shows the DAX has room to fall through the trend line and 15,663 support level before entering oversold territory.
DAX 120923 Daily Chart
4-Hourly Chart
The DAX holds above the 50-day EMA but below the 200-day EMA, sending bullish near-term but bearish longer-term price signals.
A hold above the 50-day EMA would support a break above the 200-day EMA to target the 16,007 resistance level. However, a break below the 50-day EMA would give the bears a run at the trend line.
The 51.88 RSI reading indicates the DAX can rise to 16,000 before entering overbought territory.
The EUR/USD rose by 0.49% on Monday. Following a 0.02% gain on Friday, the EUR/USD ended the day at $1.07502. The EUR/USD fell to a low of $1.07072 before rising to a high of $1.07593.
ZEW Economic Sentiment in the Spotlight
German and Eurozone ZEW Economic Sentiment figures will draw investor interest today. A more marked decline in economic sentiment would signal a gloomier economic outlook.
Trading Derivatives carries a high level of risk to your capital and you should only trade with money you can afford to lose. Trading Derivatives may not be suitable for all investors, so please ensure that you fully understand the risks involved, and seek independent advice if necessary. A Product Disclosure Statement (PDS) can be obtained either from this website or on request from our offices and should be considered before entering into a transaction with us. Raw Spread accounts offer spreads from 0.0 pips with a commission charge of USD $3.50 per 100k traded. Standard account offer spreads from 1 pips with no additional commission charges. Spreads on CFD indices start at 0.4 points. The information on this site is not directed at residents in any country or jurisdiction where such distribution or use would be contrary to local law or regulation.
Economists forecast the German ZEW Economic Sentiment Index to fall from -12.3 to -15.0 and the Eurozone ZEW Economic Sentiment Index from -5.5 to -6.2.
A gloomier outlook would support bets on the ECB to leave interest rates unchanged on Thursday.
US Inflation Remains the Focal Point
The US CPI Report for August remained the focal point this morning. While the markets are betting on the Fed leaving interest rates unchanged this month, uncertainty lies ahead.
According to the CME FedWatch Tool, the probability of a 25-basis point September Fed rate hike stood at 7% versus 8% on Friday. In contrast, there was a 41.2% chance of a 25-basis point November rate hike versus 43.6% on Friday.
Hotter-than-expected core inflation figures could refuel bets on a November Fed rate hike. The high level of uncertainty will likely test buyer appetite, with no Fed speakers to influence during the FOMC blackout period.
Short-Term Forecast:
Monetary policy bets have supported a EUR/USD return to $1.07. However, the macroeconomic environment remains a headwind for the EUR/USD. A continued trend of deteriorating economic indicators would leave the EUR/USD on the defensive.
EUR/USD Price Action
Daily Chart
The EUR/USD remained below the 50-day and 200-day EMAs, reaffirming bearish price signals. German economic indicators must beat forecasts to support a break above the $1.07635 resistance level to target $1.08.
However, weaker-than-expected ZEW Economic Sentiment numbers would bring sub-$1.07 into play. A fall to sub-$1.07 would give the EUR/USD a run at the $1.06342 support level.
The 14-period Daily RSI at 39.32 indicates a EUR/USD return to sub-$1.0650 before entering oversold territory.
EURUSD 120923 Daily Chart
4-Hour Chart
The EUR/USD holds below the 200-day and 50-day EMAs, reaffirming the bearish price signals. A break above the $1.07635 resistance level would give the bulls a run at the trend line and 200-day EMA.
However, weaker-than-expected euro area economic indicators would bring sub-$1.07 into play.
The 14-period 4-Hourly RSI at 39.32 indicates the EUR/USD has room to fall to $1.0650 before entering oversold territory.
Silver (XAG/USD) prices dipped on Tuesday, as financial markets eagerly anticipate U.S. inflation data that could impact future interest rate decisions. The Federal Reserve’s recent signaling of potential policy tightening further underlines the significance of the forthcoming data.
Economic Indicators and Their Implications
Silver’s Monday boost came from the dollar’s pullback, benefiting traders transacting in different currencies. However, the dollar’s 0.5% decline was offset by an uptick in the 10-year Treasury note yields, constraining silver’s growth. The Wednesday release of the U.S. Consumer Price Index (CPI) has traders on high alert. August 2023’s CPI report is expected to showcase a slowdown in consumer price growth compared to last year, despite recent hikes in gasoline prices. The anticipated 3.6% inflation increase for August, if realized, would be a rise from July’s 3.2%, while core CPI, which omits volatile items like food and energy, is predicted to show a yearly growth of 4.3%, down from July’s 4.7%.
Trading Derivatives carries a high level of risk to your capital and you should only trade with money you can afford to lose. Trading Derivatives may not be suitable for all investors, so please ensure that you fully understand the risks involved, and seek independent advice if necessary. A Product Disclosure Statement (PDS) can be obtained either from this website or on request from our offices and should be considered before entering into a transaction with us. Raw Spread accounts offer spreads from 0.0 pips with a commission charge of USD $3.50 per 100k traded. Standard account offer spreads from 1 pips with no additional commission charges. Spreads on CFD indices start at 0.4 points. The information on this site is not directed at residents in any country or jurisdiction where such distribution or use would be contrary to local law or regulation.
The Federal Reserve’s Strategy
The Federal Reserve’s long-term goal is to achieve a 2% inflation rate. Despite recent decreases in both headline and core inflation rates, meeting this target in the immediate future appears challenging. With an economy that’s outperformed expectations, it might be some time before inflation aligns with the Fed’s desired levels. Currently, the Fed is closely observing data, and its decisions on interest rates will heavily rely on core inflation trends.
Market Predictions and Silver’s Path Forward
The CME FedWatch tool showcases a 93% probability that the Federal Reserve will maintain interest rates during its September meeting. However, there’s a 41% chance of an interest rate hike come November. For silver prices to breach the $26.00 threshold, a combination of factors is necessary: the Federal Reserve needs to be less aggressive, and both the dollar index and Treasury yields should diminish. While the market waits for the CPI data, it’s expected to remain somewhat stagnant. An on-target or above-expectation CPI figure might dampen silver’s prospects shortly.
Short-Term Forecast: Bearish Possibilities
Silver’s short-term trajectory seems uncertain, especially given the dollar’s recovery preceding the CPI release. Despite its resilience amid a strengthening dollar and increasing U.S. yields, sustained silver growth might necessitate a Federal Reserve shift towards rate reductions.
After Monday’s Surge The stock market hinted at a potential dip early Tuesday, a stark contrast to Monday’s upbeat mood. As of 07:57 GMT, Dow Jones, S&P 500, and Nasdaq 100 futures were pointing south, reflecting cautious investor sentiment.
Oracle’s Slip and Wall Street’s Gains
In an unexpected turn, Oracle’s shares dwindled by 9% in post-market activities, despite surpassing Wall Street’s earnings expectations. This was primarily due to its failure to meet revenue benchmarks set by LSEG. On a brighter note, Monday was positive for Wall Street: Nasdaq led with a 1.1% jump, trailed by the S&P 500 and Dow, which rose by 0.7% and 0.3%, respectively.
Trading Derivatives carries a high level of risk to your capital and you should only trade with money you can afford to lose. Trading Derivatives may not be suitable for all investors, so please ensure that you fully understand the risks involved, and seek independent advice if necessary. A Product Disclosure Statement (PDS) can be obtained either from this website or on request from our offices and should be considered before entering into a transaction with us. Raw Spread accounts offer spreads from 0.0 pips with a commission charge of USD $3.50 per 100k traded. Standard account offer spreads from 1 pips with no additional commission charges. Spreads on CFD indices start at 0.4 points. The information on this site is not directed at residents in any country or jurisdiction where such distribution or use would be contrary to local law or regulation.
Key Market Movers
Tesla and Qualcomm emerged as notable players. Tesla shares soared by 10%, a direct result of Morgan Stanley’s favorable upgrade. Qualcomm, meanwhile, enjoyed a near 4% hike, riding high on its announcement to supply Apple with 5G modems till 2026.
Federal Reserve and the Rate Debate
The Federal Reserve’s policy direction is keenly awaited, with a majority (93%) of market insiders predicting unchanged interest rates, as per CME Group’s FedWatch Tool. Steve Forbes, while discussing the mixed economic landscape, resonated with this sentiment. He expects the Federal Reserve to maintain the status quo in their next meeting, scheduled from Sept. 19 to 20.
Tech Scene: AI’s Prominence and Arm’s Potential
Arm’s forthcoming IPO is generating significant interest, with its valuation potentially hitting the $50 billion mark. Nvidia’s success story, attributed to generative AI models like OpenAI’s ChatGPT, contrasts with Arm’s architecture-centric approach. While Arm’s present revenues are smartphone-driven, its future might be intertwined with on-device AI, establishing it as a potential powerhouse in AI on the “edge.”
In Summary: Navigating Economic Indicators
As analysts dive into this week’s economic reports, unexpected figures might lead to market volatility. The general outlook, however, hinges on the much-anticipated inflation data and the Federal Reserve’s stance on interest rates, making it a crucial week for traders.
The GBP to USD pair rose by 0.36% on Monday. Reversing a 0.06% loss from Friday, the GBP/USD ended the day at $1.25089. A choppy session saw the pair fall to a low of $1.24631 before rising to a high of $1.25480.
UK Labor Market Overview Moves the GBP/USD
The UK Labor Market Overview Report drew significant interest this morning. Last week, Bank of England Governor Andrew Bailey poured cold water on further BoE interest rate hikes.
Trading Derivatives carries a high level of risk to your capital and you should only trade with money you can afford to lose. Trading Derivatives may not be suitable for all investors, so please ensure that you fully understand the risks involved, and seek independent advice if necessary. A Product Disclosure Statement (PDS) can be obtained either from this website or on request from our offices and should be considered before entering into a transaction with us. Raw Spread accounts offer spreads from 0.0 pips with a commission charge of USD $3.50 per 100k traded. Standard account offer spreads from 1 pips with no additional commission charges. Spreads on CFD indices start at 0.4 points. The information on this site is not directed at residents in any country or jurisdiction where such distribution or use would be contrary to local law or regulation.
The BoE Governor expects a sharp fall in inflationary pressure before the end of the year, removing the need for further rate hikes. However, tighter labor market conditions or a pickup in wage growth could test the pause theory.
Tighter labor market conditions lead to an upward trend in wages. Higher wages would fuel consumption and demand-driven inflation. Raising interest rates typically counteracts these effects, dampening labor markets, wage growth, and consumption.
UK Wage Growth to Test the BoE Pause Theory
The UK unemployment rate rose from 4.2% to 4.3% in July. However, wage growth accelerated in July. Average earnings + bonuses rose by 8.5% in July versus 8.4% in June. Economists forecast the UK unemployment rate to increase from 4.2% to 4.3% and for average hourly earnings + bonuses to rise by 8.2%.
The wage growth figures will draw the interest of Monetary Policy Committee members.
US CPI Report Looms Large
Easing market bets on further Fed rate hikes continued to impact investor appetite for the dollar. Investors are expecting softer US core inflation figures to support the Fed ending its interest rate tightening cycle.
According to the CME FedWatch Tool, the probability of a September Fed hold on interest rates was 93% versus 92% on Friday. In contrast, there was a 57.6% chance of a November pause versus 53.0% on Friday.
The shift in sentiment toward the Fed interest rate outlook leaves the GBP/USD at risk of a sharp pullback.
Hotter-than-expected US core inflation figures could refuel Fed rate hike bets. No FOMC members are on the calendar to speak ahead of the US CPI Report. The FOMC entered the blackout period on Saturday. FOMC members refrain from discussing monetary policy during the blackout period.
Short-Term Forecast
Macroeconomic indicators suggest further downside potential for the GBP/USD pair despite the wage growth numbers. However, a shift in sentiment toward the Fed interest rate trajectory would offer near-term GBP/USD support.
GBP to USD Price Action
GBPUSD 120923 Weekly Chart
Daily Chart
The GBP/USD pair sat below the trend line. However, the GBP/USD held above the 200-day EMA while remaining below the 50-day EMA. The EMAs sent bearish near-term but bullish longer-term prices signals.
The rise in the UK unemployment rate should ease upward forces on wage growth, allowing the BoE to hit the brakes on rate hikes. Should the GBP/USD break below the 200-day EMA, it could approach the $1.24410 support level.
However, rising bets on BoE rate hikes to tame inflation would support a run 50-day EMA and $1.26815 resistance level.
The 14-period daily RSI reading of 38.50 shows the GBP/USD pair can fall to the $1.24410 support level before entering oversold territory.
GBPUSD 120923 Daily Chart
4-Hourly Chart
The GBP/USD remains below the 200-day and 50-day EMAs, reaffirming bearish price near-term signals. A GBP/USD break above the 50-day EMA would give the bulls a run at $1.26 and the 200-day EMA. However, the GBP/USD would need BoE commentary to affirm the need to tackle wage growth to target the 200-day EMA.
The 48.10 14-period 4-hourly RSI shows the GBP/USD can retest the 1.24410 support level before entering oversold territory.
While the week is still fresh, the Euro is seemingly on course for its first 5-day gain since July, potentially ending an 8-week losing streak. In response, retail traders have been becoming more bearish. This can be seen by taking a look at IG Client Sentiment (IGCS), which often functions as a contrarian indicator. With that in mind, could EUR/USD aim higher from here?
EUR/USD Sentiment Outlook – Bullish
The IGCS gauge shows that about 63% of retail traders are net-long EUR/USD. Since most of them are still biased to the upside, this hints that prices may continue falling down the road. This is as downside exposure increased by 24.53% and 12.26% compared to yesterday and last week, respectively. With that in mind, recent changes in exposure warn that the current price trend may reverse higher.
Euro Daily Chart
On the daily chart, EUR/USD has formed a bullish Morning Star candlestick pattern. This is after positive RSI divergence has been showing fading downside momentum, which can at times precede a turn higher. At this stage, confirmation of the candlestick pattern is lacking. Upside progress from here could open the door to extending upward.
Still, prices remain below the 200-day Moving Average and the falling trendline from July. These could prove to be formidable obstacles, maintaining the dominant downside bias. As such, while a near-term reversal is possible, the broader horizon remains bearish.





 Chat now!