Australian Dollar Holds High Ground as US Dollar Slips. Will Rates Drive AUD/USD?

Australian Dollar Holds High Ground as US Dollar Slips. Will Rates Drive AUD/USD?

The Australian Dollar saw a significant uptick at the beginning of the week, maintaining its momentum into Tuesday’s trading session. The sharp move up has been largely attributed to the weakening of the US Dollar across the board.

The weakness in the ‘big dollar’ began with USD/JPY collapsing in the aftermath of comments from Bank of Japan Governor Kazuo Ueda.

He appeared to intimate that its negative interest rate policy (NIRP) might be reviewed later in the year if economic and price conditions turn upward.

His comments saw Japanese Government bond yields hit their highest level since early 2014 with the benchmark 10-year bond trading over 0.70%.

Treasury yields underperformed on Monday relative to most other global government bonds but not so much against Australian Commonwealth Government Bonds (ACGB).

The spread between Australian and US bonds continues to favour the US Dollar when looking at the closely followed 2- and 10-year part of the curve.

AUD/USD, DXY (USD) INDEX, 2- AND 10-YEAR AU-US BOND SPREADS

image1.png

Looking ahead, traders will be keenly eyeing the release of Australian retail sales data for August, scheduled to be announced on Thursday. This data is of paramount importance as it provides critical insight into consumer spending patterns, which account for a substantial portion of overall economic activity.

Moreover, the unemployment rate, a key indicator of the health of the Australian economy, is projected to remain steady near multi-generational lows at 3.7%. This low unemployment rate is indicative of a robust labour market, which can contribute to stronger consumer confidence and spending, thereby potentially bolstering retail sales.

The RBA left rates on hold last week at 4.10% and the interest rate market is ascribing only a low probability of any further hikes in this cycle.

It appears that the third quarter CPI, due to be released on October 25th, is the crucial data point that might shift the needle on the RBA’s thinking around monetary policy.

The RBA has hiked by 400 basis points (bps) since the pandemic lows near zero, while the Federal Reserve has hiked by 525 bps.

It could be argued that the more aggressive stance at the short end of the curve may have led to higher yields in the back of the Treasury than that of the ACGB curve.

While the RBA seems to have put the cue back in the rack, the market is pricing in one more hike by the Fed by the end of this year before easing in 2024.

Adjustments in the disparity of monetary policy between the RBA and the Fed might be a driver for the Aussie going forward. For more information on how to trade AUD/USD, click on the banner below.

US FEDERAL RESERVE TARGET RATE MARKET PRICING
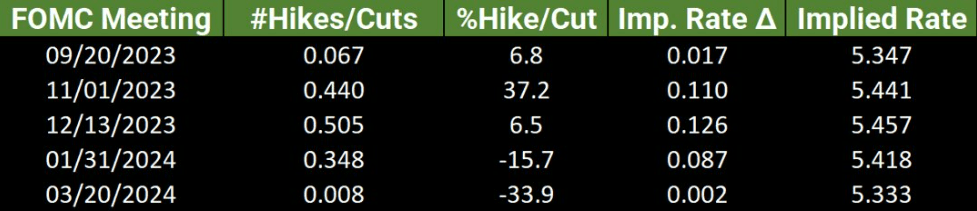
image2.png

Gold and Silver Technical Update: Falling Resistance, Symmetrical Triangle in Focus

Gold and Silver Technical Update: Falling Resistance, Symmetrical Triangle in Focus

XAU/USD Analysis

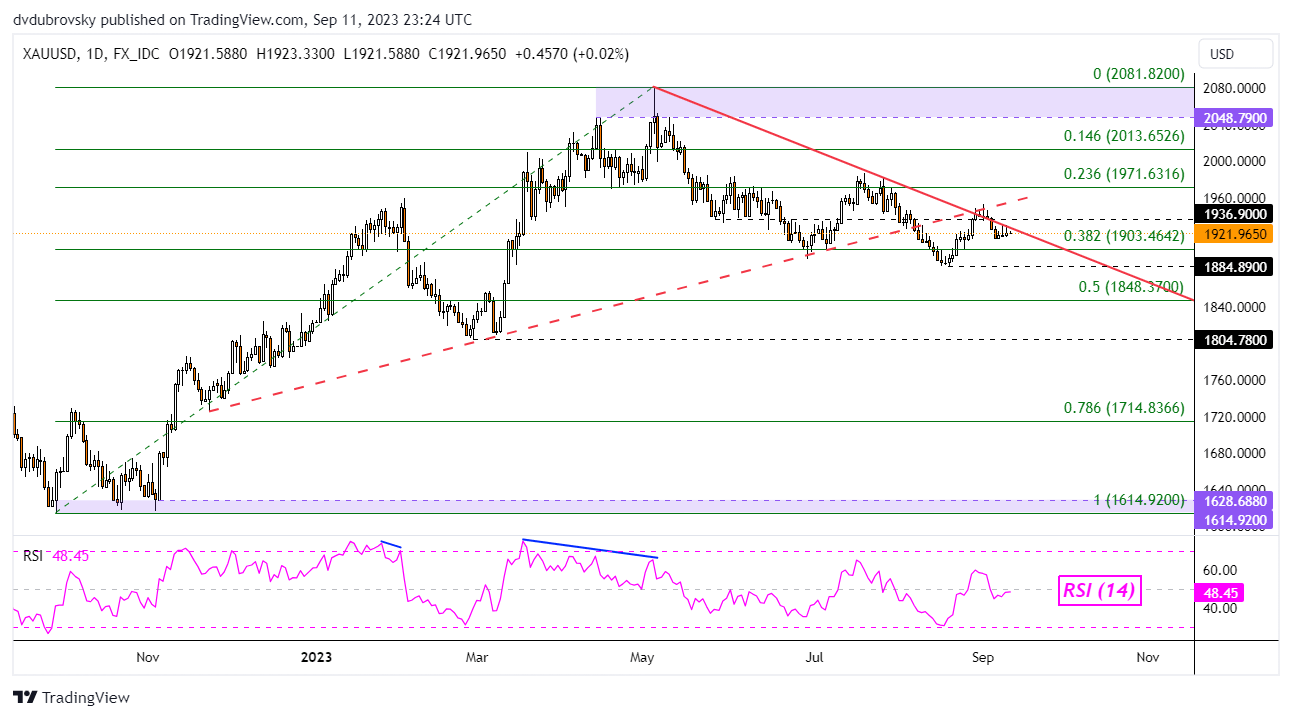
Gold prices appear to be increasingly struggling to break above the key falling trendline from May on the daily chart below. Last week, XAU/USD climbed to the former rising trendline from October after breaking below it, failing to push back above the line. This created a key juncture of resistance that combined both trendlines.

Since then, prices have aimed slightly lower, reinforcing the falling trendline. From here, immediate support is the 38.2% Fibonacci retracement level of 1903.46, followed by the August swing lower at 1884.89. Breaking above the trendline could open the door to a broader reversal, exposing the 23.6% level at 1971.63.

XAU/USD Analysis

XAG/USD Analysis

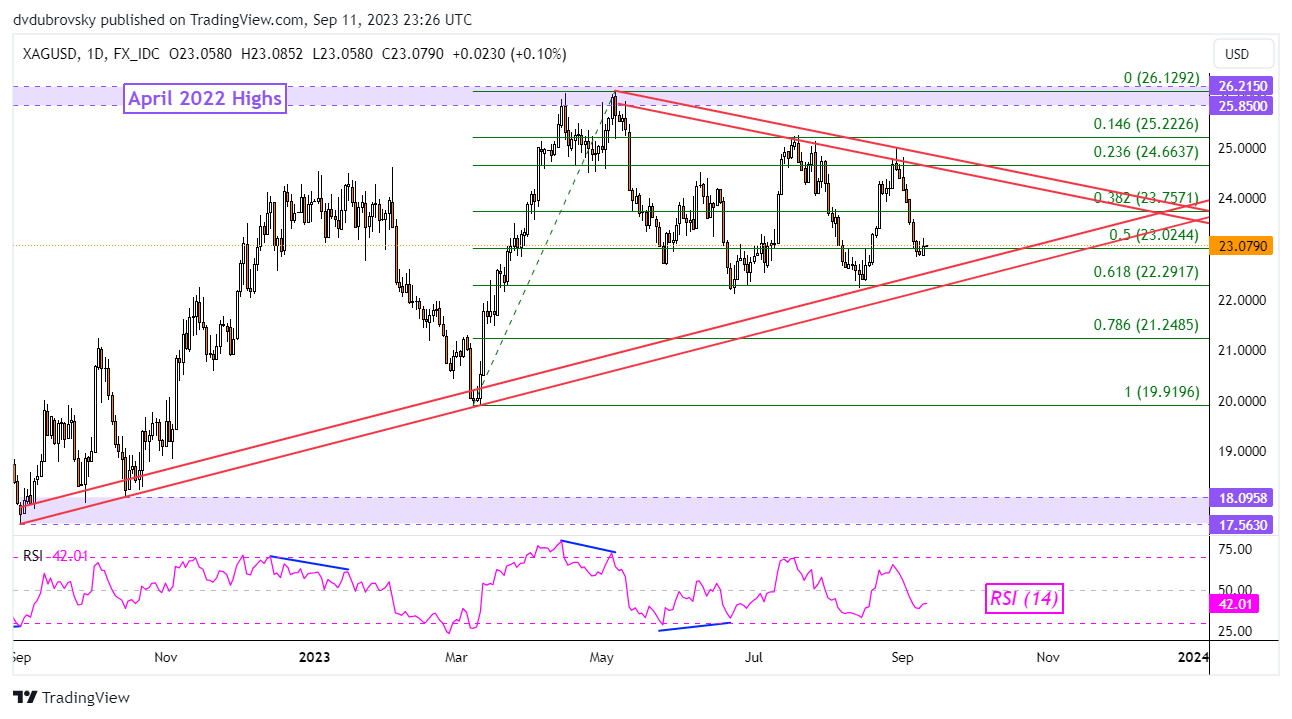
Taking a look at silver, the broader technical landscape remains neutral. This is because XAG/USD is consolidating between a rising zone of support from August 2022, and a falling range of resistance from earlier this year. Lately, this has been creating a Symmetrical Triangle chart formation. Then direction of the breakout could be key for the coming trend.

Currently, silver is hovering around the midpoint of the Fibonacci retracement level of 23.02, breaking lower exposes the rising range of support and the 61.8% point at 22.29. On the flip side, immediate resistance is the 38.2% level at 23.75. Just beyond that the falling range of resistance will kick in. With that in mind, the silver outlook remains neutral.

XAG/USD Analysis


Asia Day Ahead: USD/CNH Retraces From October 2022 Peak, EUR/USD Stabilises

Asia Day Ahead: USD/CNH Retraces From October 2022 Peak, EUR/USD Stabilises

Major US indices found room for some relief to start the week, after comments from China and Japan authorities supported their respective currencies and triggered a pullback in the US dollar (-0.5%) – its sharpest single-day drop in two months. Notably, the Nasdaq gained 1.1% despite a subdued showing in US Treasury yields, with the heavy-lifting revolving around a handful of big tech stocks. Individual corporate news seem to account for the uneven performance, with Tesla up 10% on Morgan Stanley’s rating upgrade, while both Meta and Amazon were up more than 3%.

Ahead, sentiment surveys around Australia and Germany, along with UK employment data will be on watch, although any market moves could be short-lived in the lead-up to the US Consumer Price Index (CPI) data release tomorrow. The upcoming US inflation data will be key to determine whether the Federal Reserve (Fed) may leave the door open for additional tightening in November or December, at a time where more Fed policymakers are putting greater emphasis on data-dependence lately and softening their tone around rate hikes.

Upcoming market moves may also depend on whether Apple can convince investors of its new products at its upcoming event, given the company’s heavy weightage in major US indices. Seasonality over the past 20 years has not been in favour however, with average performance generally ranging to slightly lower in the second half of September.

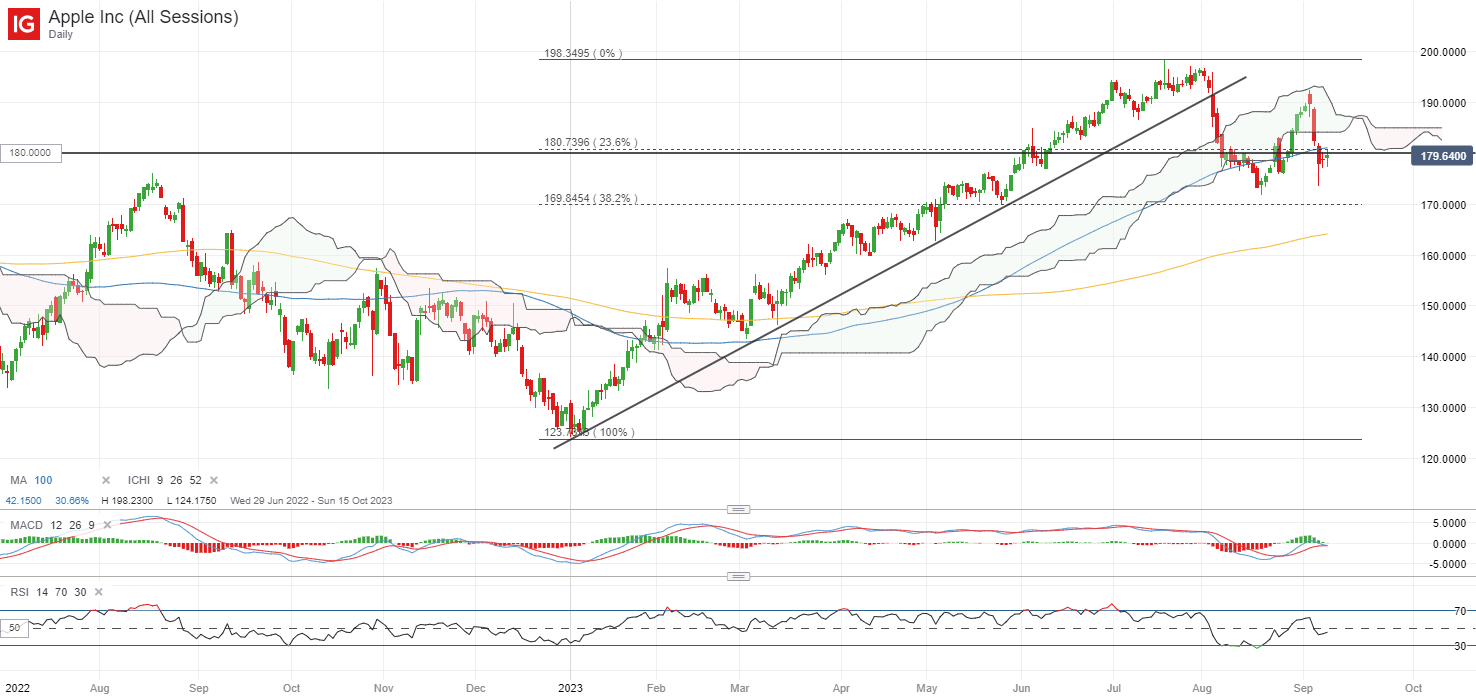
Having fallen below its Ichimoku cloud support on the daily chart, the US$180.00 level is now showing to be a key resistance to overcome, where its 100-day moving average (MA) coincides with a 23.6% Fibonacci retracement (from its January 2023 bottom to July 2023 peak). For now, the bears have rejected a crossover in its moving average convergence/divergence (MACD) above the key zero level on its daily chart. That said, some dip-buying was spotted at the US$173.54 level with the formation of a long-legged candle last week, which will now be a crucial support level to hold.

image1.png

Asia Open

Asian stocks look set for a mixed open, with Nikkei +0.38%, ASX -0.41% and KOSPI -0.29% at the time of writing. Chinese equities attempted to regain its footing, with the Nasdaq Golden Dragon China Index up 1.2% overnight, although some paring of initial gains still points towards some reservations ahead of China’s data dump on Friday. Moderate improvement is expected from its retail sales and industrial production data, although the general trend over China’s economic data over the past three months has been one of downside surprises.

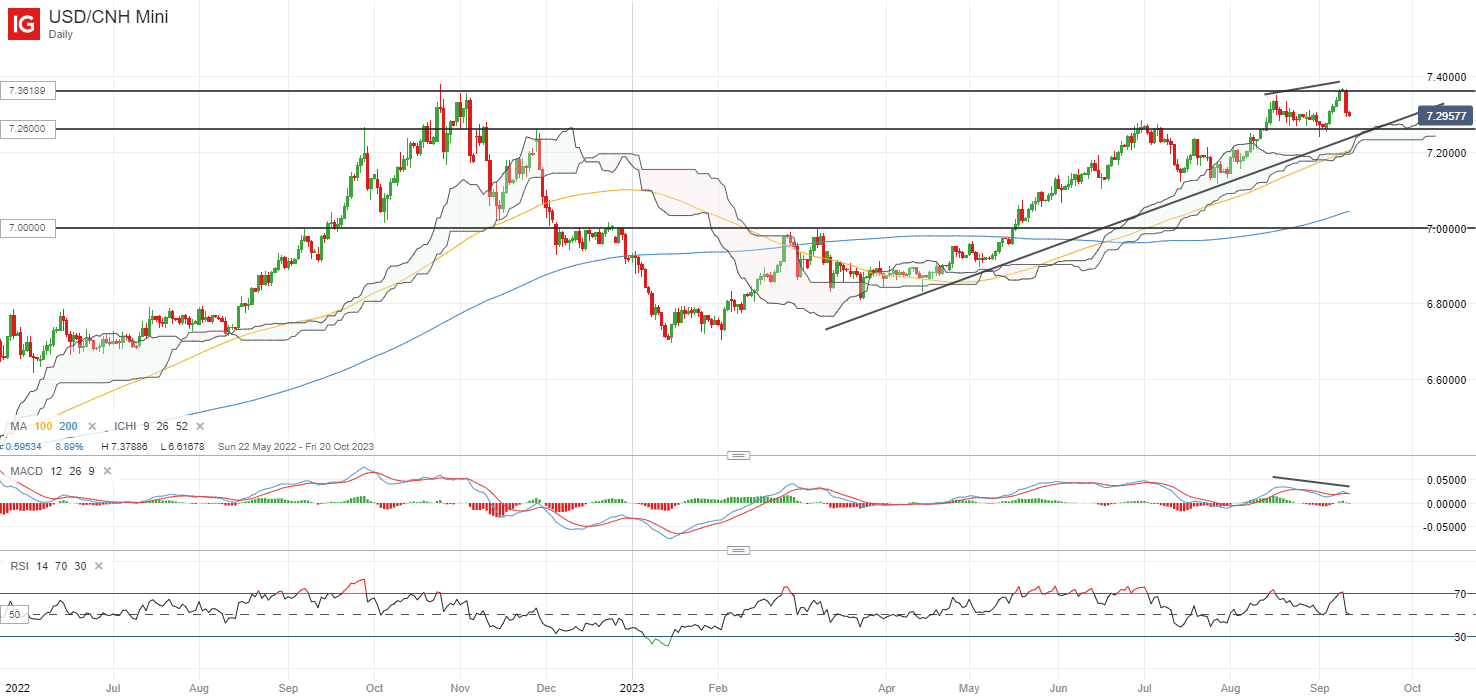
Renewed warnings from the People’s Bank of China (PBoC) on yuan speculation has a -0.8% impact on the USD/CNH yesterday, following a bearish MACD divergence displayed on its daily chart. Further tightening of bulk dollar purchases by domestic firms will likely provide some follow-through to recent selling pressure, with the support confluence zone around the 7.230-7.260 level now placed on the radar as a key test for buyers ahead. The level marked a series of support lines, ranging from its Ichimoku cloud on the daily chart to an upward trendline support.

image2.png

On the watchlist: EUR/USD attempts to stabilise ahead of US CPI and ECB rate decision this week

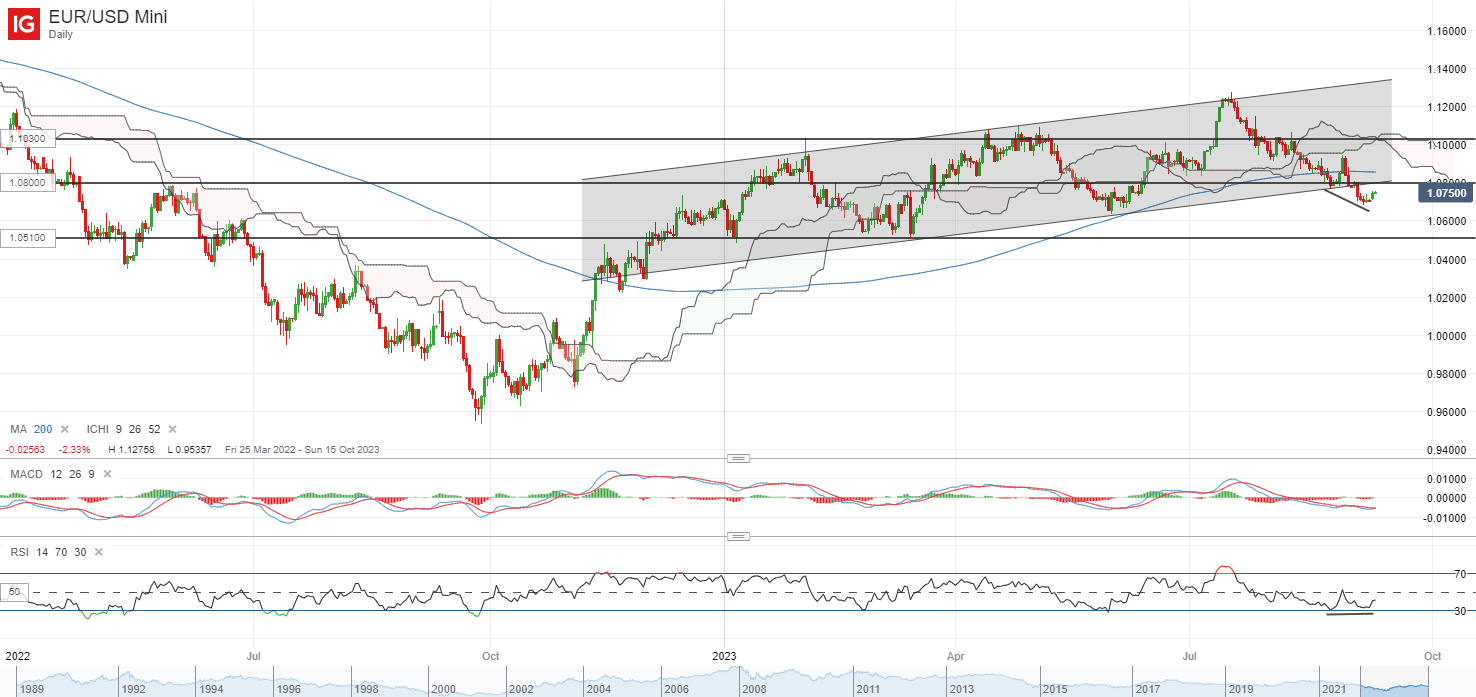
It is a major week for the EUR/USD, with the US CPI and ECB rate decision lined up on the horizon this week as key driving forces for the pair. Since mid-July this year, the pair has retraced as much as 5.2%, before attempting to stabilise lately on some US dollar weakness to start the week.

Technicals on the daily chart may reveal a potential bullish divergence on its RSI for now, with the RSI failing to form lower lows on recent bottoms, which may suggest abating selling pressures. That said, greater conviction for the bulls may have to come from a move back above the 1.080 level of resistance, where the lower trendline of a previous ascending channel since the start of the year stands. Failing to cross back into its previous channel pattern could still leave some doubts on recent upside, with its weekly RSI still trading below the key 50 level for the first time since November 2022.

image3.png

Crude Oil Clambers Near Peak as US Dollar and Euro Pause Ahead of US CPI and ECB

Crude Oil Clambers Near Peak as US Dollar and Euro Pause Ahead of US CPI and ECB

Crude oil continues to eye a new high going into Tuesday’s trading session as markets ponder the direction for the US Dollar ahead of US CPI on Wednesday.

The WTI futures contract is around US$ 87.00 bbl while the Brent contract is near US$ 90.50 bbl.

There are reports emerging today that the US will waive sanctions against Iran which will pave the way for the release of up to US$ 6 billion of oil revenue in exchange for the release of 5 American citizens.

If talks continue to positively progress between the countries, it might lead to more supply potentially entering global trade.

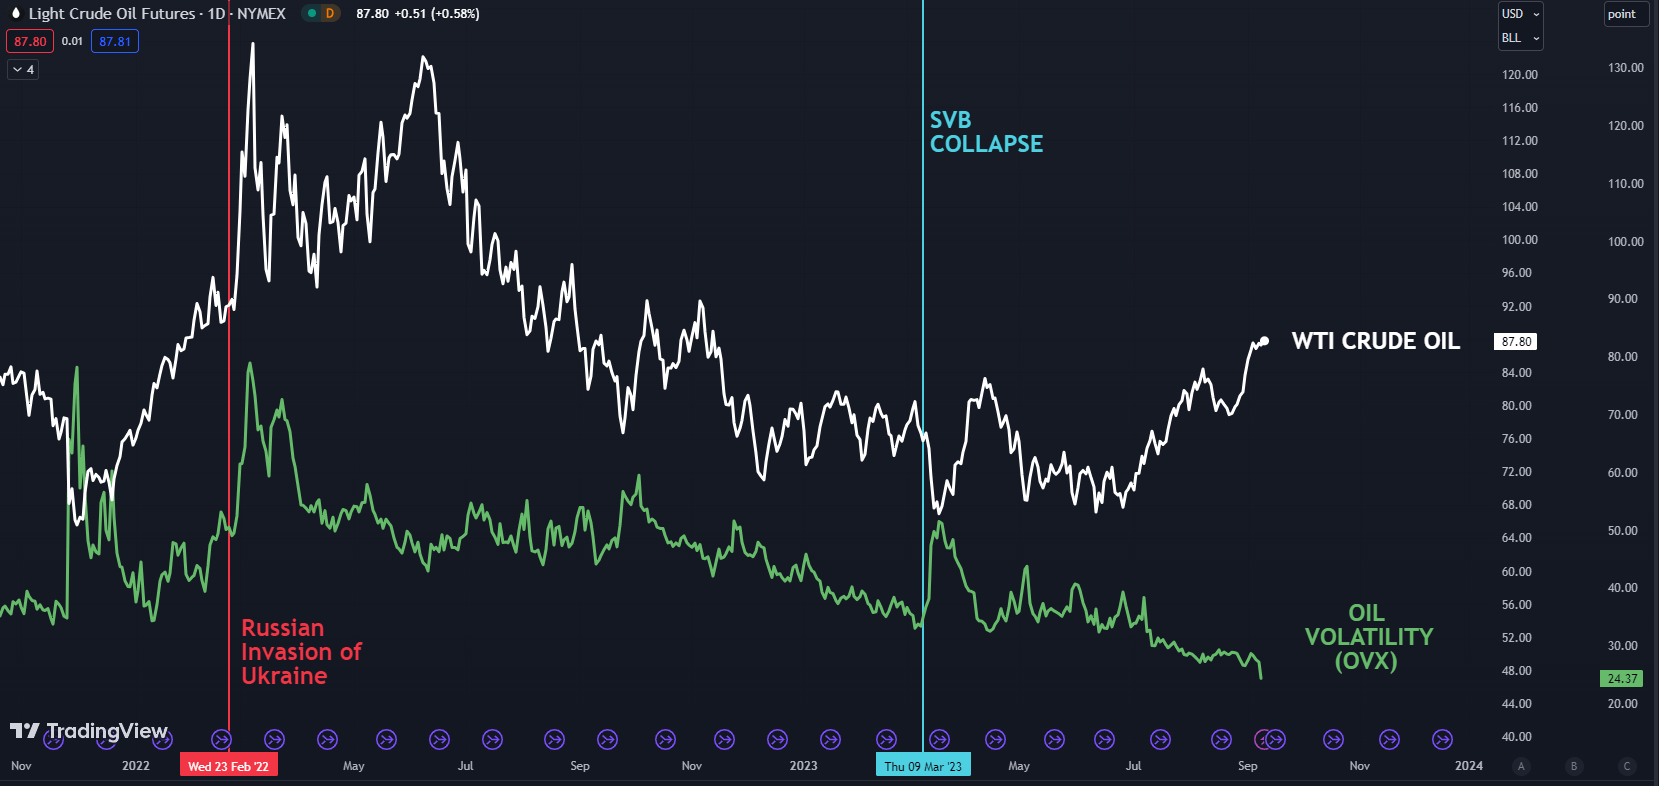
The 10-month peak seen yesterday is within grasp ahead of the American Petroleum Institute (API) report due today. Further depletion of stockpiles may see an uptick in volatility.

The OVX index measures volatility in the oil price in a similar way that the VIX index gauges volatility on the S&P 500.

The chart below shows that WTI oil volatility has been languishing despite the run-up in prices.

WTI CRUDE OIL AND VOLATILITY (OVX)

image1.png

It will be followed by the US Energy Information Agency’s (EIA) weekly petroleum status report on Wednesday. The EIA will also release its monthly report this week, as will OPEC+.

The US Dollar continues to struggle today after a rout on Monday ahead of CPI tomorrow. A Bloomberg survey of economists is estimating the headline print to be 3.6% year-on-year to the end of August. Forecasts for core CPI are 4.3%.

Interest rate markets are unsure if the Federal Reserve will hike or not by the end of the year, attaching around a 50% probability of a 25 basis point lift. An outlier in CPI could see these odds shift significantly and might flow into demand or otherwise for the US Dollar.

US FEDERAL RESERVE TARGET RATE MARKET PRICING

image2.png

Overnight, Morgans Stanley upgraded Tesla to buy from neutral, which saw the TSLA stock price rally over 10%, boosting the Nasdaq to close its cash session 1.14% higher.

The rest of Wall Street posted smaller gains and APAC equity indices have had a quiet day. Futures are pointing toward a quiet start to the European and North American day session.

Spot gold and silver are trading near US$ 1,920 and US$ 23.20 respectively an ounce.

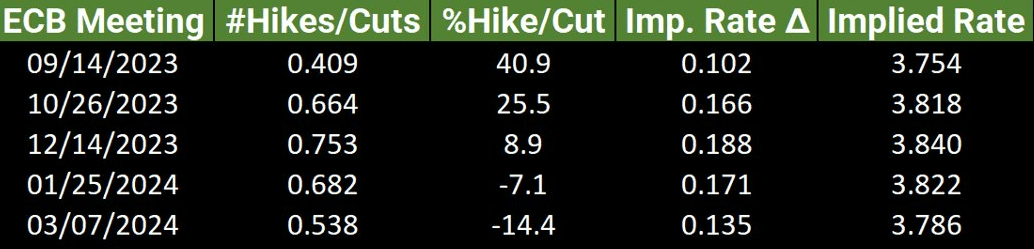
EUR/USD is trading near 1.0750 at the time of going to print. The interest rate market is ascribing around a 40% chance of a 25 bp hike by the European Central Bank this Thursday.

ECB TARGET RATE MARKET PRICING

image3.png

After UK jobs data, Germany will see the results of the ZEW survey while in the US, there is much anticipation for the launch of the iPhone 15 and iPhone 15 pro later today.


UK Unemployment Ticks Higher as Total Earnings Remains Sticky, GBP/USD Slides

UK Unemployment Ticks Higher as Total Earnings Remains Sticky, GBP/USD Slides

The latest data out from the UK is an interesting one to say the least and promises to add a further headache for the BoE. The UK employment rate was estimated at 75.5% in May to July 2023, 0.5 percentage points lower than February to April 2023. The quarterly decrease in employment was mainly driven by full-time self-employed workers.

image1.png

The unemployment rate increased to 4.3% on the quarter and in line with the forecasted figure. The number of unemployed people increased by 159 thousand to 1.46 million, largely driven by individuals unemployed for up to 12 months. According to UK ONS data,In August 2023, 0 fewer people were in pay-rolled employment when compared with July 2023.

Annual growth in regular pay (excluding bonuses) was 7.8% in May to July 2023, the same as the previous 3-month period and is the highest regular annual growth rate since comparable records began in 2001. Annual growth in employees’ average total pay (including bonuses) was 8.5%; this total annual growth rate is affected by the NHS and Civil Service one-off payments made in June and July 2023. In real terms (adjusted for inflation using Consumer Prices Index including owner occupier’s housing costs (CPIH)), annual growth for total pay rose on the year by 1.2% and for regular pay rose on the year by 0.6%.

image2.png

UK OUTLOOK MOVING FORWARD

Looking ahead and the GDP data out of the UK showed promising signs once more. The Bank of England have remained firm in their belief that inflation will trickle down in Q3 and Q4 of 2023 with the most recent print showing a significant drop-off. However, yesterday comments from Chancellor Hunt seemed to suggest that the challenge is turning out to be a lot tougher than expected.

There is no denying the UK economy has remained resilient for the large part, however today’s data will add to the Bank of England’s (BoE) conundrum. As the jobless rate continues to tick higher earnings remain stubborn and something that has been a growing concern for the BoE as it looks to rein in inflation. It is key to note that the earnings figure may be slightly distorted by the NHS and Civil Service one-off payments made in June and July 2023.

The Bank of England face an unenviable task, but I do not see how the Central Bank can pause if earnings continue to accelerate. This is likely to keep inflation elevated even if it does show signs of retreat, the Central Banks target will likely require the BoE to make some progress on the earnings front.

MARKET REACTION

The initial market reaction following the news has seen GBPUSD bounce around 30-pips from the key support area around the 1.2500 mark, this however proved to be short lived.

GBPUSD did close yesterday above the 1.2500 mark following a bullish engulfing candlestick pattern on the daily timeframe which would hint at further upside. A push higher could bring the resistance level around the 1.2565 area into focus before a potential test of the 100-day MA. The upside does appear more appealing as the Dollar has had a lackluster start to the week. Given the US data ahead tomorrow and Thursday, this could be a deciding factor on whether GBPUSD can build on yesterday’s bullish momentum.

A push below the 1.2500 handle has to deal with the 200-day MA resting around the 1.2433 mark if a push lower is to gain any traction.

GBPUSD Daily Chart, September 12, 2023

Taking a quick look at the IG Client Sentiment, Retail Traders are Overwhelmingly Long on GBPUSD with 63% of retail traders currently LONG on GBPUSD. Given the Contrarian View to Crowd Sentiment Adopted Here at DailyFX, is this a sign that Cable may continue its fall?

USD/CAD Price Forecast: Crude Oil & BoC Remnants Keep Loonie Elevated

USD/CAD Price Forecast: Crude Oil & BoC Remnants Keep Loonie Elevated

CANADIAN DOLLAR FUNDAMENTAL BACKDROP

The Canadian dollar has managed to maintain strength against the USD in a week with little Canadian specific economic data. Last week’s Bank of Canada (BoC) rate announcement saw Governor Macklem leave the door open to additional hikes should incoming data necessitate. Subsequently, the local balance of trade and labor reports outlined the economies resilience and sustained upside pressures on inflation from an average earnings lens. Higher crude oil prices are also favorable for the CAD while supplementing the inflation narrative that could prompt the aforementioned hike early next year. This is reflected in BoC interest rate expectations (refer to table below) which have been ‘hawkishly’ re-priced to suggest a 10bps peak from 5bps just last week.

BANK OF CANADA INTEREST RATE PROBABILITIES

image1.png

Considering the trading day is relatively light, focus will shift to the rest of the week (see economic calendar below) covering key US data. US CPI tomorrow could set the tone to Friday’s close with many analysts hinting at a potential upside surprise on the core print.

USD/CAD ECONOMIC CALENDAR (GMT +02:00)

image2.png

TECHNICAL ANALYSIS

USD/CAD DAILY CHART

image3.png

Daily USD/CAD price action shows bearish/negative divergence developing as the pair holds below the 1.3600 psychological handle. That being said, a strong US CPI release could provide bulls with another run up above this zone while a weaker inflation report could bring 1.3500 back into consideration.

Key resistance levels:

  • 1.3700
  • 1.3668
  • 1.3600

Key support levels:

  • 1.3561
  • 1.3500

IG CLIENT SENTIMENT DATA: BEARISH

IGCS shows retail traders are currently SHORT on USD/CAD , with 62% of traders currently holding short positions (as of this writing). Download the latest sentiment guide (below) to see how daily and weekly positional changes affect USD/CAD sentiment and outlook!

Oil Prices Forecast: Saudi-Russia Supply Cuts Buoy Oil, But China’s Economy Casts Shadow

Oil Prices Forecast: Saudi-Russia Supply Cuts Buoy Oil, But China’s Economy Casts Shadow

China’s Economic Woes and the Oil Market

In early Asian trading on Monday, oil prices declined, attributed largely to concerns over China’s economic trajectory. Despite this dip, Brent remained above the $90 mark, bolstered by restricted supplies following the decision by Saudi Arabia and Russia to prolong supply cuts. The recent strengthening of the USD over eight consecutive weeks has further dampened investor enthusiasm in the commodity space.

Supply-Side Dynamics Drive Prices

Over the past fortnight, both Brent and West Texas Intermediate (WTI) contracts have seen gains, with Brent registering its highest value since the previous November. This surge came in the wake of the announcement from Saudi Arabia and Russia to extend their combined voluntary supply cuts by 1.3 million barrels daily until the year concludes. Moreover, expectations are building around upcoming monthly reports from the International Energy Agency (IEA) and the Organization of the Petroleum Exporting Countries (OPEC). Any signs pointing to robust oil demand could elevate prices further.

Trading Derivatives carries a high level of risk to your capital and you should only trade with money you can afford to lose. Trading Derivatives may not be suitable for all investors, so please ensure that you fully understand the risks involved, and seek independent advice if necessary. A Product Disclosure Statement (PDS) can be obtained either from this website or on request from our offices and should be considered before entering into a transaction with us. Raw Spread accounts offer spreads from 0.0 pips with a commission charge of USD $3.50 per 100k traded. Standard account offer spreads from 1 pips with no additional commission charges. Spreads on CFD indices start at 0.4 points. The information on this site is not directed at residents in any country or jurisdiction where such distribution or use would be contrary to local law or regulation.

US Producers and the Market Outlook

In the U.S., the oil industry recently added its first rig since June, as noted in Baker Hughes’ weekly update. However, the total count remains 17% less than last year. WTI seems to be defining a new price range, hovering between $83 and $93.50. Nonetheless, demand concerns in regions like China and Europe may limit significant gains.

Benchmarks and Forecasts

Both Brent and WTI have enjoyed gains for two successive weeks. Specifically, they surged by roughly 1% to a nine-month peak last Friday, influenced by rising U.S. diesel futures and supply constraints from key producers. Currently, both benchmarks are technically overbought for the sixth consecutive day. While the market sentiment remains dominated by supply-side factors, OPEC+’s commitment to maintaining a tight market through winter is clear.

Short-term Forecast

Given the prevailing market conditions and uncertainties surrounding Chinese demand, the short-term outlook for oil prices appears cautiously bullish. The anticipation of reports from key energy organizations and geopolitical dynamics, such as the Venezuela-China interaction, will significantly shape trader sentiment in the days to come.

Technical Analysis

4-Hour Light Crude Oil FuturesThe current 4-hour price of $87.10 slightly surpasses the previous 4-hour price of $86.95. It sits above the 200-4H moving average ($82.02) and slightly above the 50-4H moving average ($85.34). The 14-4H RSI reading is 56.69, denoting slightly strengthened momentum but still in a neutral zone.

In terms of support and resistance, the current price is nestled between the main support area (84.89-83.81) and the main resistance area (90.10-93.74). Given these metrics and its position above both moving averages, the current market sentiment for Light Crude Oil Futures appears moderately bullish.

DAX Index: Losing Streak Ends, But What’s Next for the DAX 30 Landscape?

DAX Index: Losing Streak Ends, But What’s Next for the DAX 30 Landscape?

DAX Ends a Five-Day Losing Streak

On Friday, the DAX ended a five-day losing streak, gaining 0.14%. Reversing a 0.14% loss from Thursday, the DAX ended the week down 0.63% to 15,740.

German Inflation Leaves the ECB in a Predicament

On Friday, finalized German inflation figures for August aligned with preliminary numbers. The annual inflation rate softened modestly from 6.2% to 6.1%. Significantly, the harmonized inflation rate eased from 6.5% to 6.4%. Sticky inflation remains a concern for the ECB.

Trading Derivatives carries a high level of risk to your capital and you should only trade with money you can afford to lose. Trading Derivatives may not be suitable for all investors, so please ensure that you fully understand the risks involved, and seek independent advice if necessary. A Product Disclosure Statement (PDS) can be obtained either from this website or on request from our offices and should be considered before entering into a transaction with us. Raw Spread accounts offer spreads from 0.0 pips with a commission charge of USD $3.50 per 100k traded. Standard account offer spreads from 1 pips with no additional commission charges. Spreads on CFD indices start at 0.4 points. The information on this site is not directed at residents in any country or jurisdiction where such distribution or use would be contrary to local law or regulation.

However, economic indicators from Germany have flashed recessionary signals, forcing the ECB to rethink its policy goals to tame inflation. Investors expect a German and Eurozone recessions after considering the latest stats. While concerns over the Chinese economy and Fed rate hikes remained headwinds, easing bets on an ECB rate hike provided support.

Fed Vice-Chair Williams Comments Resonate

US economic indicators exceeded expectations in the week. However, uncertainty lingers about Fed policy goals and whether the US economy can keep expanding.

On Thursday, influential Fed Vice-Chair John Williams projected a US unemployment rate above 4.0%. The Vice-Chair avoided the topic of rate hikes but highlighted that the Fed has monetary policy in the right place, leaving the data to influence interest rate future decisions.

There were no comments to suggest a September move, supporting modest gains for the Friday session.

The Friday Market Movers

Zalando tumbled by 5.14%. The German online retailer sat at the bottom of the DAX, with investors fretting over the possible effects of a Eurozone-wide recession on company earnings.

However, banks and autos were among the front runners, with dip buyers providing support. Commerzbank and Deutsche Bank saw gains of 1.82% and 0.71%, respectively. Volkswagen led the auto sector, gaining 1.23%

Today’s Session

Italian industrial production numbers for July will draw interest early in the session. Following the weak numbers from Germany, another gloomy report would test buyer appetite. Economists expect production to fall by 1.7% versus a 0.8% decline in June.

For the European auto sector, vehicle sales from China will influence investor sentiment toward demand. Economists forecast a 2.0% rise in vehicle sales year-over-year in August, recovering from a 1.4% decline in July.

The DAX Futures was up 1 point this morning.

US Inflation in the Spotlight

With the markets betting on a Fed pause on raising interest rates this month, inflation figures will influence bets on Fed policy.

This afternoon, US Consumer Inflation Expectation figures for August need consideration. Economists forecast Consumer Inflation Expectations to soften from 3.5% to 3.4%. Softer numbers would support bets on the Fed to leave interest rates unchanged this month.

However, US inflation numbers on Wednesday will have more impact on Fed policy goals. Economists forecast the US inflation rate to accelerate from 3.2% to 3.6% in August.

Short-Term Forecast

While the DAX Futures signals a steady open, euro area recessionary jitters and US inflation numbers will likely test buyer appetite over the near term.

DAX Technical Indicators

Daily Chart

The trend line held, preventing a sustained DAX break below it on Friday. A hold above the trend line would give the bulls a run at the 50-day EMA and 16,007 resistance level. However, the DAX would need upbeat stats from the Euro area and softer inflation numbers from the US to support a breakout session.

A DAX break below the trend line would bring the 15,663 support level and 15,500 into play. A larger-than-expected slide in Italian industrial production and hotter-than-expected US inflation numbers would bring 15,500 into view.

The 14-Daily RSI reading of 45.24 gives the DAX room to fall through the 15,663 support level before entering oversold territory.

DAX Daily Chart sends bearish near-term price signals.
DAX 110923 Daily Chart

4-Hourly Chart

The DAX continues to hover below the 50-day and 200-day EMAs, reaffirming bearish price signals. An unexpected rise in Italian industrial production would give the bulls a run at the 50-day EMA. However, gloomy numbers would bring the 15,663 support level into play. A break below the trend line would support a fall through the 15,663 support level to bring 15,500 into view.

Later in the session, US inflation numbers also need consideration.

The 46.08 RSI reading indicates the DAX can fall through the 15,663 support level before entering oversold territory.

4-Hourly Chart affirms bearish near-term price signals.
DAX 110923 4-Hourly Chart
USD to CAD Prices Forecast: Inflation Worries Dictate USD/CAD Movement Ahead of Crucial Data Release

USD to CAD Prices Forecast: Inflation Worries Dictate USD/CAD Movement Ahead of Crucial Data Release

USD to CAD Outlook Amid Inflation Concerns

Profit-Taking and Paused Yields

The USD to CAD exchange rate is on a descent for the second consecutive day, with the U.S. Dollar experiencing a mild setback. Investors appear to be pocketing profits in anticipation of the significant U.S. consumer inflation announcement scheduled for Wednesday. Additionally, a halt in the upward trajectory of Treasury yields is also influencing trading behavior. Presently, as of 08:27 GMT, the USD/CAD stands at 1.3606, marking a decrease by 0.0034 or -0.25%.

Loonie’s Recent Weakness and BoC’s Stance

Recently, the Canadian dollar, often referred to as the loonie, hit a five-month low when juxtaposed with its U.S. counterpart. This depreciation was a direct result of the Bank of Canada maintaining its interest rates, compounded by surprising robustness in the U.S. services sector, which strengthened the U.S. Dollar. The Bank of Canada’s neutral statement caused ripples in the market, highlighting potential concerns regarding inflation. Despite these undercurrents, a majority feel that the bank’s cycle of rate hikes has reached its culmination. The Canadian central bank has maintained its prime interest rate at 5%, acknowledging an era of subdued growth.

Trading Derivatives carries a high level of risk to your capital and you should only trade with money you can afford to lose. Trading Derivatives may not be suitable for all investors, so please ensure that you fully understand the risks involved, and seek independent advice if necessary. A Product Disclosure Statement (PDS) can be obtained either from this website or on request from our offices and should be considered before entering into a transaction with us. Raw Spread accounts offer spreads from 0.0 pips with a commission charge of USD $3.50 per 100k traded. Standard account offer spreads from 1 pips with no additional commission charges. Spreads on CFD indices start at 0.4 points. The information on this site is not directed at residents in any country or jurisdiction where such distribution or use would be contrary to local law or regulation.

Anticipated U.S. Inflation Data

A focal point for investors this week is the U.S. consumer price data. A significantly high figure could stoke concerns of prolonged higher interest rates or the possibility of steeper rate hikes in the near future. This could spur investors to retain their U.S. Dollar holdings.

Further, readings on the producer price index and retail sales are on the radar for those attempting to gauge upcoming Fed policies. The prevalent sentiment is that the U.S. central bank will sustain its benchmark rates during its September 20th session. However, market indicators also suggest an increasing likelihood, currently pegged at 44%, of a rate surge in the Fed’s November meeting.

Inflation Indicators on the Horizon

Wednesday is crucial as it marks the release of the August Consumer Price Index (CPI) report by the United States Bureau of Labor Statistics. All eyes are on this data, looking for definitive signs pertaining to inflationary trends. According to Morgan Stanley’s projections, core inflation for August is anticipated to hover close to 0.2%, nudged by rising energy prices, albeit slightly offset by expected disinflation in core goods.

Short-Term Forecast: Cautious Vigilance

Given the blend of the looming CPI report, coupled with the Bank of Canada’s recent actions and the Federal Reserve’s anticipated moves, markets are treading with a mix of anticipation and caution. Investors should be on the lookout for shifts in the U.S. Dollar’s position, hinging on the imminent inflation data.

Technical Analysis

4-Hour USD to CADThe current 4-hour price of 1.3600 is almost identical to the previous 4-hour price of 1.3601, showcasing negligible change. While it hovers slightly below the 50-4H moving average of 1.3602, it stands notably above the 200-4H moving average of 1.3474, hinting at a potential medium-term upward momentum. The 14-4H RSI at 41.18 is below the neutral zone, suggesting weakened momentum but not yet oversold.

The price is closely approaching the main resistance area (1.3612 to 1.3654) while staying well above the main support area (1.3508 to 1.3483). Based on this data, the current market sentiment leans slightly bullish.

Silver Prices Forecast: XAG/USD Climbs Amidst Dollar Downturn, CPI Anticipation

Silver Prices Forecast: XAG/USD Climbs Amidst Dollar Downturn, CPI Anticipation

Silver Prices and Dollar Retreat

Spot silver (XAG/USD) leapt by 0.61% to $23.09 per ounce on Monday, erasing a small portion of last week’s loss. U.S. silver futures weren’t far behind, climbing 0.85% to settle at $23.37. These gains were driven by a softer dollar, and the ascent may hold above the $22 mark if the U.S. currency continues its downturn.

Technical Barriers and Inflation Watch

The technical outlook suggests hurdles ahead for silver. Both the 50-4H and 200-4H moving averages pose resistance levels that need to be overcome for a sustained rally. Meanwhile, market analysts are closely watching U.S. inflation data due for release on Wednesday. The Consumer Price Index (CPI) figures could weigh heavily on the Federal Reserve’s next move on interest rates, adding another layer of volatility to the silver market.

Trading Derivatives carries a high level of risk to your capital and you should only trade with money you can afford to lose. Trading Derivatives may not be suitable for all investors, so please ensure that you fully understand the risks involved, and seek independent advice if necessary. A Product Disclosure Statement (PDS) can be obtained either from this website or on request from our offices and should be considered before entering into a transaction with us. Raw Spread accounts offer spreads from 0.0 pips with a commission charge of USD $3.50 per 100k traded. Standard account offer spreads from 1 pips with no additional commission charges. Spreads on CFD indices start at 0.4 points. The information on this site is not directed at residents in any country or jurisdiction where such distribution or use would be contrary to local law or regulation.

The Dollar’s Trajectory and Federal Reserve’s Policy

The dollar is displaying remarkable resilience, heading for its longest weekly winning streak since 2014, thanks mainly to robust U.S. economic data. This backdrop has kept silver traders on edge as they await the Federal Reserve’s policy decision on September 20, following U.S. inflation data due on September 13.

Safe Haven Appeal of Silver

Despite strong inflows into the dollar and U.S. Treasuries, silver remains an attractive safe haven for investors. If the Federal Reserve’s primary inflation gauge—the personal consumption expenditures price index—remains sticky, persistent inflation coupled with a potential economic slowdown could elevate silver’s status among other safe havens.

Short-Term Outlook

Traders currently see a 93% chance of the Federal Reserve holding rates steady this September and a 43% likelihood of a rate hike before 2024. Given the technical and fundamental landscape, the market sentiment for silver seems cautiously bullish over the long-run after experiencing a recent sell-off, hinging on upcoming U.S. inflation data and Federal Reserve policy decisions.

Technical Analysis

4-Hour Silver (XAG/USD)Spot Silver (XAG/USD) is currently trading at $23.11, closely aligning with its previous 4-hour price. When compared with key moving averages, it’s positioned below both the 200-4H MA ($23.61) and the 50-4H MA ($23.79), signaling potential bearish momentum. The 14-4H RSI stands at 40.18, suggesting a weakened momentum but not yet oversold territory.

Defining our boundaries, the primary support is set between $22.70 to $22.28, while the main resistance zone spans from $25.00 to $25.27. Given its positioning under both moving averages and the RSI’s inclination, the current market sentiment leans towards the bearish side.