Crude Inventories Decreased By 6.3 Million Barrels

Crude Inventories Decreased By 6.3 Million Barrels

On September 7, EIA released its Weekly Petroleum Status report. The report indicated that crude inventories declined by 6.3 million barrels, compared to analyst consensus of -2.06 million barrels. At current levels, U.S. crude oil inventories are about 4% below the five-year average for this time of the year.

Total motor gasoline inventories decreased by 2.7 million barrels, while distillate fuel inventories grew by 0.7 million barrels.

Strategic Petroleum Reserve increased from 349.5 million barrels to 350.3 million barrels, so U.S. continued to buy oil for strategic reserves despite rising oil prices. U.S. purchases of oil for reserves serve as an additional positive catalyst for oil markets.

Domestic oil production remained unchanged at 12.8 million bpd. At this point, rising oil prices did not provide sufficient incentives to push production above the 13.0 million bpd level.

Interestingly, oil markets did not show a strong reaction to the EIA report. WTI oil continued to trade near the $87.50 level, while Brent oil remained close to the $90.50 level.

It looks that traders decided to take some profits off the table after the strong rally, so the bullish report did not provide immediate support to oil prices. In addition, worries about the health of the global economy and a potential rate hike from the Fed serve as additional negative catalysts for oil markets.

USD/JPY Hits Roadblock at Channel Resistance as GBP/JPY Treads Key Support Zone

USD/JPY Hits Roadblock at Channel Resistance as GBP/JPY Treads Key Support Zone

JAPANESE YEN FORECAST – USD/JPY TECHNICAL ANALYSIS

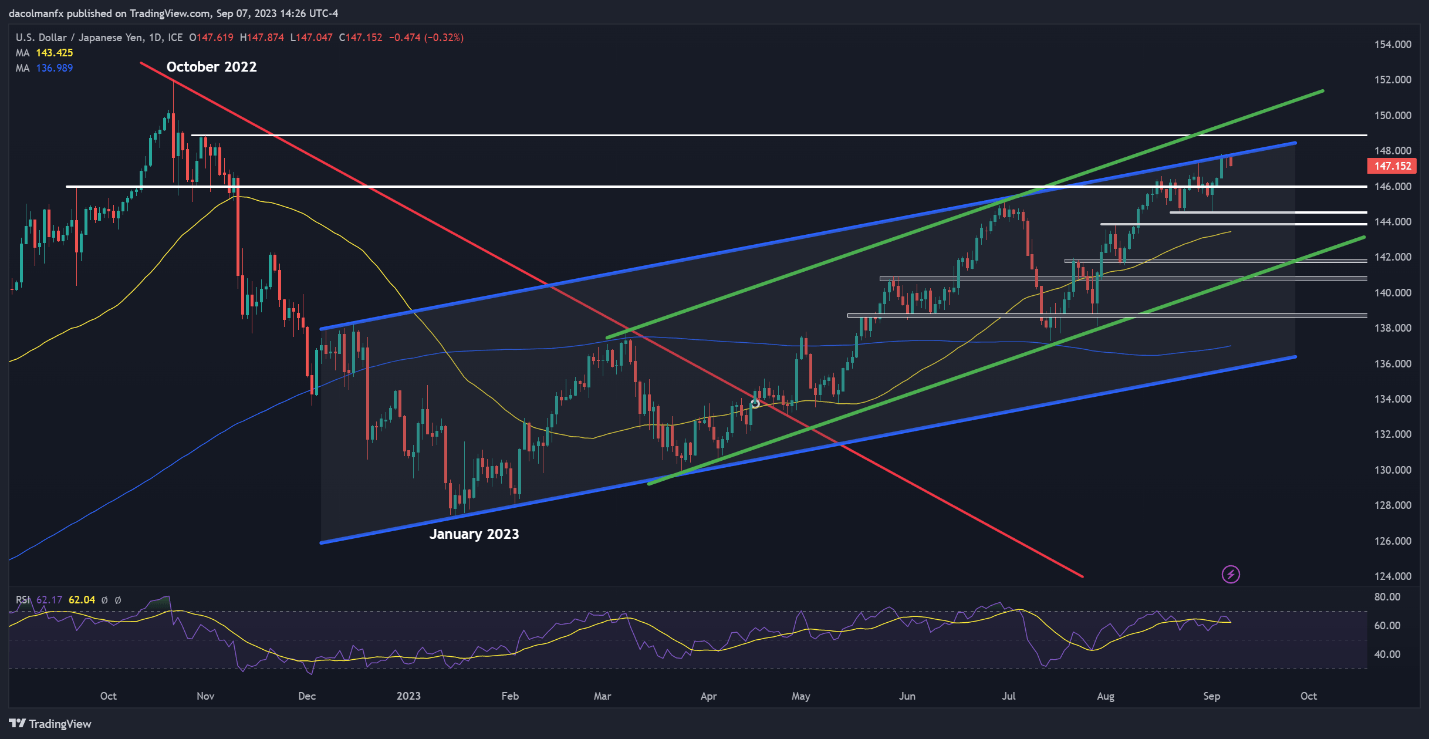
USD/JPY rallied and rose to its highest level since November 2022 earlier in the week, but began to retreat after failing to clear channel resistance in the 147.85 area. Despite this setback, it’s essential to note that the pair remains in a solid uptrend, characterized by a consistent pattern of higher highs and higher lows.

Although USD/JPY‘s prevailing bias remains constructive, there is a possibility that the price could enter a consolidation phase in the near term before embarking on its next upward move. This consolidation phase may translate into a period of range trading and lower volatility.

Looking ahead to a potential resurgence, initial resistance looms near the psychological 148.00 mark, but further gains may be in store on a push above this ceiling, with the next upside target located at 148.80. On further strength, buying impetus could gather pace in FX markets, setting the stage for a possible retest of the 2022 highs around the 152.00 handle.

On the contrary, if the bullish scenario doesn’t come to fruition and sellers regain dominance, technical support rests at 145.90, and 144.55 thereafter. It’s conceivable that the price may establish a base in this region during a pullback, but in the event of a breakdown, the bears may launch an attack on 143.85. A successful breach of this floor might reinforce downward pressure, opening the door to a move to 141.75.

Decode price action and stay ahead of USD/JPY trends. Download the sentiment guide to understand how positioning can offer clues about the market direction!

USD/JPY TECHNICAL CHART

A screenshot of a graph  Description automatically generated

Download our sentiment guide for valuable insights into how positioning may influence GBP/JPY trends

JAPANESE YEN OUTLOOK – GBP/JPY TECHNICAL ANALYSIS

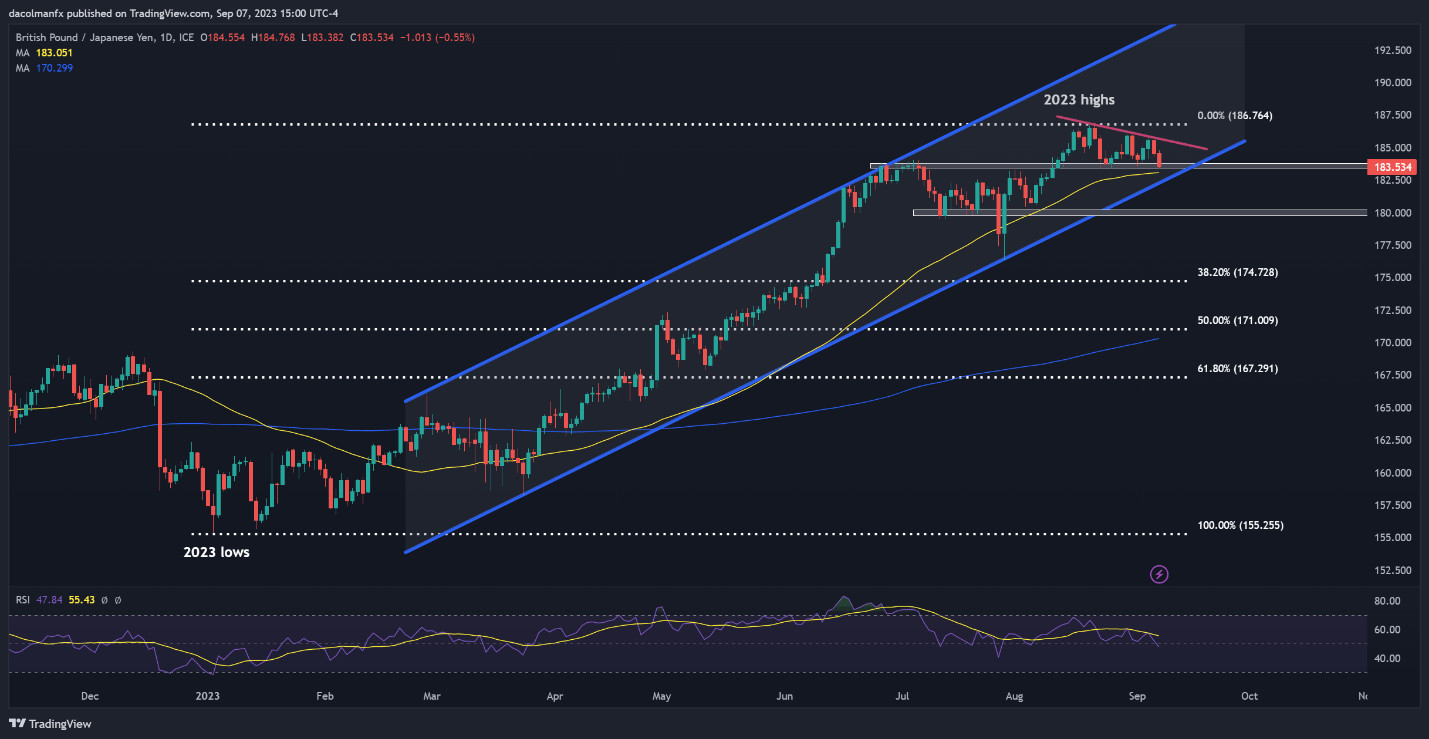
GBP/JPY displayed a robust uptrend from late July, extending well into August. However, the upward momentum began to wane after a failed attempt to break above overhead resistance in the 186.75 area, with prices retreating in recent days, guided lower by a short-term dynamic trendline extended from the 2023 high.

In the event of continued softness, initial support zone is situated at 183.30-183.00, followed by the critical level of 182.00, which aligns with the lower boundary of a medium-term ascending channel. While this region may provide a buffer against further downside, a breakdown could intensify the bearish pressure, paving the way for a decline toward the 180.00 handle.

On the flip side, if buyers regain control of the market and spark a solid rebound off current levels, trendline resistance is positioned at 185.35. Successfully piloting above this barrier could bolster bullish momentum, emboldening market participants to launch an assault on this year’s peak.

GBP/JPY TECHNICAL CHART

A screen shot of a graph  Description automatically generated


Crude Oil Price Forecast: Reversal Technical Warning Signs Brew, Retail Traders Still Bearish

Crude Oil Price Forecast: Reversal Technical Warning Signs Brew, Retail Traders Still Bearish

WTI crude oil prices are aiming for a second consecutive weekly gain so far. Strong gains since June meant that retail traders became increasingly bearish on the commodity. This can be seen by taking a look at IG Client Sentiment (IGCS), which frequently works as a contrarian indicator. With that in mind, could further gains be in store for oil?

Crude Oil Sentiment Outlook – Bullish

According to IGCS, about 39% of retail traders are net-long crude oil. With most of them being biased to the downside, this hints that prices may continue to rise down the road. Meanwhile, downside exposure has increased by 6.3% and 32.95% compared to yesterday and last week, respectively. With that in mind, the combination of overall positioning and recent changes offers a stronger bullish contrarian trading bias.

Crude Oil Sentiment Outlook - Bullish

On the daily chart below, there are a couple of preliminary warning signs that oil is looking increasingly toppy. For starters, a Bearish Harami candlestick pattern has emerged over the past 48 hours. While downside confirmation is lacking at this time, extending lower in the aftermath of this formation could increasingly point towards a reversal.

Meanwhile, negative RSI divergence shows that upside momentum is fading. That can also at times precede a turn lower. Immediate support is the 84.845 inflection point from August. A breakout below this exposes the 50-day Moving Average. Otherwise, near-term resistance is the 61.8% Fibonacci extension level of 88.75.

Crude Oil Daily Chart

Crude Oil Daily Chart

Chart Created in Trading View

US Dollar Heads to the High Ground but USD/JPY Slips. Where to for USD/JPY?

US Dollar Heads to the High Ground but USD/JPY Slips. Where to for USD/JPY?

The US Dollar popped to a new peak going into the end of the week with solid US data keeping the Federal Reserve in the spotlight and underpinning Treasury yields.

The DXY (USD) index nudged 105.16 in the US session, the highest level since the collapse of Silicon Valley Bank (SVB) in March this year.

Overnight saw jobless claims for the week ended September 2nd print at 216k, below estimates of 233k and 229k previously. It comes on the back of some solid economic data over the past week.

Despite this, the interest rate market is ascribing an almost zero probability of a hike by the Fed at its September 20th Federal Open Market Committee (FOMC) meeting.

The benchmark 10-year note had a look over 4.30% in the North American session but has settled back near 4.25% going into Friday’s trade. The 16-year high of 4.36% seen last month might be challenged at some stage.

At the same time, Japanese Government Bonds (JGB) yields remain steady near 0.65%.

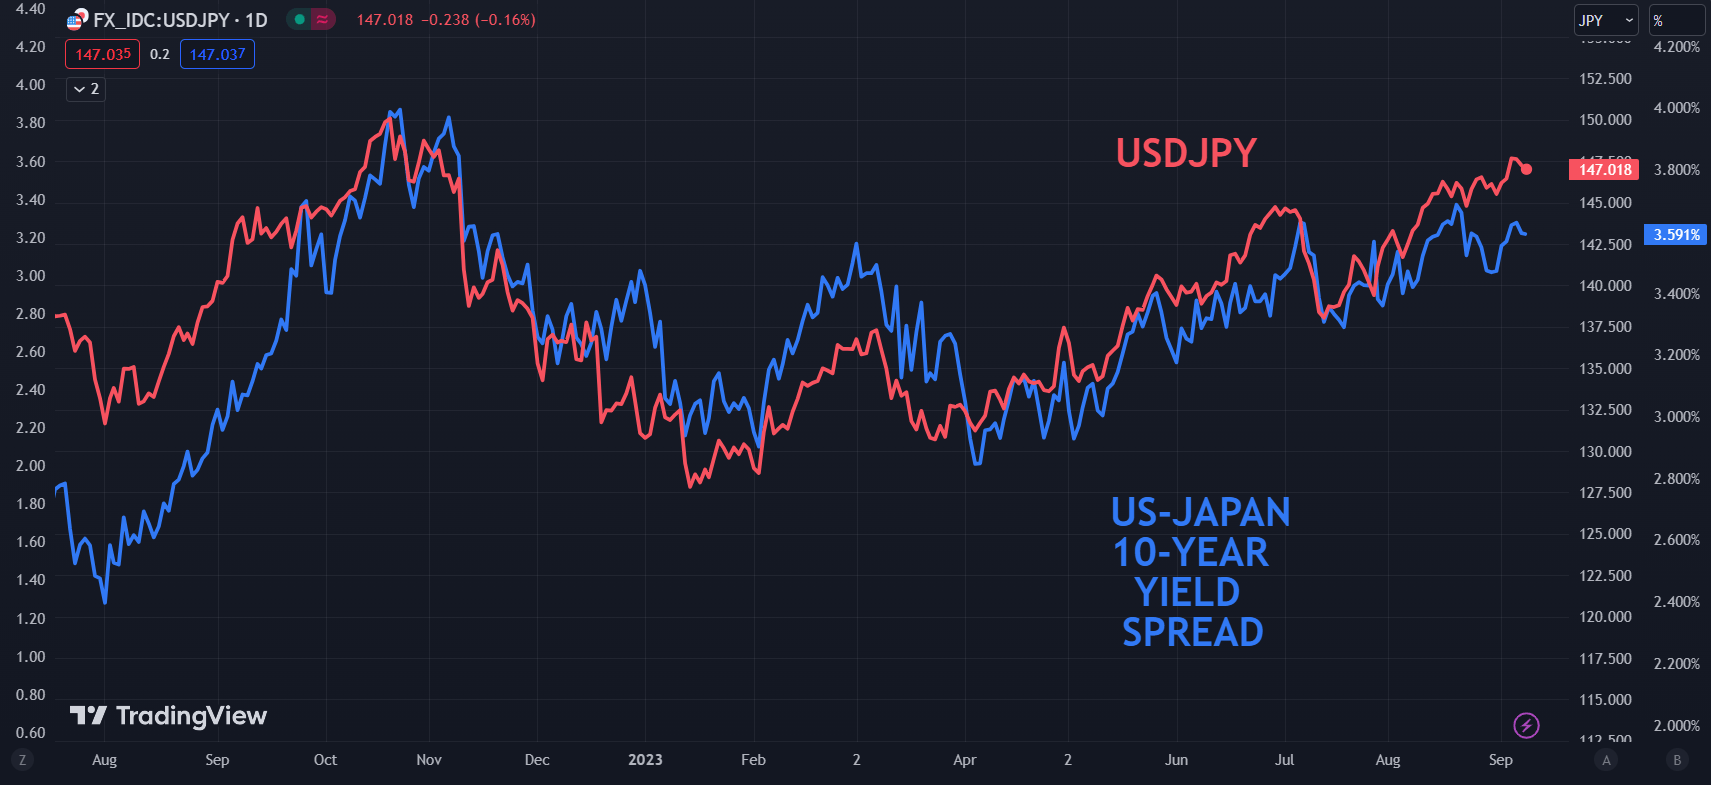
As a result, the yield spread between Treasuries and Japanese Government Bonds (JGB) has been widening but not to the same extent that occurred when USD/JPY hit its peak in October last year.

USD/JPY AND YIELD SPREAD BETWEEN 10-YEAR TREASURIES AND JGBS

image1.png

Earlier this week we saw some light jawboning from Masato Kanda, Japan’s Vice Minister of Finance for International Affairs.

On speculative moves in foreign exchange, he said, “if these moves continue, the government will deal with them appropriately.”

USD/JPY has been trying to make a run above 148 but has failed on three consecutive days in the aftermath and has slipped lower today.

Should there be another assault to higher ground, it might be reasonable to expect more commentary from Japanese officials.

The market generally does not think that there is likely to be physical intervention by the Bank of Japan (BoJ) until the October peak of 151.95 comes into view.

Of course, history has shown that central bank intervention is not always successful, especially at the onset and if the desired direction is inconsistent with underlying fundamentals.

With that in mind, a move above the prior peak near 152 cannot be ruled out.

BoJ board member Hajime Takata also made remarks this week and it might be the case that these two officials might be the people to focus on for signals that may drive USD/JPY price action.

Gold Price Update: Unchallenged US Dollar Set to Weigh on Gold Upside

Gold Price Update: Unchallenged US Dollar Set to Weigh on Gold Upside

US Dollar and Yields Remain Central Ahead of US CPI Print

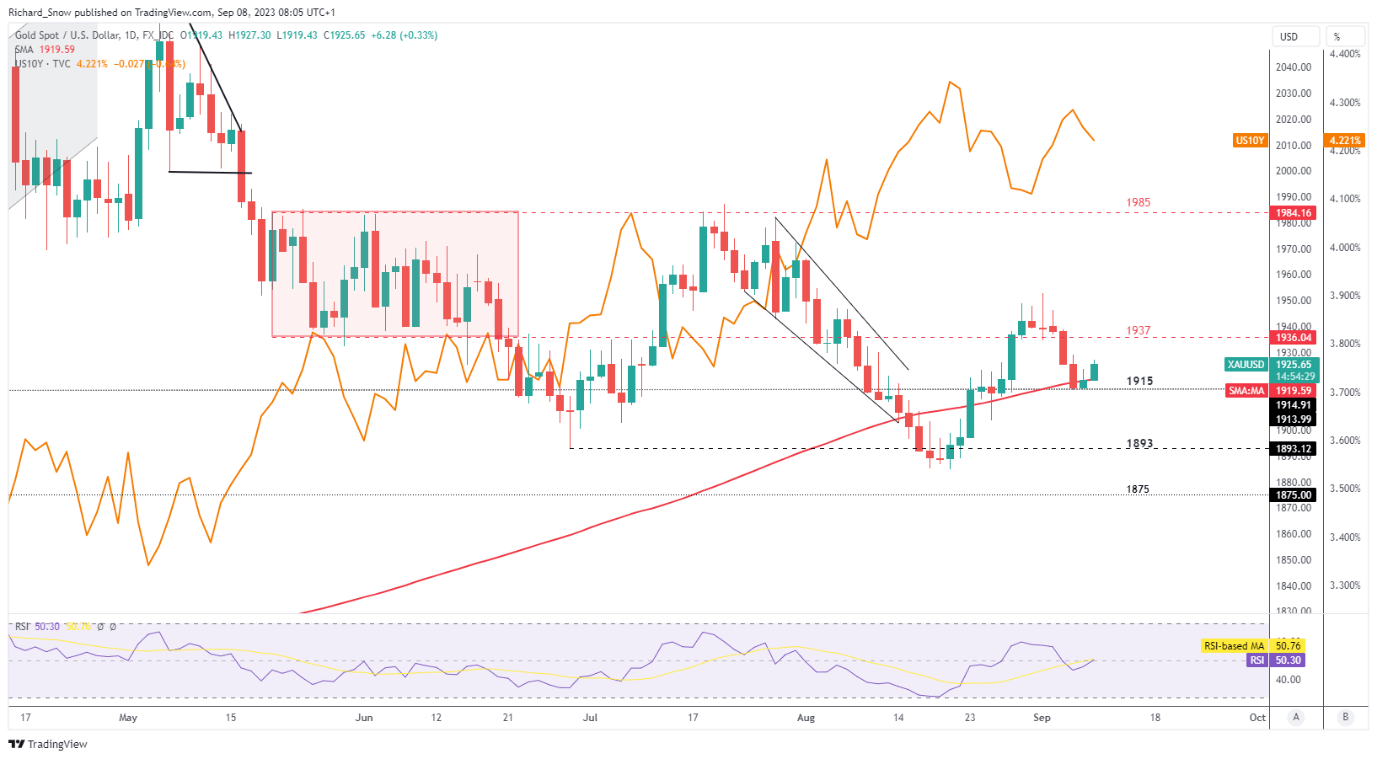
Gold continues to reflect a considerable negative correlation with USD and US treasury bond yields in a week that may pose little challenge to the greenback’s recent gains. A hotter services PMI print alluded to the continuing momentum of the US economy despite early signs in last months print (lower new orders and business activity/production in July).

With Citigroup’s economic surprise index remaining elevated compared to its peers, the US appears likely to see further surprises to the upside which bodes well for the US dollar. The US 10-year treasury yield has also pressured gold this week and despite a late dip, appears set to record a weekly advance – weighing on gold.

Gold has respected the $1915 level of support and currently trades marginally above the 200-day simple moving average (SMA). Gold’s shorter-term direction is likely to remain sensitive to incoming data as the Fed gets closer to reaching peak rates, assuming we aren’t already there. If CPI posts a beat to the upside, markets may to look more favourably towards the possibility of that final 25-bps hike before the Fed is likely to reach its interest rate peak. The opposite holds the same logic where a lower print reduced the urgency to restrict financial conditions further, providing temporary relief for gold.

Gold Daily Chart with US-10 Year Yield (orange line)

image1.png

There are many factors that influence the price of gold making it one of the most interesting asset classes to study. Get to know the ins and outs of gold trading by reading our comprehensive guide below:

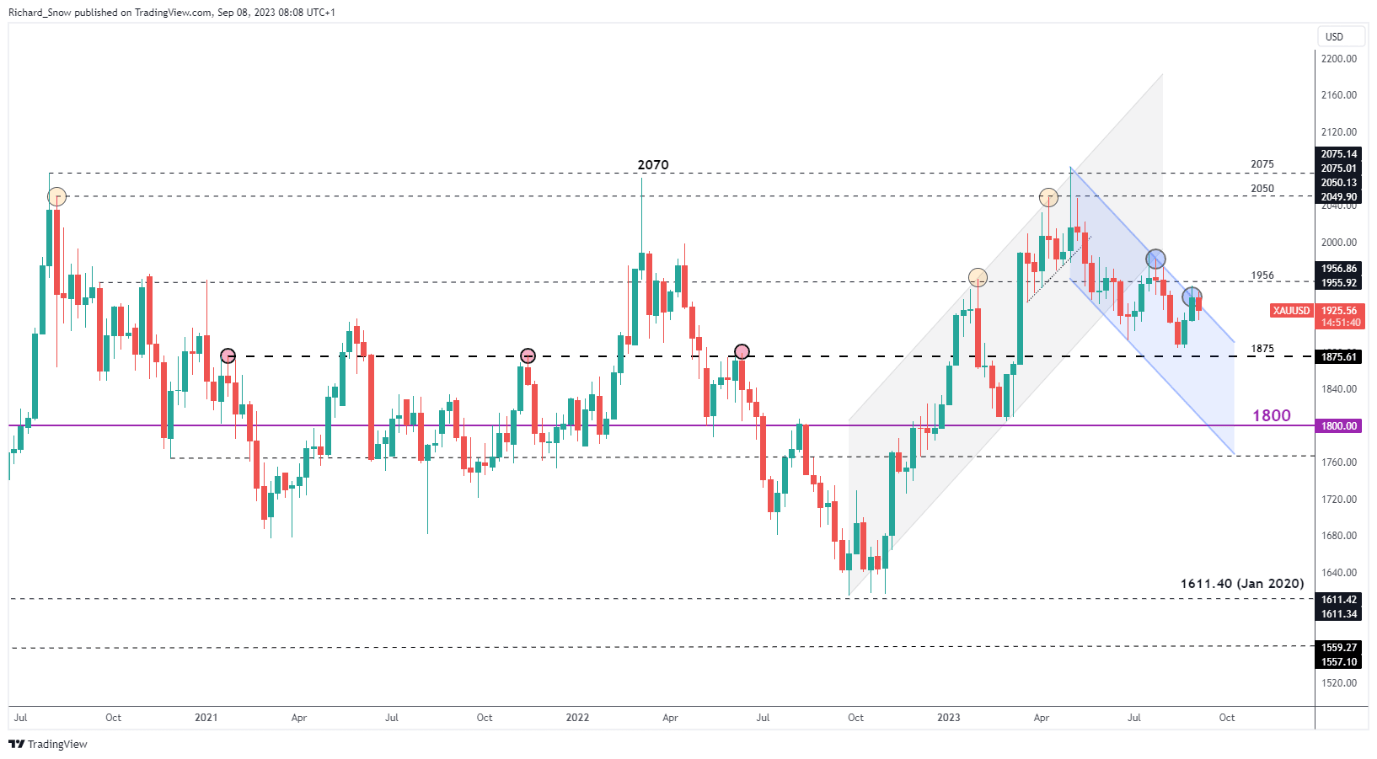
The weekly chart reveals the threat of an upside breakout after prices started this week above channel resistance but has since traded lower. The descending channel suggests that gold prices may find it difficult to see large moves to the upside. $1956 remains the level to watch if a longer-term bullish move is to develop. In the absence of that, $1875 is the level of support to the downside.

Gold Weekly Chart

image2.png

Major Dollar-Focused Risk Events Ahead

Today represents the last day for Fed officials to provide an opinion on policy matters ahead of the media blackout period beginning tomorrow. Yesterday Chicago Fed President Austan Goolsbee was hopeful of achieving a ‘golden path’ but stressed inflation is too high and that the Fed’s broad view is that interest rates will need to remain high for a relatively extended period. His colleague John Williams pointed to a more balanced labour market and slowing wage growth as signs that current policy is having an effect but reiterated that more data is still to come (US CPI next week).

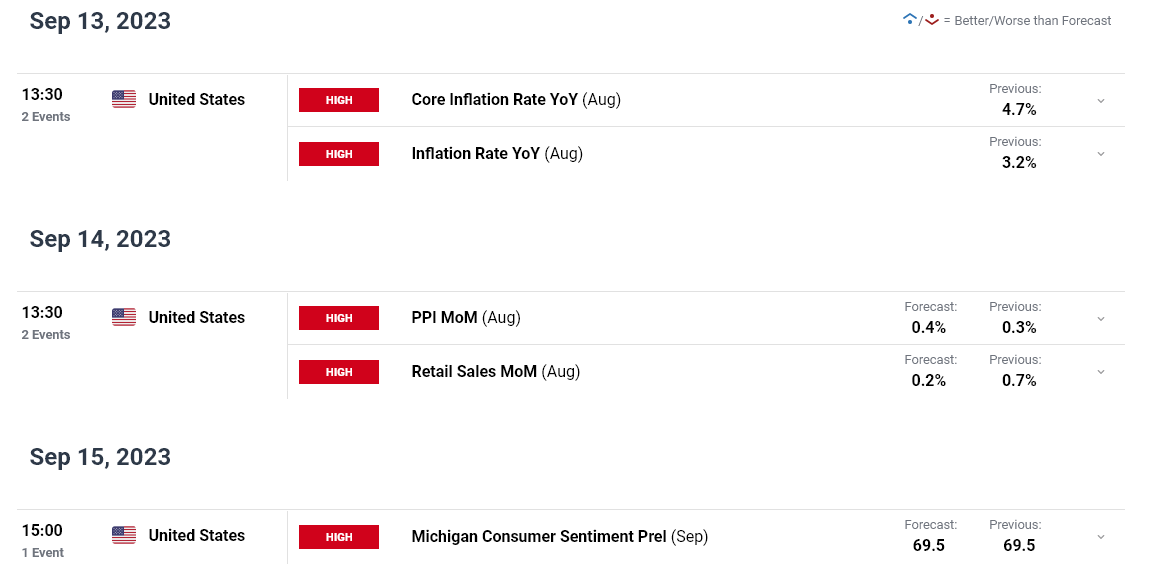
Next week Wednesday is the big one where we get further insight into US inflation a week before the Fed meeting. PPI data has also been known to cause dollar repricing in the past as PPI dynamics tend to lead CPI trends. US retail sales for August will then provide more insight into the strength of consumer appetite at a time when higher interest rates are meant to constrain spending. However, with an unemployment rate of under 4%, there is still a lot of money changing hands.

image3.png

Asian Indices Look for Upward Momentum: Hang Seng, Kospi, Straits Times Index Setups

Asian Indices Look for Upward Momentum: Hang Seng, Kospi, Straits Times Index Setups

Hang Seng Index: Downward momentum is picking up

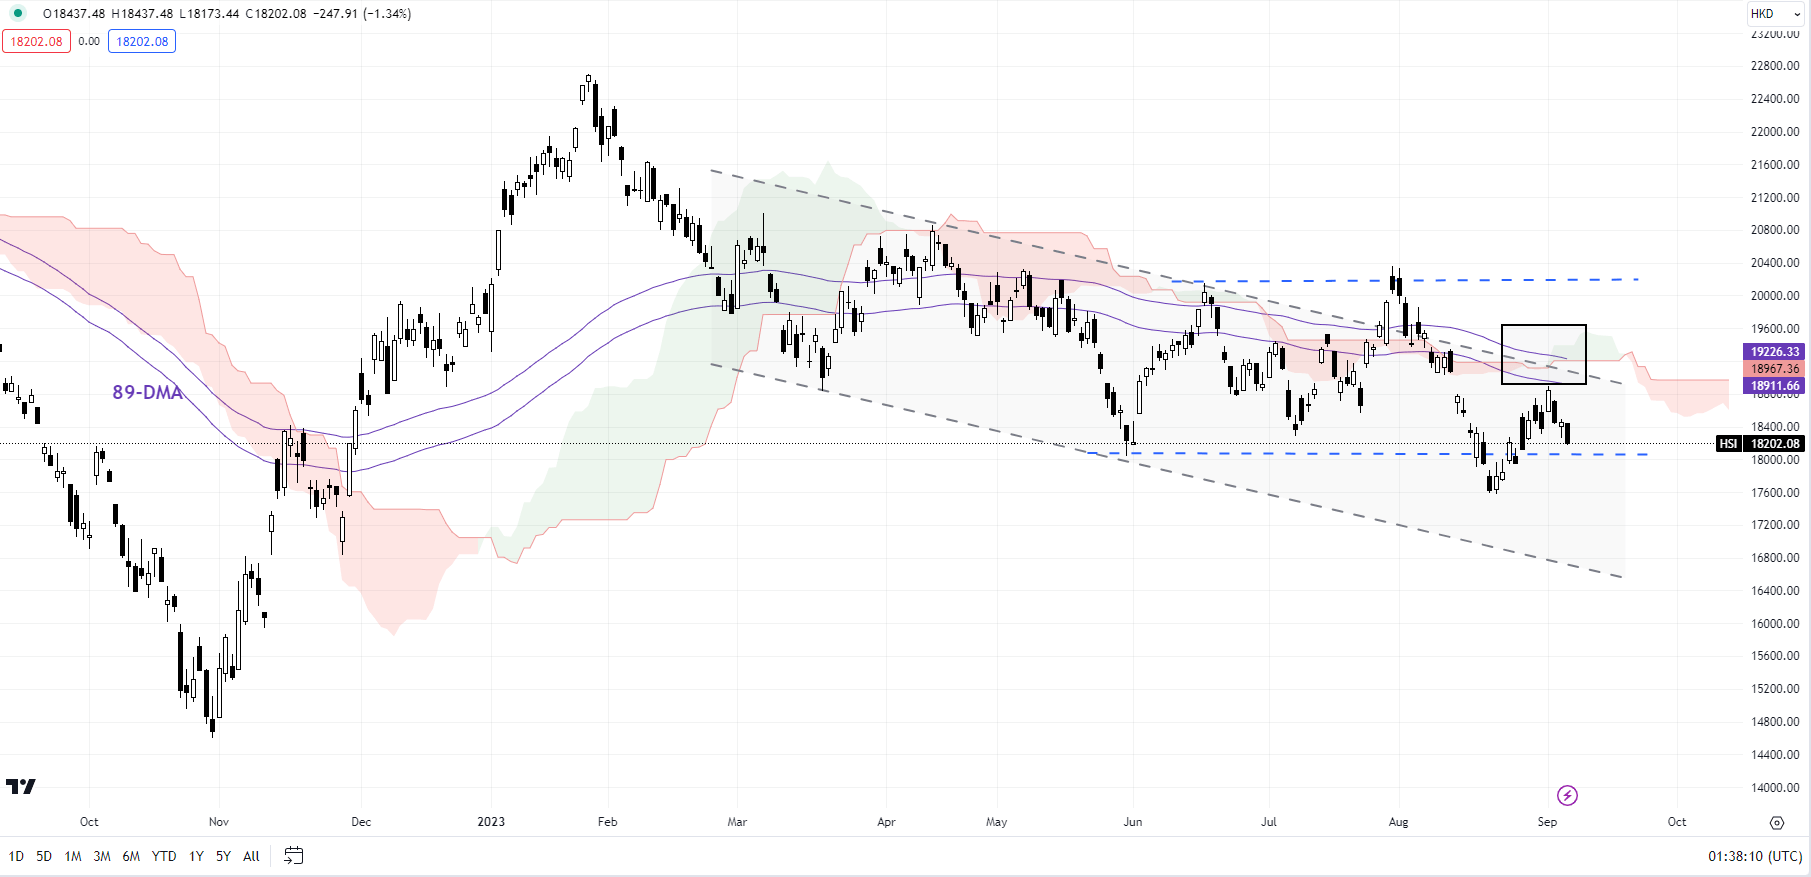
The failure of the Hang Seng Index to clear a crucial barrier on the 89-day moving average, the upper edge of a declining channel since early 2023, and the Ichimoku cloud on the daily charts (at about 18900-19200) suggests the recent rally is nothing more than corrective. This follows a rebound from near a tough floor at the June low of 18045.

Hang Seng Index Daily Chart

image1.pngA decisive break above would raise the chances that the Hong Kong benchmark index was finally beginning to flex muscles after underperforming since early 2023. Indeed, such a break would heighten the chances of the index clearing the few-times tested resistance at 20155. On the downside, a failure to hold above last month’s low of 17575 could open the way initially toward the November 2022 low of 16830.

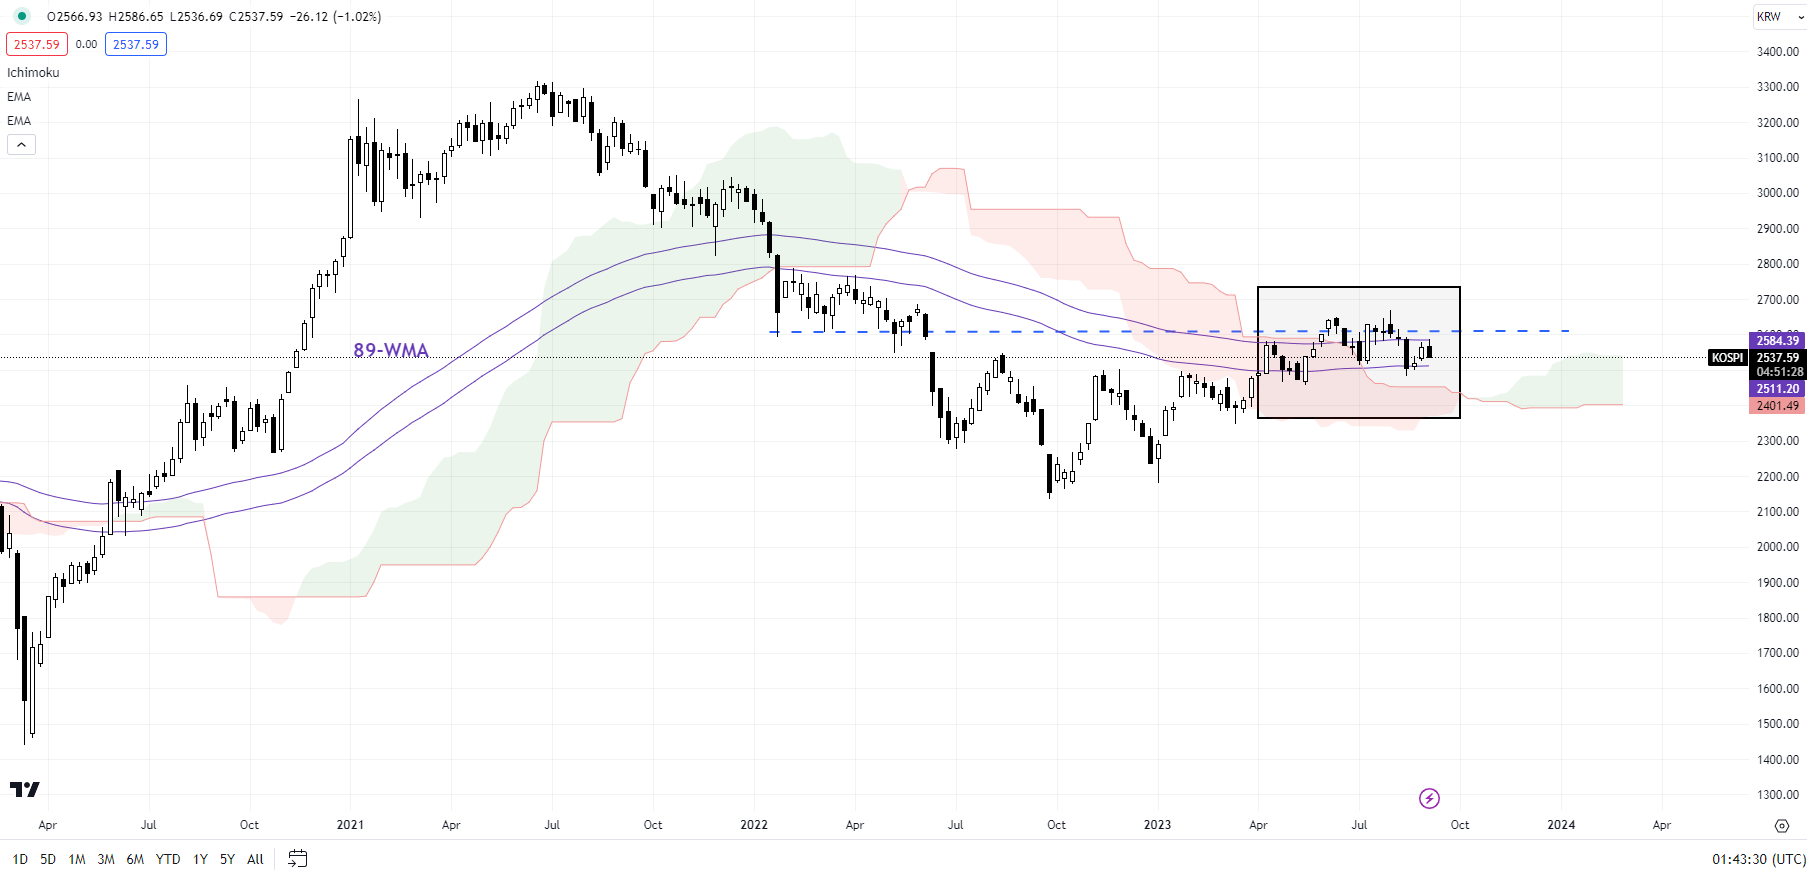
Kospi Weekly Chart

image2.png

Kospi: May have peaked for now

A double top at major resistance and a lower low created in August raises the odds that Kospi’s rally this year could be reversing. A break below the crucial support at the July low of 2515 has triggered a minor double top (the June and August highs), potentially opening the door toward 2380. Stronger support is at the March low of 2350 – Kospi needs to hold above this support for the rebound from late last year to resume. The index has faced stiff converged resistance on the 89-week moving average, a horizontal trendline since 2022, around the upper edge of the Ichimoku cloud on the weekly charts.

FTSE Straits Times Index Monthly Chart

image3.png

FTSE Straits Times Index: Still struggling to find a direction

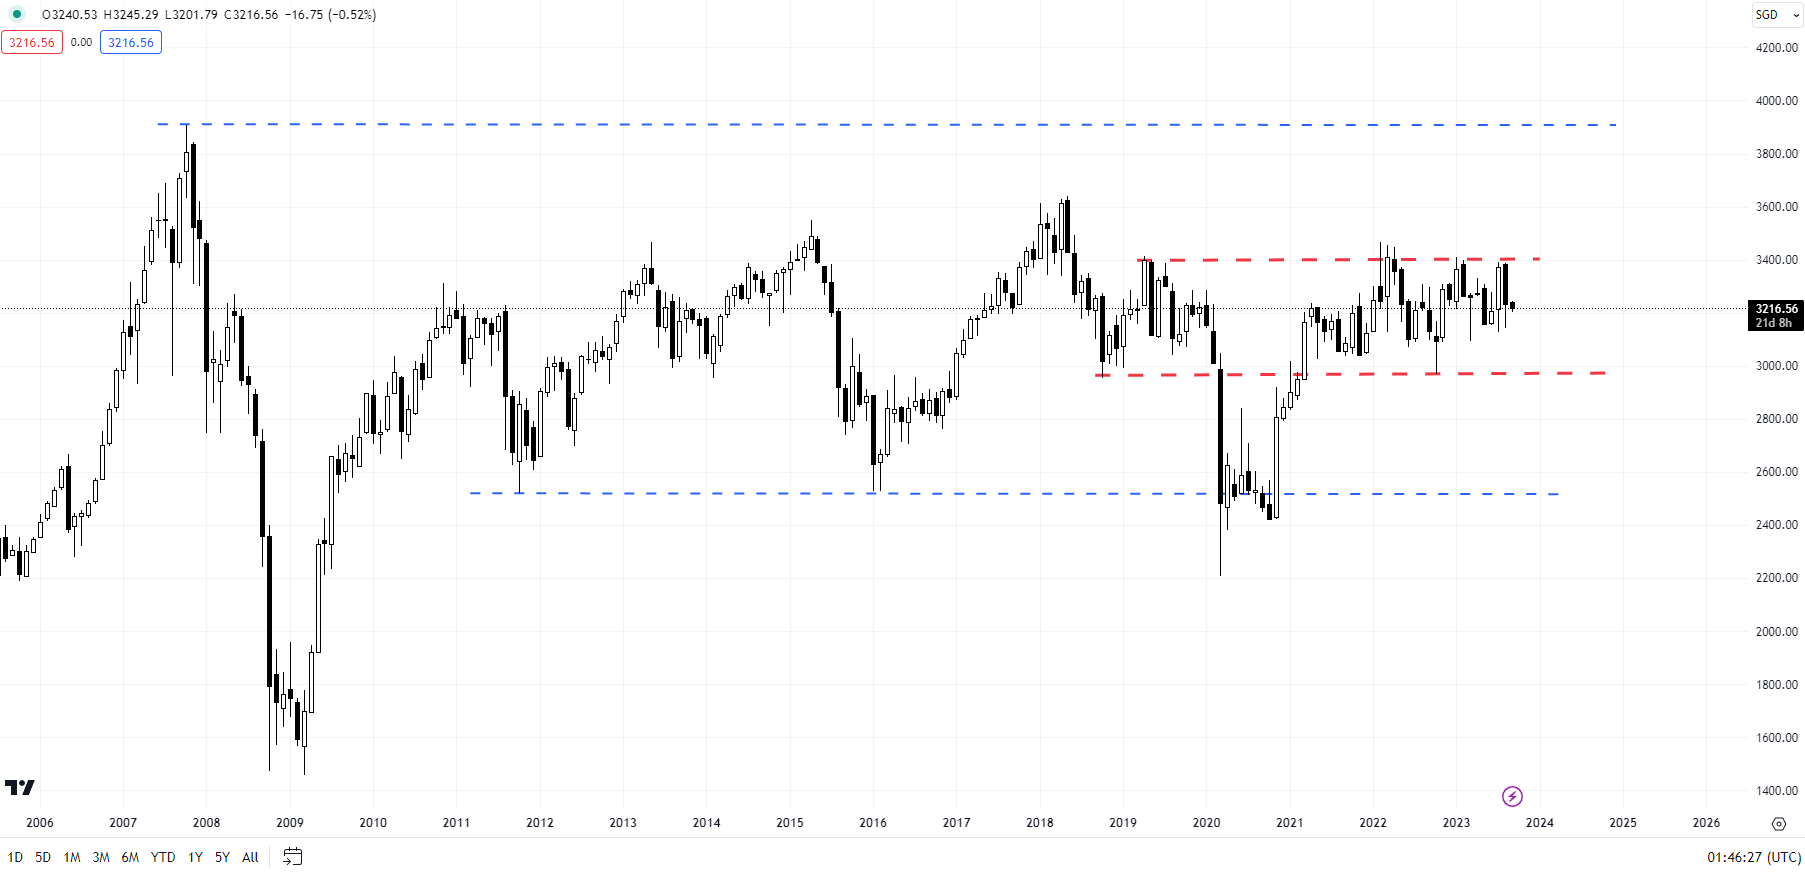
Singapore’s FTSE Straits Times Index continues to trend within a narrow range of 3000-3400. Barring the brief low of 2968 created in Q4-2022, the index appears to have set a solid low around 2950-3050, which includes the 200-week moving average. As mentioned in the previous update, a break below is by no means imminent – it could well rebound as it has done multiple times since 2021. See “Asian Indices Feel the Heat of Rising Yields: Hang Seng, Kospi, Straits Times Index Setups,” published August 22.

However, any break below could raise the odds that the post-Covid rebound is over, putting the index back within a very broad range of 2200-3500 (including the 2020 low and the 2022 high). For the bullishness to resume, a crack above resistance at the 2022 high would be needed. Until then, the path of least resistance remains sideways to down.

British Pound Forecast: GBP/USD Head & Shoulders in Play, GBP/JPY Holding at Support

British Pound Forecast: GBP/USD Head & Shoulders in Play, GBP/JPY Holding at Support

The British Pound may extend lower in the coming trading sessions. That is because GBP/USD confirmed a breakout under a bearish Head & Shoulders chart formation over the past few days. Now, the next obstacle to the downside is the 200-day Moving Average, which is immediate support. This has been maintaining the dominant upside bias.

Breaking under could open the door to a broader bearish reversal towards the May low of 1.2308. From there, confirming lower exposes the March low of 1.1804. Otherwise, a bounce off the moving average places the focus on the neckline around 1.2592. Clearing higher would place the focus back to the upside.

image1.png

Meanwhile, the British Pound is also appearing toppy against the Japanese Yen. Prices are consolidating just above the 184.013 inflection point from June. This follows persistent negative RSI divergence, showing that upside momentum is fading. Now, the 50-day Moving Average is in focus as key support. This has been maintaining the broader upside technical bias.

Breaking lower would expose the July low of 176.33, opening the door to a broader reversal. That would expose the 38.2% Fibonacci retracement level of 173.06. In the event of a turn higher from here, the focus will instead be placed on the current 2023 high of 186.76. Pushing beyond that exposes the November 2015 peak of 188.81.

image2.png


When Can S&P 500 Volatility Break a Stock Diversification Strategy? Analyzing the VIX

When Can S&P 500 Volatility Break a Stock Diversification Strategy? Analyzing the VIX

What is Stock Sector Diversification?

If an investor wants to diversify exposure in the US stock market, there are plenty of sectors to choose from in the S&P 500. On the pie chart below, there are 11 to pick that range from growth-oriented information technology to value-centered industrial firms. To hedge against sector-specific risks, a trader could spread out their portfolio between some combination of these.

In such a case, if the S&P 500 hits a bump, losses in one corner of the market might be offset or be reduced by gains in another. This might work if all the sectors in the market are not falling in unison. However, when almost every corner of the index is declining in a binary move, a stock diversification strategy becomes increasingly unreliable.

This is not a case against a stock diversification strategy. Rather, this is analyzing conditions in the market that impact sectors moving together in the S&P 500. This is performed using the CBOE Volatility Index (VIX), also known as the market’s preferred ‘fear gauge’. With that in mind, what levels of VIX should traders and investors watch that risk undermining a stock diversification strategy?

S&P 500 Sector Breakdown
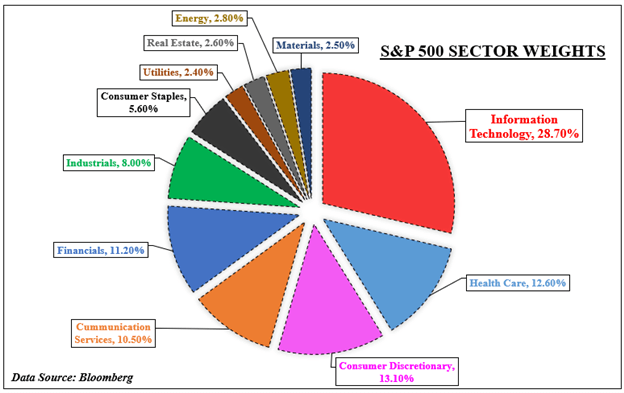
S&P 500 Sectors

What is the VIX and Why Should Traders Watch it?

The VIX was created in 1990 to use as a benchmark for analyzing volatility projections in the US stock market. It trades in real-time, reflecting expectations of the price movement over the next 30 days. As such, it tends to have a very close inverse relationship with the S&P 500. In other words, as stocks fall, the VIX rises and vice versa. For a deeper dive into the VIX, check out a complete guide here.

This inverse relationship can be seen in the next chart, which shows the average S&P 500 performance compared to equivalent VIX levels since 2002. For the study, average weekly data is used to calculate monthly outcomes. This is done so that it helps avoid truncating the ‘volatility of volatility’, whereas a monthly reading could run into the data failing to capture the broader trend.

Looking at the data, April tended to see the most optimistic performance for the S&P 500, averaging 2.06%. Afterwards, this performance tapered before bottoming in October, when the benchmark stock index returned about -0.1%. During this period, we saw the VIX climb, starting at 18.30 in April, then rising to 21.23 in October. Knowing this, we can now look at what happens within the S&P 500.

VIX Versus the S&P 500
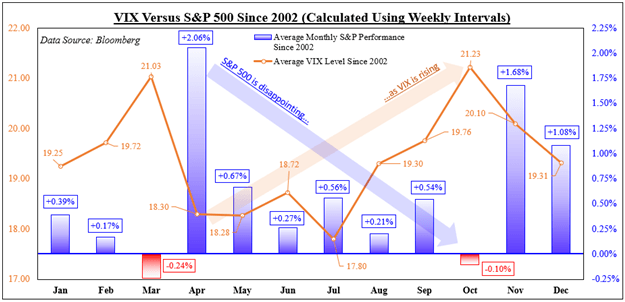
VIX Versus the S&P 500

S&P 500 Cross-Sector Correlations with the VIX

To see when a stock sector diversification strategy can fail, we will need dedicated price indices of the 11 sectors in the S&P 500. The data used for the latter only goes back to 2002. We can then find correlation levels between the VIX and for each sector using a one-month rolling basis. The correlations range between -1 and 1. A -1 reading means perfect inverse movements between two variables, while 1 is perfect unison.

Averaging all 11 outcomes in each period offers a cross-sector correlation reading with the VIX. Next, the correlations are separated into groups ranging from strong (-1 to -0.75), medium (-0.75 and -0.50), and weak (all values greater than -0.5). A strong inverse reading reflects the VIX rising/falling as sectors dropped/climbed together with the most consistency. Weak ones represent sectors moving more freely.

In 7 out of 12 months, higher levels of VIX were associated with stronger cross-sector inverse correlations with the ‘fear gauge’. For example, the average weekly price of the VIX in March was 26.55 when the S&P sectors moved the most in unison. The price dropped to 15.28 when we saw sectors move more freely. Knowing this, what levels of VIX can undermine a cross-sector diversification strategy?

VIX Price Versus Different Levels of S&P Cross-Sector Inverse Correlations
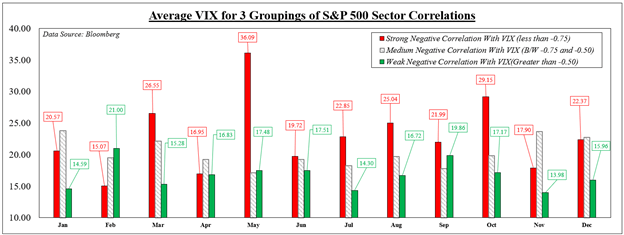
VIX Price Versus Different Levels of S&P Cross-Sector Inverse Correlations

When Can a Stock Sector Diversification Strategy Fail?

We can now average the prices of the VIX for all months and years since 2002 based on the 3 correlation groupings. Simultaneously, we will average the weekly performance of all the S&P sectors and align them based on the same categories. On the chart below, we can see that the outcome was fairly predictable. Stronger inverse correlations with the VIX aligned with increasingly worse performance between sectors.

When we saw all the sectors move the most opposite to the VIX, the average price of the ‘fear gauge’ was 22.85. When this occurred, the average return of each sector was -0.47%. Conversely, when the sectors moved more freely relative to the VIX, the price of the latter was 16.72. At that price, the average return between each sector was +1.08%.

It should be noted that correlation does not imply causation. Just because the VIX is at some arbitrary price does not mean that it is the sole cause of trading dynamics between sectors. Rather, it is being used here as a frame of reference. What actually causes markets to fall in binary moves is a combination of fundamental factors: monetary policy, fiscal spending, company guidance and more.

What Can Traders Do About Volatility?

Knowing this information, what can traders do when expecting high volatility and strong cross-correlations across market sectors? High bursts of volatility are often short-lived and temporary. During these times, haven-oriented assets tend to outperform. This includes the US Dollar, which often rises during times of global market stress. Short selling stocks is another. Scaling back exposure on current and new undertakings also help. Combining these could help prepare traders for some bumpy roads.

VIX Price Versus Performance of S&P 500 Sectors Based on Correlation Groupings
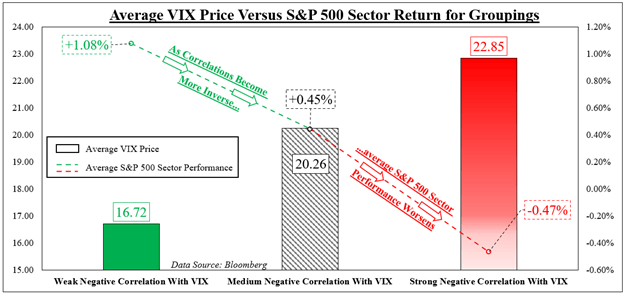
VIX Price Versus Performance of S&P 500 Sectors Based on Correlation Groupings

 

Oil Prices Forecast: Navigating the Bullish Surge Amid OPEC Production Cuts, US Inventory Drops

Oil Prices Forecast: Navigating the Bullish Surge Amid OPEC Production Cuts, US Inventory Drops

U.S. Oil Inventory Dynamics

U.S. crude oil inventories were projected to drop by 5.5 million barrels for the week ending Sept. 1, an indicator of tightening supplies. This projection comes from market sources referencing data from the American Petroleum Institute (API). Confirmatory data from the U.S. Energy Information Administration (EIA) will be released at 15:00 GMT on Thursday.

Extended Supply Cuts Boost Prices

Oil prices saw a boost earlier in the week after major oil producers, Saudi Arabia and Russia, chose to prolong their voluntary oil supply cuts until the end of the year. Saudi Arabia slashed its oil production by 1 million barrels per day, whereas Russia reduced its output by 300,000 barrels per day. These decisions came in addition to the earlier production cut in April, agreed upon by several OPEC+ producers, scheduled to run till the end of 2024. It’s also noteworthy that both nations have committed to monthly reviews of these cuts based on prevailing market conditions.

Advertisement
Know where WTI Crude Oil is headed? Take advantage now with

Trading Derivatives carries a high level of risk to your capital and you should only trade with money you can afford to lose. Trading Derivatives may not be suitable for all investors, so please ensure that you fully understand the risks involved, and seek independent advice if necessary. A Product Disclosure Statement (PDS) can be obtained either from this website or on request from our offices and should be considered before entering into a transaction with us. Raw Spread accounts offer spreads from 0.0 pips with a commission charge of USD $3.50 per 100k traded. Standard account offer spreads from 1 pips with no additional commission charges. Spreads on CFD indices start at 0.4 points. The information on this site is not directed at residents in any country or jurisdiction where such distribution or use would be contrary to local law or regulation.

Short-Term Market Responses

The anticipation of dwindling U.S. crude oil inventories, coupled with the continued production cuts from Saudi Arabia and Russia, caused oil prices to rally. Brent crude futures climbed to $90.60 a barrel, and U.S. West Texas Intermediate (WTI) crude futures reached $87.54. The present Brent futures trade near a nine-month high, suggesting the market is pricing in a short-term supply crunch.

Economic Factors and Concerns

However, the global economy presents potential headwinds for oil. The U.S. dollar’s recent surge might impact oil demand, as a robust dollar renders crude oil more costly for those dealing in other currencies. Furthermore, looming rate-hike fears and uncertainties surrounding the economic landscape are acting as counterweights. Analysts also caution that the upcoming maintenance period for U.S. refineries in September-October could curb demand.

Forecast: Mixed Signals Ahead

While the short-term view might appear bullish due to shrinking inventories and supply cuts, several factors could dampen the upward trajectory. These include the U.S. dollar’s strength, potential oil supply boosts from nations like Iran, Venezuela, and Libya, and upcoming refinery maintenance schedules. Consequently, traders should remain alert to both bullish and bearish pressures in the coming weeks.

Technical Analysis

4-Hour Light Crude Oil FuturesThe Light Crude Oil Futures is exhibiting a bullish stance. The current 4-hour price of $87.24 is comfortably above both the 200-4H moving average of $81.51 and the 50-4H moving average of $83.73, confirming a strong upward trajectory. The 14-4H RSI reading at 65.47 underscores this bullish sentiment, indicating stronger momentum, although nearing overbought territory.

While the price is currently sandwiched between the main support zone of $84.89 to $83.81 and the resistance area of $88.68 to $90.10, its position above both crucial moving averages solidifies the prevailing bullish sentiment in the market.

Dax Index: DAX Stocks Feel the Heat from Eurozone’s Looming Slowdown

Dax Index: DAX Stocks Feel the Heat from Eurozone’s Looming Slowdown

DAX Falls for the Fourth Consecutive Session

On Wednesday, the DAX extended its losses, falling by 0.19%. Following a 0.34% loss on Tuesday, the DAX ended the day at 15,741.

German Factory Orders Concern the Markets

European markets faced a downturn on Wednesday due to concerning economic indicators from Germany. A decline in German factory orders raised recession concerns. Despite the manufacturing sector making up less than 20% of the German economy, the slump raised eyebrows.

Trading Derivatives carries a high level of risk to your capital and you should only trade with money you can afford to lose. Trading Derivatives may not be suitable for all investors, so please ensure that you fully understand the risks involved, and seek independent advice if necessary. A Product Disclosure Statement (PDS) can be obtained either from this website or on request from our offices and should be considered before entering into a transaction with us. Raw Spread accounts offer spreads from 0.0 pips with a commission charge of USD $3.50 per 100k traded. Standard account offer spreads from 1 pips with no additional commission charges. Spreads on CFD indices start at 0.4 points. The information on this site is not directed at residents in any country or jurisdiction where such distribution or use would be contrary to local law or regulation.

The simultaneous contraction of the services and the manufacturing sectors remains alarming.

Eurozone retail sales declined more than expected in July, adding to the gloomy mood.

US ISM Non-Manufacturing PMI Sends the Fed A Message

Hopes of more clarity about Fed monetary policy goals faded on Wednesday. Higher-than-expected US ISM Non-Manufacturing PMI numbers for August refueled bets on one final Fed interest rate hike.

Beyond the headline PMI, a jump in new orders, prices, and employment across the services sector contributed to the more hawkish outlook.

The better-than-expected numbers and influence on Fed bets delivered a bearish end to the European session.

The Wednesday Market Movers

Commerzbank was among the worst performers for the second consecutive session, sliding 3.27%. On Tuesday, Commerzbank tumbled by 6.10% as investors responded to the news of Barclays downgrading Commerzbank to ‘underweight.’ Deutsche Bank also struggled, falling by 1.94%.

Today’s Session

It could be another tough day for the DAX. German industrial production numbers will draw interest early in the session. While investors expect another decline in production (-0.5%), the size matters.

Later in the session, Eurozone employment and GDP numbers for the second quarter will also move the dial. Considering the latest private sector PMIs, weaker growth in the second quarter would increase the fear of a euro area recession. Economists forecast Eurozone growth to slow from 1.1% to 0.6% year-over-year.

Weaker growth would ease pressure on the ECB to hike rates to tackle demand-driven inflation. A deteriorating macroeconomic environment will impact employment and consumption.

The DAX Futures was down 30 points this morning.

US Jobless Claims and the Fed in Focus

Later in the European session, US jobless claims and Fed speeches need consideration. Steady jobless claim numbers would align with the ISM Non-Manufacturing Employment figures, signaling tight labor market conditions. Economists forecast initial jobless claims to rise from 228k to 234k.

However, investors should monitor FOMC member speeches. FOMC member Harker will speak before the end of the European session. A hawkish outlook on interest rates would test buyer appetite.

Short-Term Forecast

The prospects of a final Fed rate hike and the deteriorating euro area macroeconomic environment are unfavorable for the DAX. German economic indicators expose the DAX to a gloomy outlook.

DAX Technical Indicators

Daily Chart

Despite the fourth daily loss, the DAX avoided a break below the trend line and 15,663 support level. However, the DAX remains below the 5-day EMA, sending bearish near-term price signals.

Better-than-expected German and Eurozone economic indicators would support a run at the 50-day EMA. However, US jobless claims and Fed commentary must be DAX-friendly to end the losing streak.

Better-than-expected US labor market stats and hawkish Fed chatter would support a break below the trend line and 15,663 support level.

The 14-Daily RSI reading of 45.00 allows a fall to sub-15,600 before hitting oversold territory.

DAX Daily Chart sends bearish near-term price signals.
DAX 070923 Daily Chart

4-Hourly Chart

The DAX sits below the 50-day and 200-day EMAs, sending bearish price signals. A slide in German industrial production and weaker Eurozone GDP numbers would deliver another bearish session. A DAX break below the trend line would give the bears a run at the 15,663 support level.

However, a hold above the trend line and upbeat euro area numbers would bring the 50-day EMA into play. US labor market numbers and Fed commentary must ease hawkish Fed bets for the DAX to avoid a late pullback.

The 43.57 RSI reading gives the DAX room to slide below the trend line before entering oversold territory.

4-Hourly Chart affirms bearish near-term price signals.
DAX 070923 4-Hourly Chart