EUR/USD Forecast: Amid Eurozone Woes, Hawkish Fed Voices Might Weigh on Pair’s Prospects

EUR/USD Forecast: Amid Eurozone Woes, Hawkish Fed Voices Might Weigh on Pair’s Prospects

On Wednesday, the EUR/USD gained 0.05%. Following a 0.67% fall on Tuesday, the EUR/USD ended the day at $1.07269. The EUR/USD rose to a high of $1.07488 before falling to a low of $1.07023.

German Industrial Production and Eurozone GDP Numbers in Focus

The German economy is in the spotlight again. Industrial production figures for July will set the tone. Investors expect production to decline by 0.5% in July. However, the latest factory order numbers suggest a more marked decline.

Trading Derivatives carries a high level of risk to your capital and you should only trade with money you can afford to lose. Trading Derivatives may not be suitable for all investors, so please ensure that you fully understand the risks involved, and seek independent advice if necessary. A Product Disclosure Statement (PDS) can be obtained either from this website or on request from our offices and should be considered before entering into a transaction with us. Raw Spread accounts offer spreads from 0.0 pips with a commission charge of USD $3.50 per 100k traded. Standard account offer spreads from 1 pips with no additional commission charges. Spreads on CFD indices start at 0.4 points. The information on this site is not directed at residents in any country or jurisdiction where such distribution or use would be contrary to local law or regulation.

Despite constituting only 20% of its economy, data from the German manufacturing sector continues to impact the EUR/USD due to the declining macroeconomic climate. Lower production could lead to fewer jobs, decreasing consumption, and softer demand-driven inflation.

Later in the session, Eurozone GDP figures for the second quarter will also move the dial. Weaker-than-expected numbers would fuel recessionary jitters. Economists project the Eurozone economy to grow by 0.6% year-over-year versus 1.1% in the previous quarter.

Significantly, the darkening economic outlook should ease pressure on the ECB to raise rates higher.

US Jobless Claims and Fed Speakers

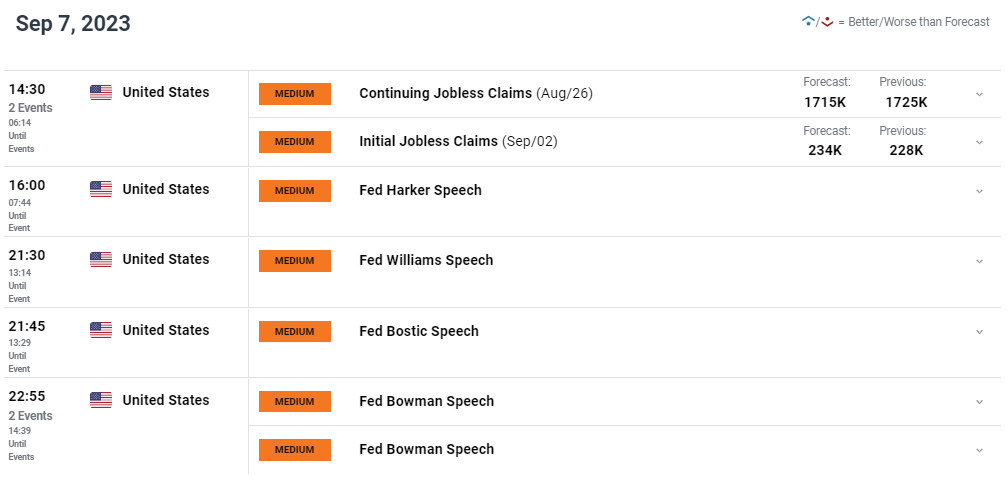
This afternoon, US jobless claims will draw interest. After the higher-than-expected ISM Non-Manufacturing PMIs, steady jobless claims would support a more hawkish Fed. Tight labor market conditions support wage growth. Wage growth dilutes the effect of Fed rate hikes, fueling consumption and demand-driven inflation.

However, FOMC member speeches also need consideration today. FOMC members Harker, Bowman, and Fed Vice Chair Williams are on the calendar to speak. Hawkish comments vis-à-vis interest rates would weigh on the EUR/USD.

Short-Term Forecast:

Economic indicators from the euro area and the US signal diverging economies. Better-than-expected US economic indicators could also fuel monetary policy divergence in favor of the Dollar.

EUR/USD Price Action

Daily Chart

The EUR/USD stayed below the 50-day and 200-day EMAs, sending bearish price signals. A diverging macroeconomic picture between the Euro area and the US also left the EUR/USD below the trend line and $1.07635 resistance level.

Another round of weak numbers from the euro area would bring sub-$1.0650 and the $1.06342 support level into view. However, US labor market numbers and Fed speakers must send more hawkish Fed signals to support a sharp pullback.

A move through the $1.07635 resistance level would give the bulls a run at the trend line. However, numbers from the Eurozone must impress to support a breakout session.

Considering the 14-Daily RSI at 34.49, the EUR/USD can return to sub-$1.0650 before hitting oversold territory.

EUR/USD Daily Chart sends bearish price signals.
EURUSD 070923 Daily Chart

4-Hourly Chart

The EUR/USD remains below the 200-day and 50-day EMAs, reaffirming the bearish price signals. Notably, the EUR/USD struggles below the trend line and the $1.07635 resistance level. Better-than-expected economic indicators from the euro area would support a breakout from $1.0750 to target the trend line. However, US labor market figures must disappoint to bring the trend line into play.

A slide in German industrial production and weaker-than-expected Eurozone GDP numbers would give the bears a run at the $1.06342 support level.

The 14-4H RSI at 32.21 indicates the EUR/USD has room to reach $1.0650 before entering oversold territory.


4-Hourly Chart affirms bearish price signals.
EURUSD 070923 4 Hourly Chart
Silver Prices Forecast: XAG/USD Dips as Dollar’s Might Overshadows

Silver Prices Forecast: XAG/USD Dips as Dollar’s Might Overshadows

Dollar’s Resilience Dampens Silver’s Luster

Silver’s trajectory has dipped, hovering close to a one-week low for the fifth session in a row. This is in stark contrast to the U.S. dollar, which is flexing its muscles at the highest point since mid-March, propelled by upbeat U.S. services sector data pointing to steady inflationary forces.

Economic Backdrop and Federal Reserve’s Strategy

The Federal Reserve’s stance is pivotal to the equation. Even as rate hikes seem off the table for the current cycle, speculation mounts over a potential rate adjustment in 2024. The cautionary note sounded by Boston Fed President, Susan Collins, underscores this uncertainty. Her message, aligning with the Fed’s recent report, highlights temperate U.S. economic growth. However, challenges persist in the form of a decelerating labor market and easing inflation in the months of July and August.

Trading Derivatives carries a high level of risk to your capital and you should only trade with money you can afford to lose. Trading Derivatives may not be suitable for all investors, so please ensure that you fully understand the risks involved, and seek independent advice if necessary. A Product Disclosure Statement (PDS) can be obtained either from this website or on request from our offices and should be considered before entering into a transaction with us. Raw Spread accounts offer spreads from 0.0 pips with a commission charge of USD $3.50 per 100k traded. Standard account offer spreads from 1 pips with no additional commission charges. Spreads on CFD indices start at 0.4 points. The information on this site is not directed at residents in any country or jurisdiction where such distribution or use would be contrary to local law or regulation.

China’s Economic Hurdles

China, traditionally a heavyweight in the silver consumption arena, is grappling with economic headwinds. Fresh statistics reveal a pronounced 8.8% plummet in exports and a 7.3% pullback in imports for the month of August. The mammoth task of transitioning from an infrastructure-heavy model to a consumption-led blueprint is anticipated to be a rocky road, casting shadows on global economic projections.

Investor Pulse:  The SPDR Gold Trust

The SPDR Gold Trust (GLD), a bellwether for silver-backed assets, recorded a 0.4% dip in its holdings, echoing the diminishing allure of silver. As U.S. interest rates edge higher, the appeal of holding silver, which inherently doesn’t yield interest, diminishes.

Forecast: Clouds on Silver’s Horizon

With the interplay of the mighty U.S. dollar, Federal Reserve’s guarded optimism, and China’s economic challenges, the near-term forecast for silver leans bearish. For savvy investors, the key lies in astutely monitoring this triad, navigating a silver market that’s brimming with uncertainties.

Technical Analysis

4-Hour Silver (XAGUSD)Silver (XAGUSD) is currently priced at $23.08, slightly below its previous 4-hour mark of $23.11. The asset is trading below both the 200-4H moving average ($23.70) and the 50-4H moving average ($24.12), signaling a bearish bias. The 14-4H RSI stands at 24.32, deep into the oversold territory, suggesting potential exhaustion of the current downward momentum.

Price remains above the main support area between $22.70 to $22.28, but is considerably below the main resistance zone of $25.00 to $25.27. Given its position beneath key moving averages and its RSI reading, the market sentiment leans bearish for Silver in this timeframe.

Gold Prices Forecast: Navigating XAU/USD Amid U.S. Dollar Strength, Persistent Inflation

Gold Prices Forecast: Navigating XAU/USD Amid U.S. Dollar Strength, Persistent Inflation

Gold’s Dip Amidst Dollar Strength

Gold (XAU/USD) prices lingered near a one-week low, marking a downward trend across five consecutive sessions. This decline comes as the U.S. dollar achieves its highest since mid-March, buoyed by strong U.S. services sector data from August.

U.S. Economic Indicators and Gold

The U.S. dollar’s strengthening comes on the back of the services sector data, suggesting persistent inflationary pressures. With the Federal Reserve taking a cautious stance, Boston Fed President Susan Collins emphasized a measured approach to future monetary policy adjustments. She recognizes the evident progress in moderating inflation, further highlighted by a Federal Reserve report showing modest economic growth and cooling inflationary pressures during July and August.

Trading Derivatives carries a high level of risk to your capital and you should only trade with money you can afford to lose. Trading Derivatives may not be suitable for all investors, so please ensure that you fully understand the risks involved, and seek independent advice if necessary. A Product Disclosure Statement (PDS) can be obtained either from this website or on request from our offices and should be considered before entering into a transaction with us. Raw Spread accounts offer spreads from 0.0 pips with a commission charge of USD $3.50 per 100k traded. Standard account offer spreads from 1 pips with no additional commission charges. Spreads on CFD indices start at 0.4 points. The information on this site is not directed at residents in any country or jurisdiction where such distribution or use would be contrary to local law or regulation.

Global Insights and Gold Demand

China, a major gold consumer, is undergoing a pivotal economic shift. As the country transitions from an infrastructure and investment focus to a consumption-centric economy, challenges arise. Recent data underscored this, revealing an 8.8% YoY drop in China’s August exports and a 7.3% contraction in imports. Moreover, China’s service activity, despite stimulus efforts, recorded its slowest expansion in eight months.

Gold’s Investment Dynamics

Gold’s investment appeal wanes during periods of rising U.S. interest rates due to the increased opportunity costs of holding the non-yielding asset. This sentiment was evident as the SPDR Gold Trust, the world’s premier gold-backed exchange-traded fund, reported a 0.36% decline in its holdings. The broader investment community, while expecting the Fed to maintain current rates at its upcoming meeting, is still factoring in a 42% likelihood of a rate increase before 2024.

Short-Term Forecast: Bearish Tendencies

Given the prevailing U.S. dollar strength, positive economic data, and the evolving global economic landscape, particularly concerning China, the short-term outlook for gold appears bearish. Investors should closely monitor global economic indicators, especially consumer sentiment and interest rate dynamics, to make informed decisions.

Technical Analysis

4-Hour Gold (XAUUSD)The current 4-hour price of Gold XAUUSD (1919.16) is slightly above its previous close (1919.03). It’s below both the 200-4H moving average (1928.80) and the 50-4H moving average (1932.80), indicating a potential bearish trend. The 14-4H RSI is at 34.20, suggesting weakened momentum and nearing oversold conditions.

Gold’s price is hovering above the main support area (1893.07 to 1885.79) but remains below the primary resistance (1946.99 to 1954.88). Given these indicators, the market sentiment for Gold currently leans bearish on the 4-hour chart.

China Trade Figures Provide Brief Relief – Exports Fall at a Less Marked Pace

China Trade Figures Provide Brief Relief – Exports Fall at a Less Marked Pace

China Trade Terms Improve but Remain a Market Concern

This morning, the Chinese economy came into focus due to Tuesday’s unsettling Services PMI. Recent Caixin PMIs indicated potentially weaker exports due to weak overseas demand.

However, exports were down 8.8% year-over-year, with imports falling by 7.3% in August. Exports declined at a less marked pace than in July. In July, exports slid by 14.5%, with imports falling 12.4%. As a result, the dollar trade surplus narrowed from $80.60 billion to $68.36 billion.

Economists had forecasted the US Dollar trade surplus to narrow from $80.60 billion to $78.00 billion. Notably, they had projected imports and exports to fall by 9.8% and 8.8%, respectively, year-over-year.

Earlier this morning, Australian trade data for July reflected deteriorating trade terms. The trade surplus narrowed from A$10.268 billion to A$8.039 billion. Exports declined by 2.0%, while imports increased by 2.5%.

AUD/USD Reaction to China Trade Balance

Before the China trade figures, the AUD/USD rose to a pre-stat high of $0.63851 before falling to a low of $0.63667.

However, in response to the trade figures from China, the Aussie Dollar rose to a post-stat high of $0.63711 before falling to a low of $0.63666.

This morning, the Aussie Dollar was down 0.20% to $0.63667.

Aussie Dollar shows muted reaction to China trade data.
070923 AUDUSD 1 Minute Chart

Up Next

Philip Lowe will deliver his final speech as the Governor of the RBA. Investors should look for comments relating to the economic outlook and monetary policy. The markets are betting on the RBA ending its monetary policy tightening cycle.

US labor market numbers and FOMC speeches will also draw interest later today. After the hotter-than-expected US ISM Non-Manufacturing PMI, tighter labor market conditions would refuel Fed rate hike bets.

However, investors must track Fed speeches today. FOMC members Bowman, Harker, and Fed Vice Chair John Williams will deliver speeches. We expect the Fed Vice Chair to wield significant influence. Hawkish Fed comments, supportive of further rate hikes, would weigh on riskier assets.

Crude Oil Price Makes New Peak on Supply Cuts and Inventory Run Down. Higher WTI?

Crude Oil Price Makes New Peak on Supply Cuts and Inventory Run Down. Higher WTI?

The crude oil price scaled to new heights again today as traders and hedgers weigh production cuts and a continuing run down of stockpiles.

Earlier this week Saudi Arabia and Russia committed to maintain their production cuts through to the end of this year. The cuts are 1 million and 300k barrels per day respectively.

The squeeze on supply appears to be having the desired effect of pushing prices higher in the near term but could have unintended consequences in the long run if the price of energy ramps up significantly over an extended period.

Aside from potential demand destruction, the Federal Reserve has made it clear that they are resolute in its fight on inflation. If the cost of energy leads to consistently higher prices at the pump, it might contribute to keeping rates higher for longer than would otherwise be the case.

Overnight the US ISM services PMI for August printed at 54.5, notably above forecasts of 52.5 and 52.7 prior. This saw the interest rate market reassess the Fed’s hiking cycle and Treasury yields continued to climb in the aftermath.

With the anaemic outlook for China’s growth and Europe facing its own headwinds, perhaps OPEC+ see slower global economic activity as a reason for the production cuts.

Other data released overnight saw the American Petroleum Institute (API) report reveal another drop of -5.52 million barrels for the week ended September 1st. This was much lower than the -1.429 million anticipated and comes on top of the massive depletion of -11.486 million prior.

Later today the market will be watching out for the US Energy Information Agency’s (EIA) weekly petroleum status report. The market is forecasting for a decrease of around 2 million barrels.

The front-month Bloomberg Nymex WTI crack spread has collapsed over the last week, trading as low as US$ 29.11 a barrel overnight, after nudging US$ 44 in August.

The crack spread is the gauge of gasoline prices relative to crude oil prices and reflects the profit margin of refiners.

The latest Baker Hughes rig count revealed 1 less rig in the US over the week ended September 1st.

So, while stockpiles are being drawn, it is possible that refiners are hesitant to add to production while profit margins are shrinking.

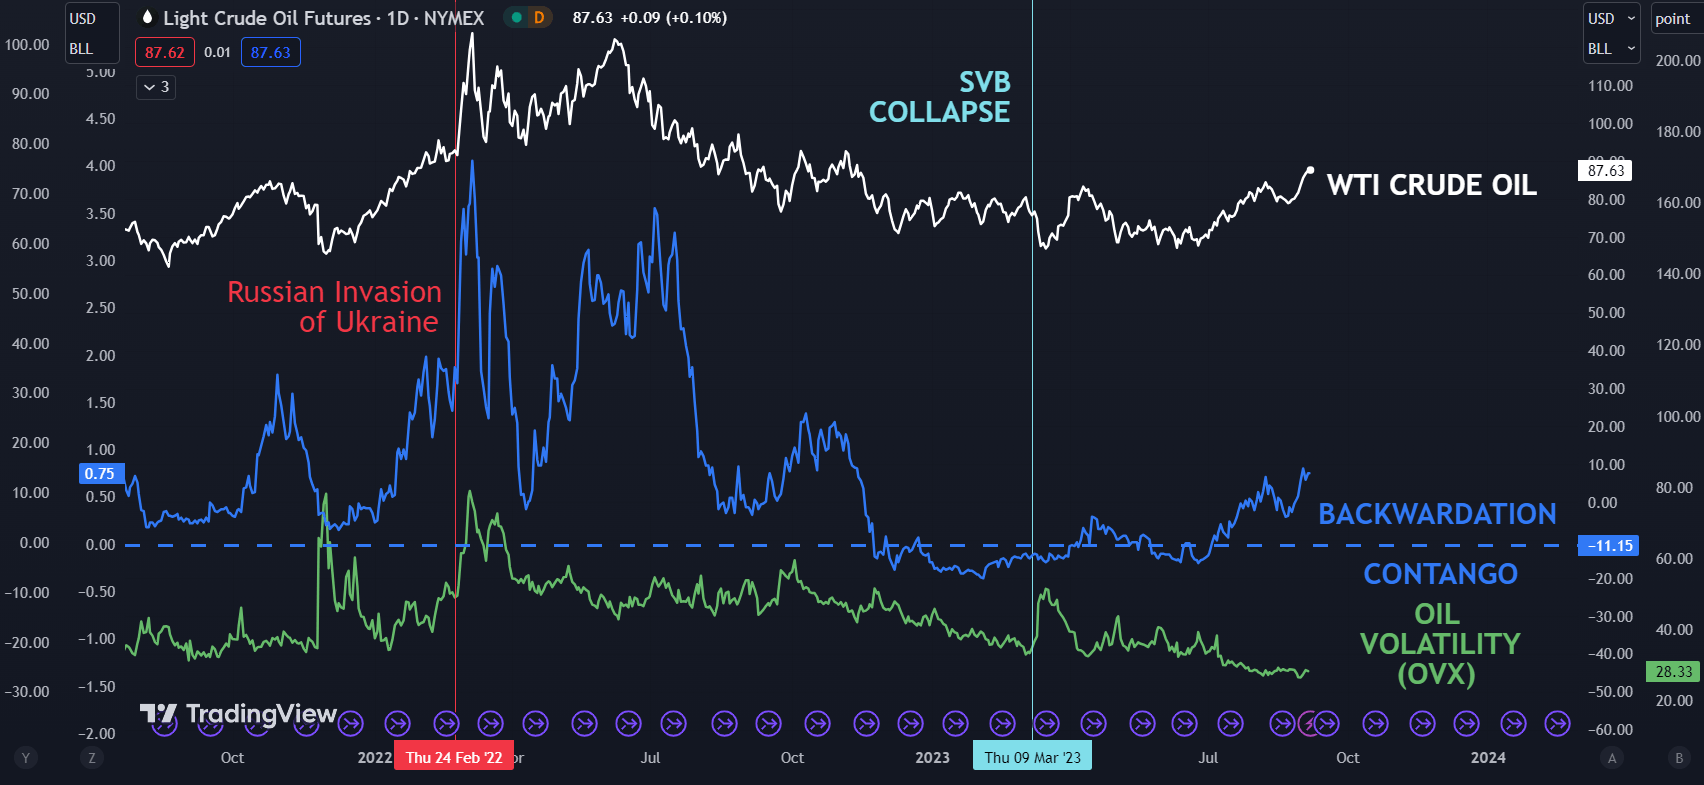
In addition, backwardation between the front 2 WTI futures contracts had been moving in a bullish direction for crude and might support the case that demand in the US is robust for now.

At the same time, the OVX index continues to languish at its lowest level since 2019 which may indicate that the market is not fussed about the surge in prices.

The OVX index measures volatility in the WTI oil price in a similar way that the VIX index gauges volatility on the S&P 500.

At the start of trading on Thursday, the WTI futures contract is a touch above US$ 87.50 bbl while the Brent contract is eyeing US$ 90 bbl at the time of going to print. Live prices can be found here.

For more information on how to trade oil, click on the banner below.

WTI CRUDE OIL, BACKWARDATION AND VOLATILITY (OVX)

image1.png


Australian Dollar Technical Update: AUD/USD Faces Support, AUD/JPY a Symmetrical Triangle

Australian Dollar Technical Update: AUD/USD Faces Support, AUD/JPY a Symmetrical Triangle

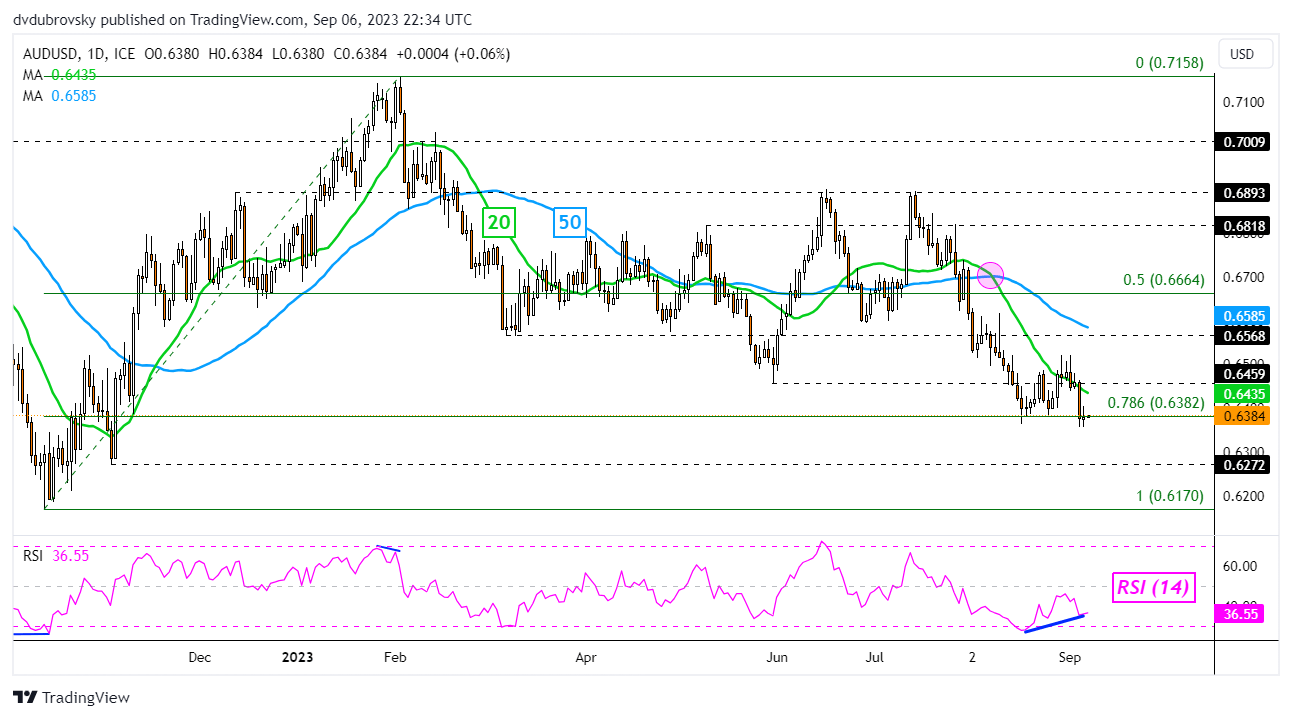
The Australian Dollar closed at its weakest against the US Dollar since early November, opening the door to extending the broader downtrend since the beginning of this year. This is being reinforced by a Bearish Death Cross between the 20- and 50-day Moving Averages (MA) from August, with the former line recently holding as resistance.

But, AUD/USD faces positive RSI divergence. This is a sign of fading downside momentum, which can at times precede a turn higher. Still, in such an outcome, the MA’s could hold as resistance, maintaining the downside technical bias. Otherwise, extending lower places the focus on the November 3rd low of 0.6272 before the 2022 bottom of 0.6170 kicks in.

image1.png

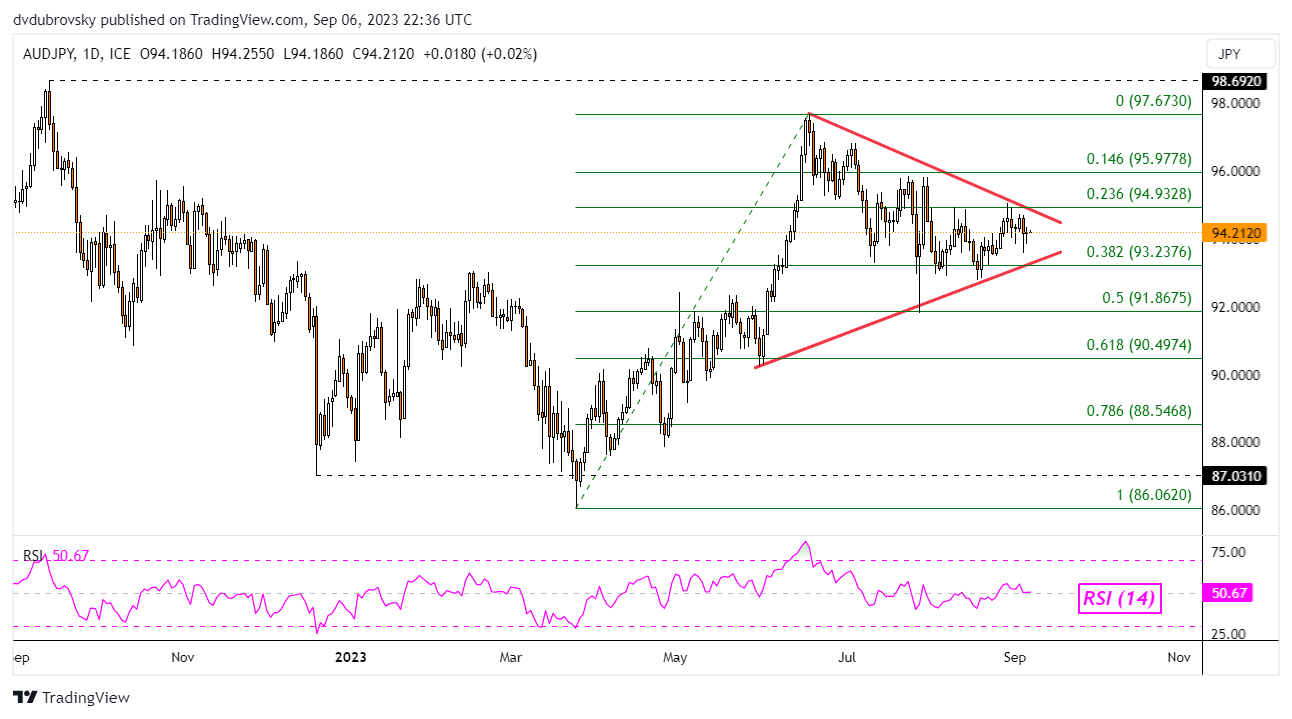
Meanwhile, against the Japanese Yen, the Australian Dollar is facing a different technical situation. A Symmetrical Triangle chart formation has been brewing since earlier this year. Now, AUD/JPY is quickly running out of space to consolidate between rising support and falling resistance. The direction of the breakout could be key for preceding the broader trend.

In the event of an upside breakout, key resistance is the 23.6% Fibonacci retracement level of 94.93. Extending gains could open the door to revisiting the June high of 97.67. Otherwise, key support is the 38.2% level of 93.23. Below the latter sits the midpoint at 91.86. A stronger bearish technical conviction could see the exchange rate drop towards the 61.8% level of 90.49.

image2.png


GBP/USD Price Forecast: Pound Breakdown Post-BoE & UK Housing Data

GBP/USD Price Forecast: Pound Breakdown Post-BoE & UK Housing Data

GBPUSD FUNDAMENTAL BACKDROP

The British pound faced some stiff competition from the US dollar yesterday after US ISM services PMI’s outperformed, resulting in a firming greenback. This morning, cable is marginally lower considering the central bank speak at the BoE MPC Treasury Committee Hearings that suggested a more dovish stance relative to market pricing. Data dependency was emphasized by the BoE’s Governor Bailey while other officials cited moderating inflation across the CPI basket.

This morning, the UK Halifax House Price Index report (see economic calendar below) was released, showing prices declining by the largest percentage year-to-date. A net negative for GBP as per economic theory as a reduction in housing prices tends to lend itself to a decrease in consumer spending, leading to lesser inflationary pressures and subsequently less pressure on the BoE to maintain a hawkish monetary policy stance.

Later today, the US economy will be in focus with jobless claims data expected alongside several Fed speakers. Should jobless claims (particularly initial jobless claims) miss estimates, the pound could be in for further downside to come.

GBP/USD ECONOMIC CALENDAR (GMT +02:00)

image1.pngimage2.png

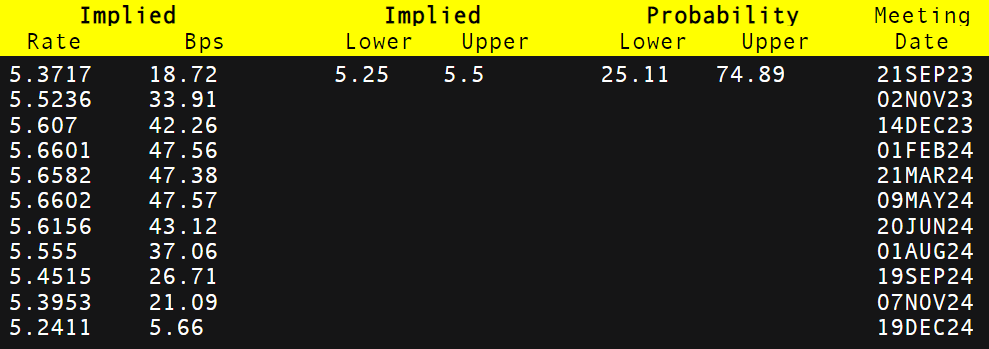
Looking at market pricing for the Bank of England’s (BoE) rate cycle (refer to table below), projections have drastically softened down to 47bps of tightening as opposed to 57bps just yesterday. This dovish repricing has been reflected in the weaker pound throughout yesterday and today.

BANK OF ENGLAND INTEREST RATE PROBABILITIES

image3.png

TECHNICAL ANALYSIS

GBP/USD DAILY CHART

image4.png

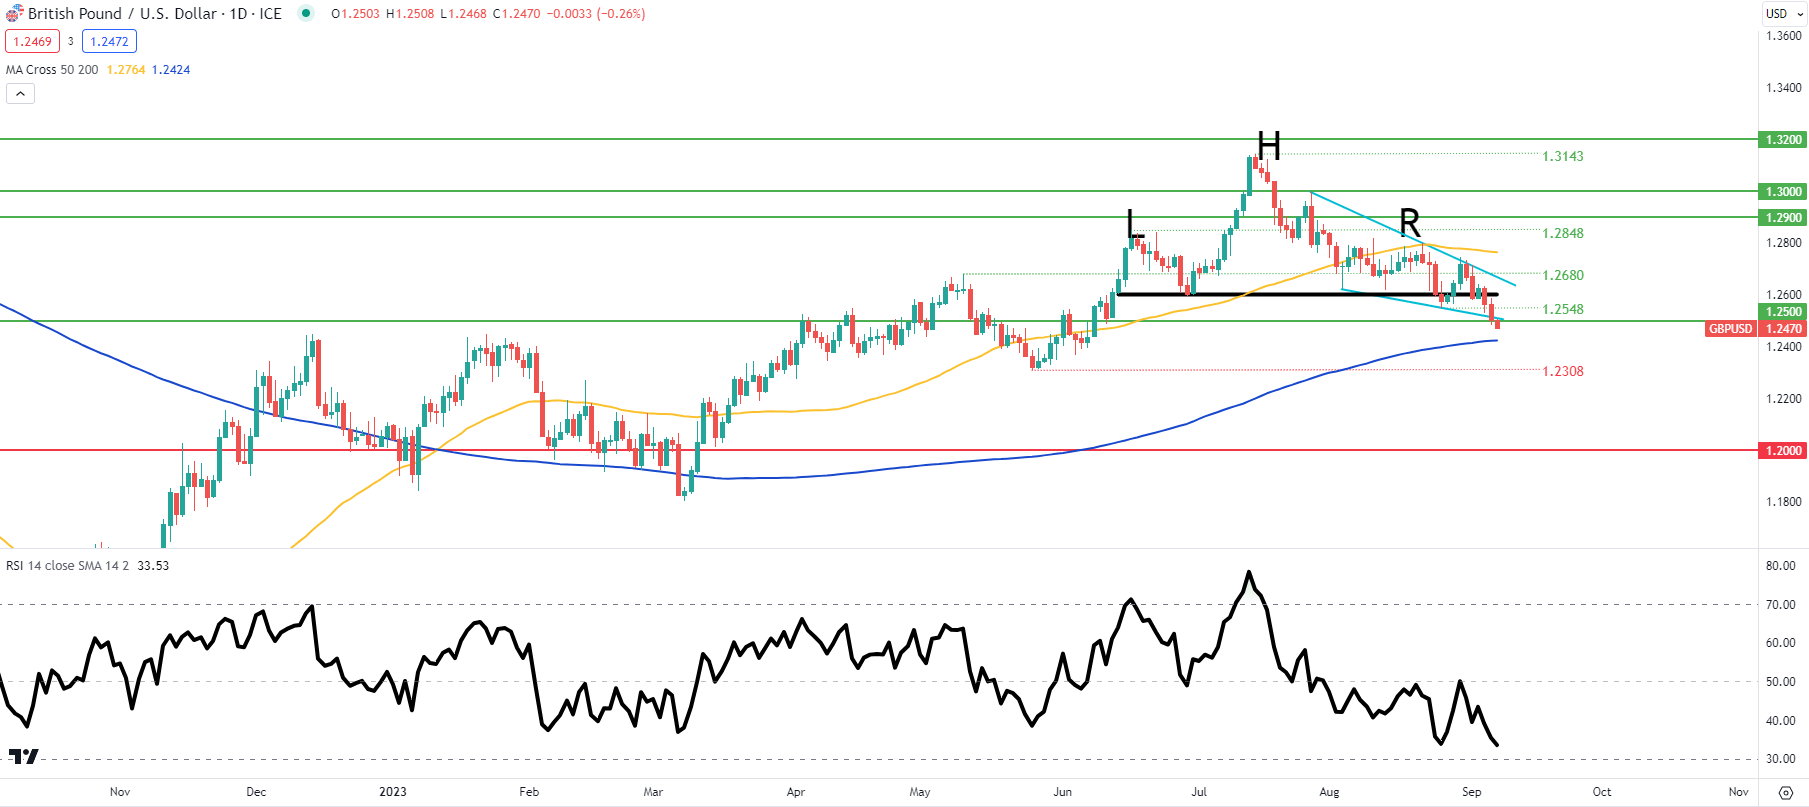
Price action on the daily cable chart above has broken below the short-term falling wedge (blue) thus invalidating the pattern alongside a confirmed breakout below the neckline of the longer-term head and shoulders formation. A daily close below the 1.2500 psychological handle could expose the pair for another leg lower with the first port of call being the 200-day moving average (blue).

Real Yields Continue to Cast Shadow Over Gold: XAU/USD Price Action

Real Yields Continue to Cast Shadow Over Gold: XAU/USD Price Action

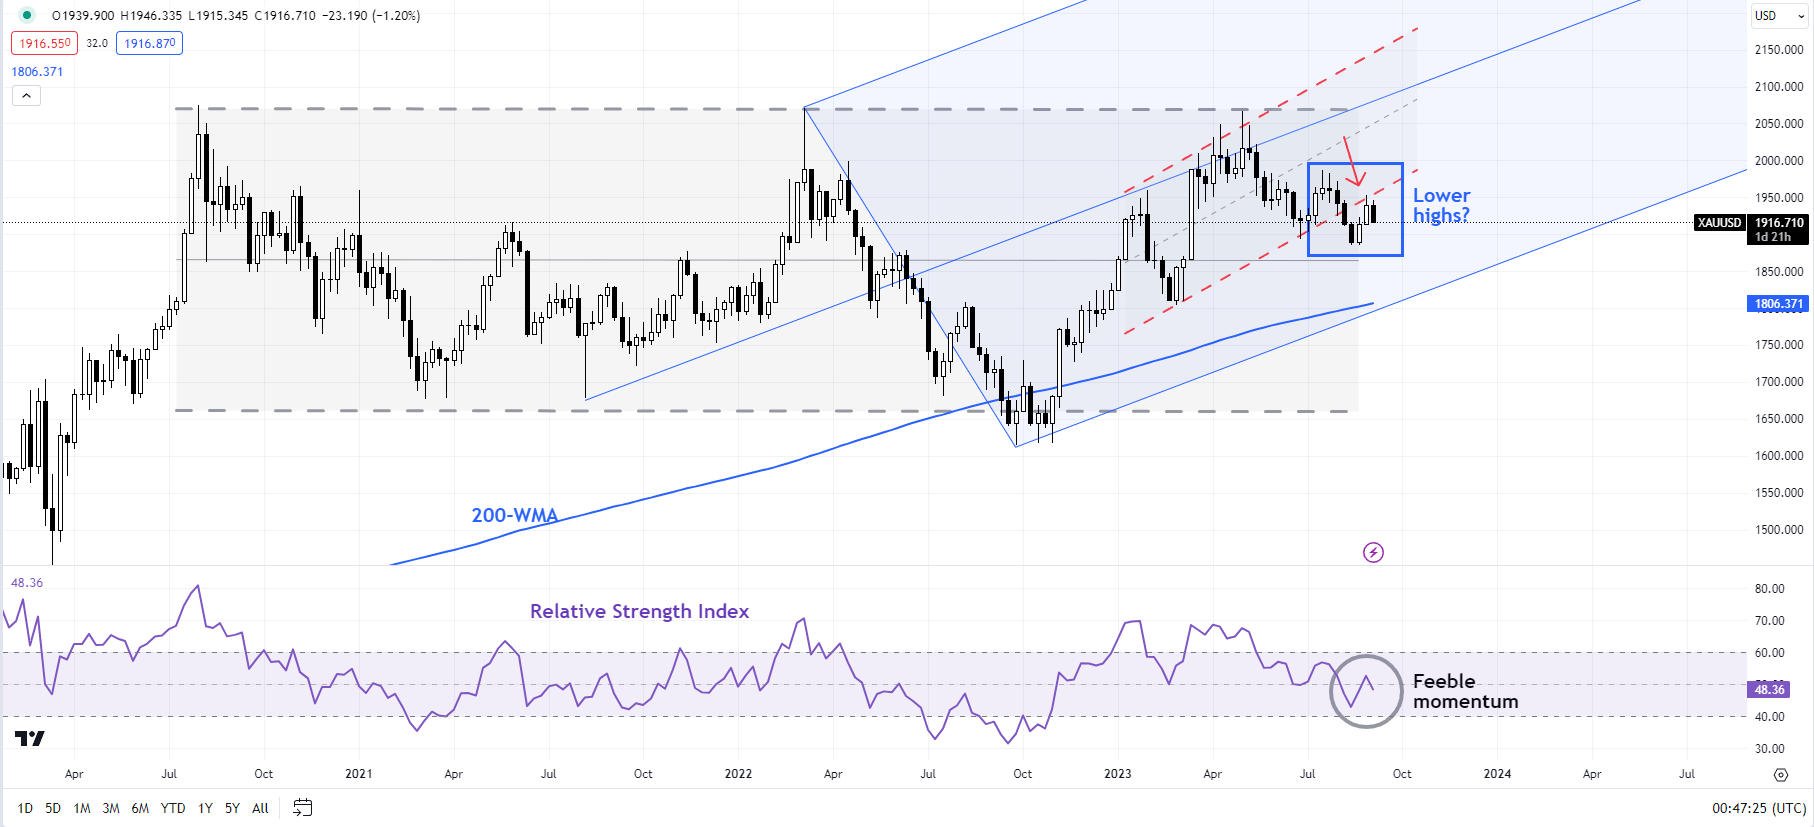
Gold is restarting to feel the heat of rising US real yields following upbeat US data in the past couple of days.

The yellow metal rebounded mid-August from quite strong support on the 200-day moving average and the June low of 1890. See “Gold, Silver Forecast: It’s Now or Never for XAU/USD, XAG/USD,” published August 13. This was associated with a brief reprieve lower in US real yields, also as data released in the second half of August failed to match up with overly optimistic expectations (the US Economic Surprise Index hit a two-year high at the end of July before cooling off).

With the US Federal Reserve unwilling to commit it is done with hiking rates, there is very little incentive for yields to fall meaningfully amid a resilient economy. Fed Governor Christopher Waller and Boston Fed President Susan Collins’s comments reiterated the data dependency with regard to the path of monetary policy. The path of least resistance for yields remains sideways to up.

XAU/USD Daily Chart

image1.png

US real yields continue to hover around multi-month highs hit in August. Rising nominal interest rates coupled with easing price pressures/inflation expectations have pushed up real rates, raising the opportunity cost of holding the zero-yielding yellow metal. See “High Real Yields Starting to Bite Gold? XAU/USD Price Setup Ahead of US CPI,” published August 10.

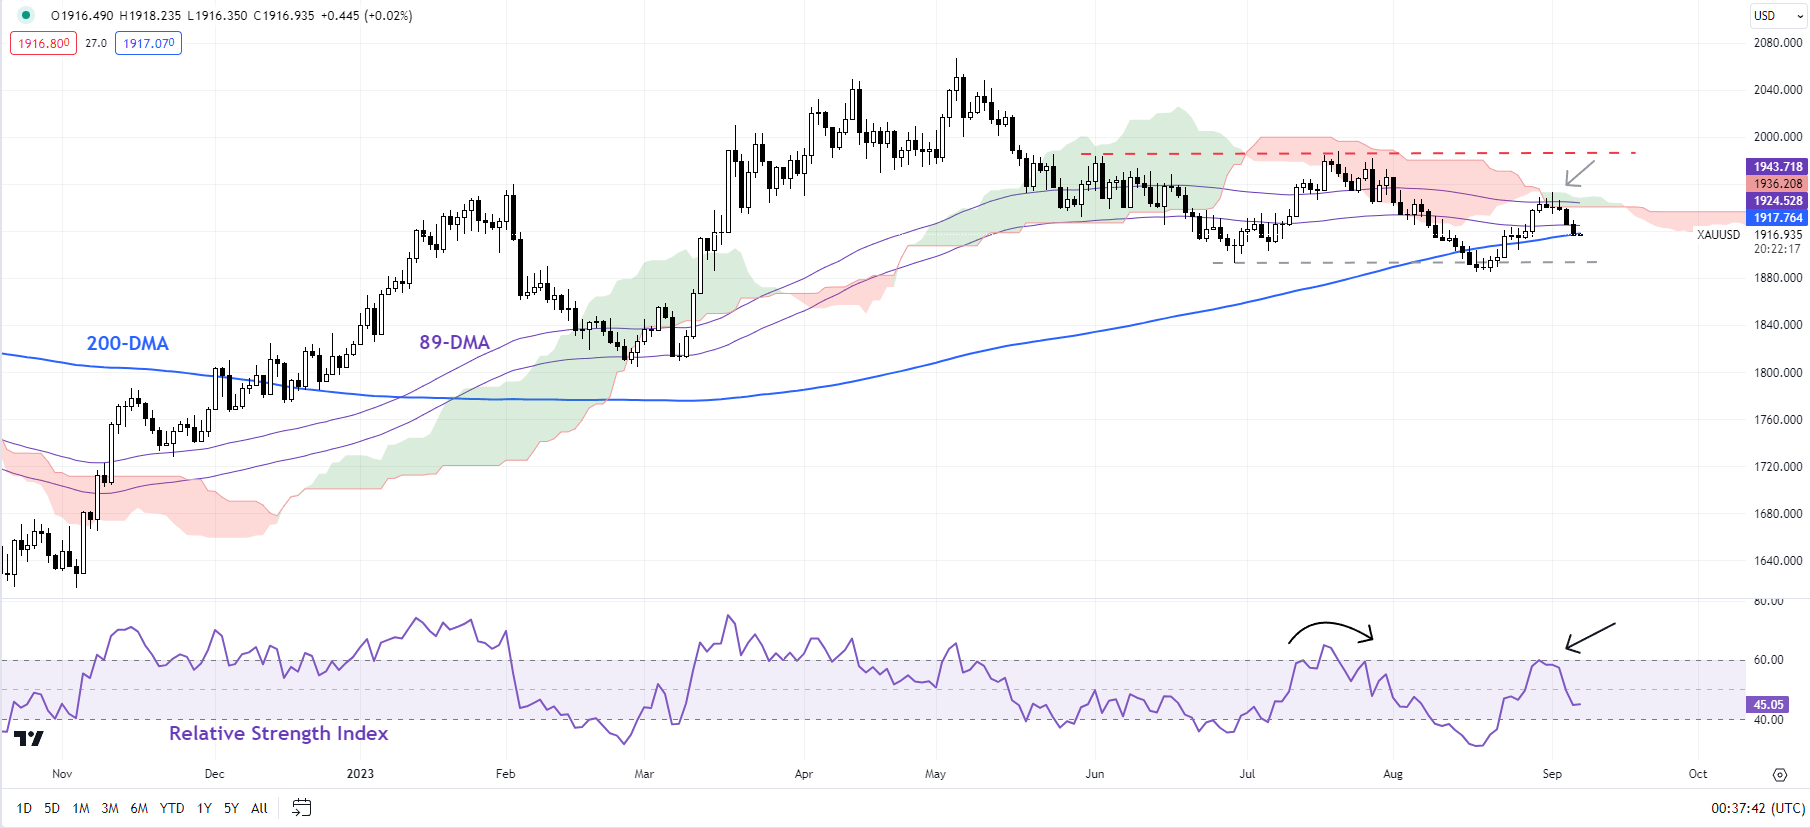
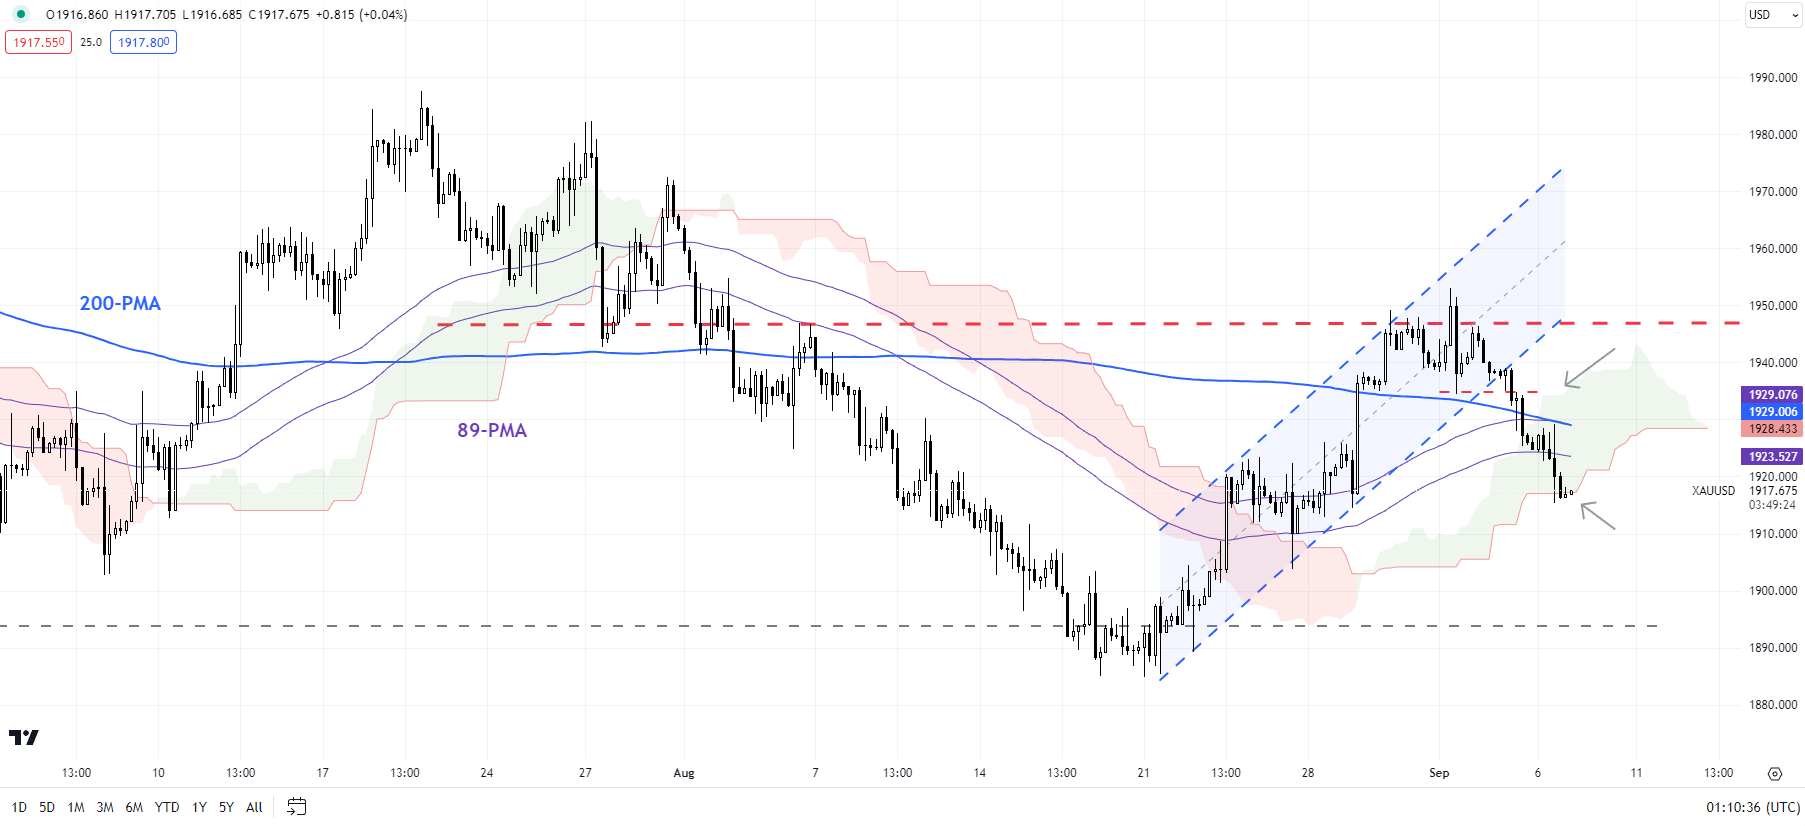
On technical charts, after a brief rebound from strong converged support in late August, gold has retreated from vital resistance on the upper edge of the Ichimoku cloud on the daily charts and the 89-day moving average. The recent turn lower has raised the odds of a lower-highs-lower-lows sequence since May. For this bearish pattern to reverse, the yellow metal would need to, at minimum, rise above last week’s high of 1952. In turn, for a rebound to occur gold needs to hold the crucial support on the lower edge of the Ichimoku cloud on the 240-minute chart that it is now testing.

XAU/USD 240-minute Chart

image2.png

A failure to do so could push gold back toward crucial support on the 200-day moving average and the June/August low of 1885-1890. The importance of this support was highlighted in “Gold, Silver Forecast: It’s Now or Never for XAU/USD, XAG/USD,” published on August 13. As noted previously, any break below could pave the way toward the February low of 1805. Importantly, any break below 1885-1890 would truncate the uptrend that began in 2022.

XAU/USD Weekly Chart

image3.png

Importantly, it would raise the odds that the spectacular multi-month rally was corrective and not the start of a new uptrend – a point highlighted in recent months. See “Gold Could Find It Tough to Crack $2000”,published March 28, and “Gold Weekly Forecast: Is it Time to Turn Cautious on XAU/USD?” published April 16.

Euro Holds Ground Ahead of ECB as US Dollar Flexes. Where to for EUR/USD?

Euro Holds Ground Ahead of ECB as US Dollar Flexes. Where to for EUR/USD?

Euro steadied again going into Thursday’s trading day but remains within a whisker of the 3-month low seen yesterday near 1.0700.

The US Dollar is generally stronger so far today after Treasury yields once again stepped up to loftier levels overnight. The benchmark 10-year note is near 4.30% after having traded at 4.06% a week ago.

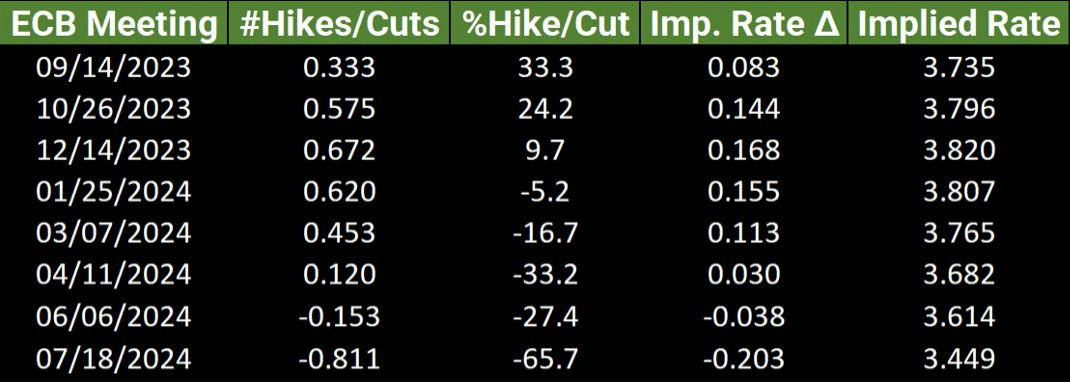
The European Central Bank meets next week, and the market is only subscribing around a 33% probability of a 25 basis-point (bp) hike.

Yesterday, Governing Council member Klaas Knot said that he thought the market was underestimating the chance of a hike. He will be speaking again today alongside several other ECB representatives.

MARKET PRICING OF A 25 BP HIKE BY THE ECB

image1.png

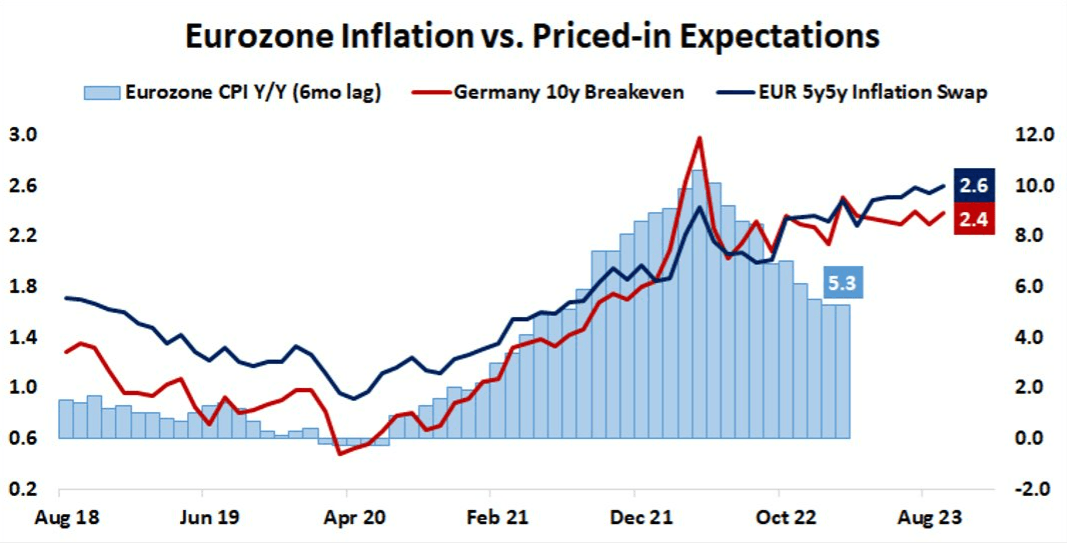
Inflation remains stubbornly high in the Eurozone and market-priced long-term inflation has been inching up of late when looking at the German 10-year breakeven rate and the EUR 5Y/5Y inflation swap.

If the market continues to up the ante on inflation bets, the ECB might need to be more aggressive at some stage.

EU INFLATION AGAINST MARKET-PRICED INFLATION

image2.png

Elsewhere, APAC equities are a sea of red on Thursday and futures are pointing toward a tough cash session for European and North American bourses.

Hong Kong’s Hang Seng Index (HSI) dipped after Chinese trade data increased investor anxiety around the economic outlook there.

China’s trade balance for the month of August missed forecasts, coming in at USD 68.3 billion rather than the 73.9 billion anticipated.

Both exports and imports shrunk significantly, adding to concerns for activity domestically and abroad.

Australia’s trade surplus was also smaller than estimated, printing at AUD 8.04 billion for July, below forecasts of AUD 10 billion. The Aussie continues to languish near 10-month lows under 64 US cents.

For more information on how to trade the news, click on the banner below.

Crude oil has eased slightly today after another stellar rally yesterday on production cuts and depleting stockpiles. Live prices can be found here.

Spot gold is treading water around US$ 1,920 an ounce and volatility on the precious metal is at its lowest level since February 2020 as measured by the GVZ index.

After Eurozone GDP data, the US will see more job numbers hit the wires.

US Indices Hit a Roadblock After Solid Services Print: S&P 500, Nasdaq

US Indices Hit a Roadblock After Solid Services Print: S&P 500, Nasdaq

US indices turned lower on Wednesday after stronger-than-expected services sector data pushed up the odds of a November rate hike, reigniting concerns of higher for longer rates.

Markets are now pricing in about a 44% chance of a November rate hike, up from around 30% at the start of the week, pushing up yields / real yields. The softer data in the second half of August gave the impression that the US economy isn’t resurging. However, this month’s data underscores the outperformance of the world’s largest economy, keeping the upward pressure intact on yields.

As highlighted in a recent update, with real yields rising, valuations well above historical averages, and full-year EPS projections yet to turn materially higher, the bar for equities to outperform some of the other asset classes is now higher. See “US Indices’ Upside Could be Capped: S&P 500, Nasdaq Price Setups,” published August 24, and “US Indices Rally Beginning to Crack? S&P 500, Nasdaq Price Setups,” published August 3.

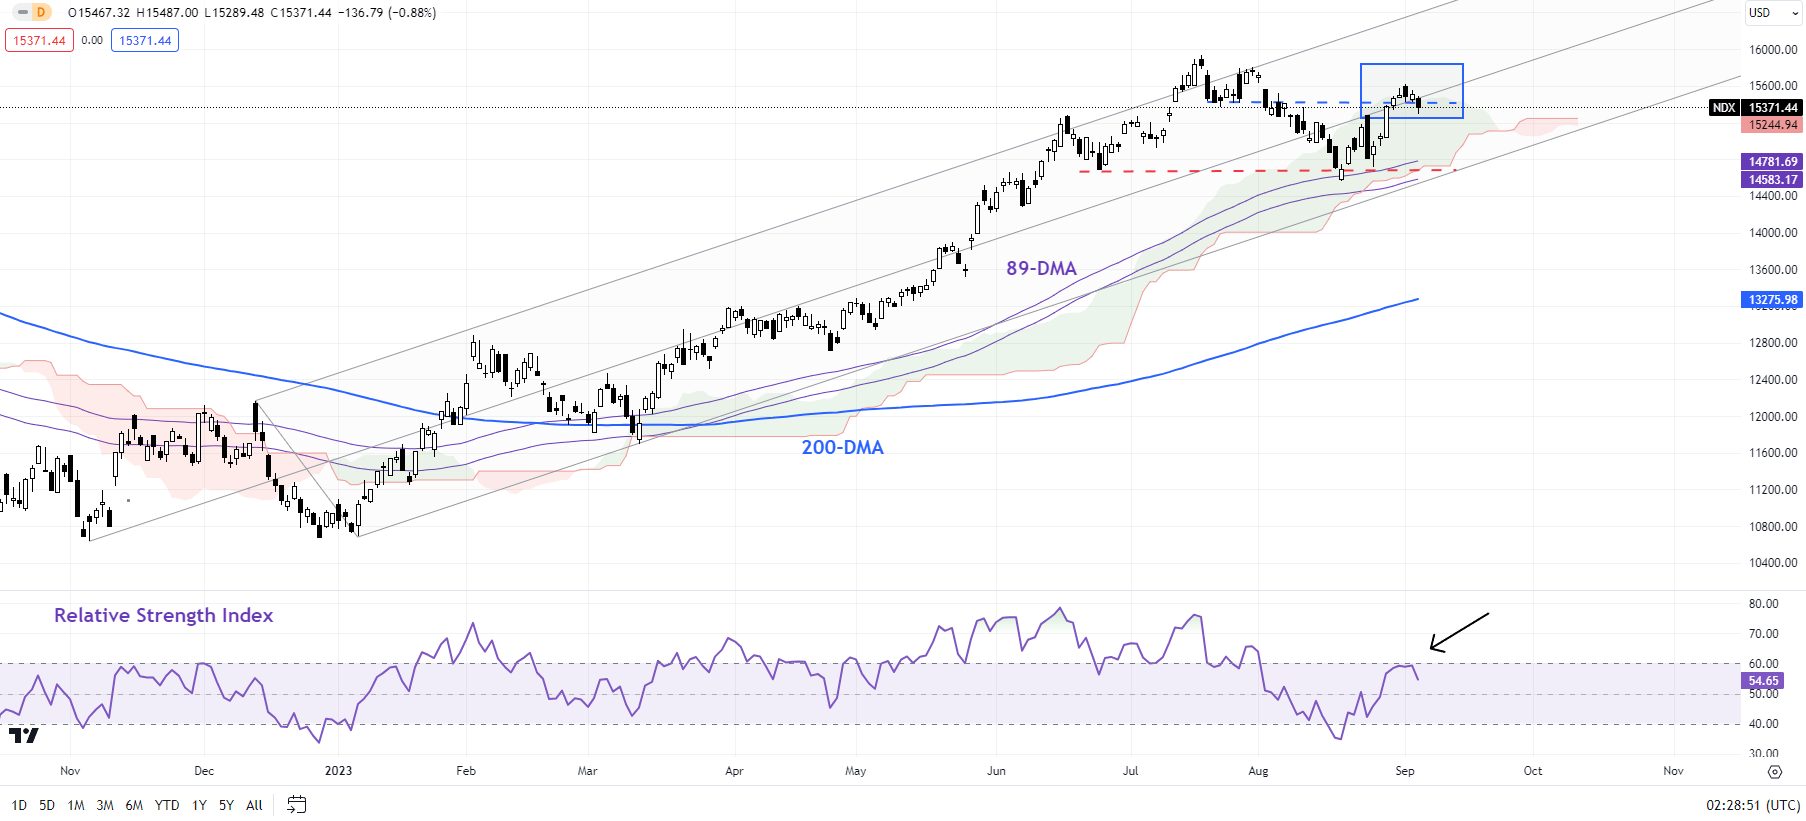
Nasdaq 100 Daily Chart

image1.png

Nasdaq 100: Rally appearing to be running out of fuel

On technical charts, the Nasdaq 100 index has run into stiff resistance: the median line of a pitchfork channel since late 2022, the July 24 low of 15375, and the upper edge of the Ichimoku cloud on the daily charts – a risk highlighted in theprevious update.

The rollover of the 14-day Relative Strength Index rolling from near the 60-level raises the odds that the bounce from late August is corrective. Nasdaq mid-August rebounded from vital cushion area, including the 89-day moving average, the lower edge of the Ichimoku cloud on the daily chart, and the June low of 14700. Any break below immediate support at the late-August high of 15280 would confirm that the upward pressure from August had faded, potentially opening the way toward the August low of 14550.

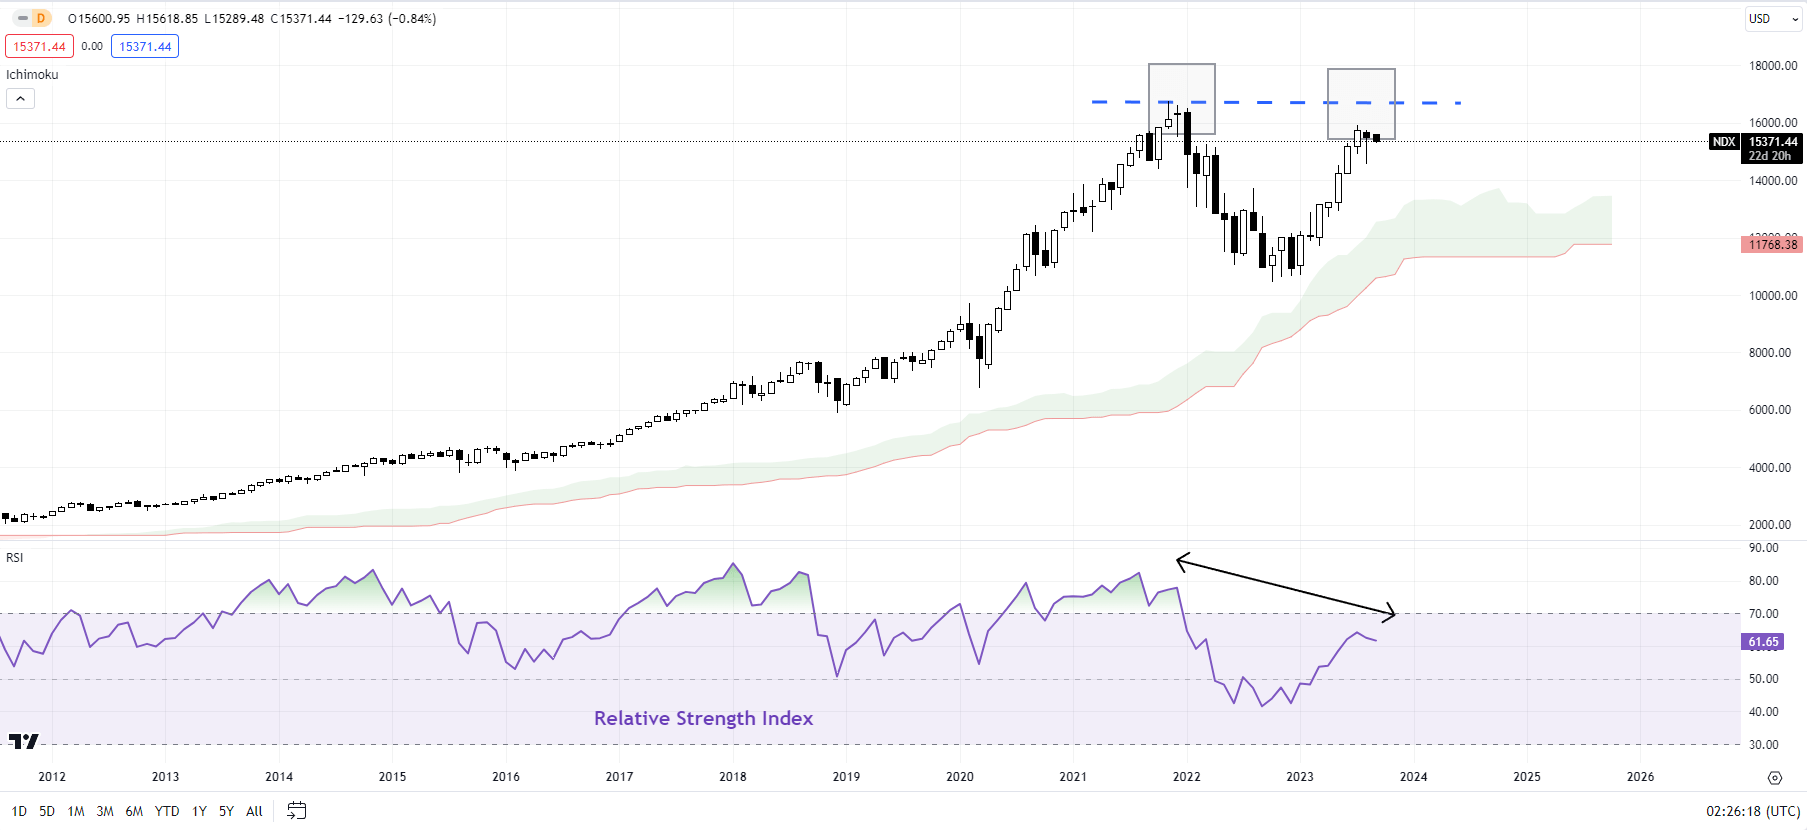
Nasdaq 100 Monthly Chart

image2.png

More broadly, as noted in “S&P 500, Nasdaq 100 Forecast: Overly Optimistic Sentiment Poses a Minor Setback Risk,” published July 23, monthly charts have been feeble compared with the 50% rally since October (see the monthly chart), raising the risk of a gradual weakening pattern in gold in recent months. For more discussion, see “Is Nasdaq Following Gold’s Footsteps? NDX, XAU/USD Price Setups,” published August 14.

S&P 500 240-Minute Chart

image3.png

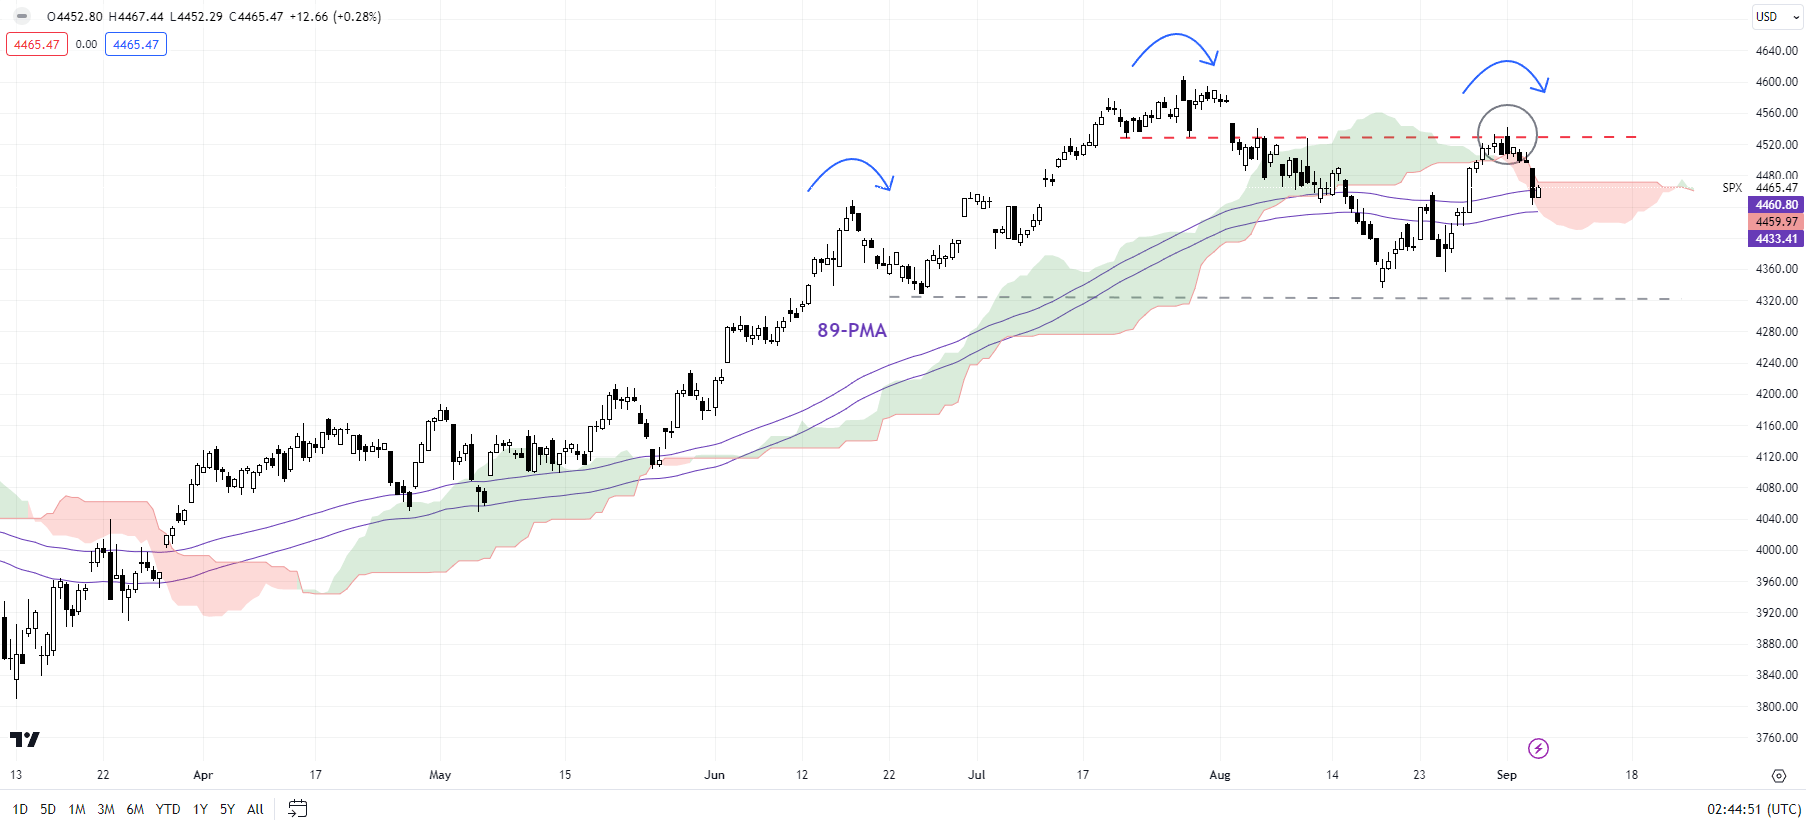
S&P 500: Rally stalls for now

The S&P 500 index has surrendered some of its late-August gains as it ran into a tough ceiling on the upper edge of the Ichimoku cloud on the 240-minute charts, coinciding with the end-July low of 4600. Ashighlighted in the previous update, the index could need to clear past the support-turned-resistance at 4550 for the downside risks to dissipate.

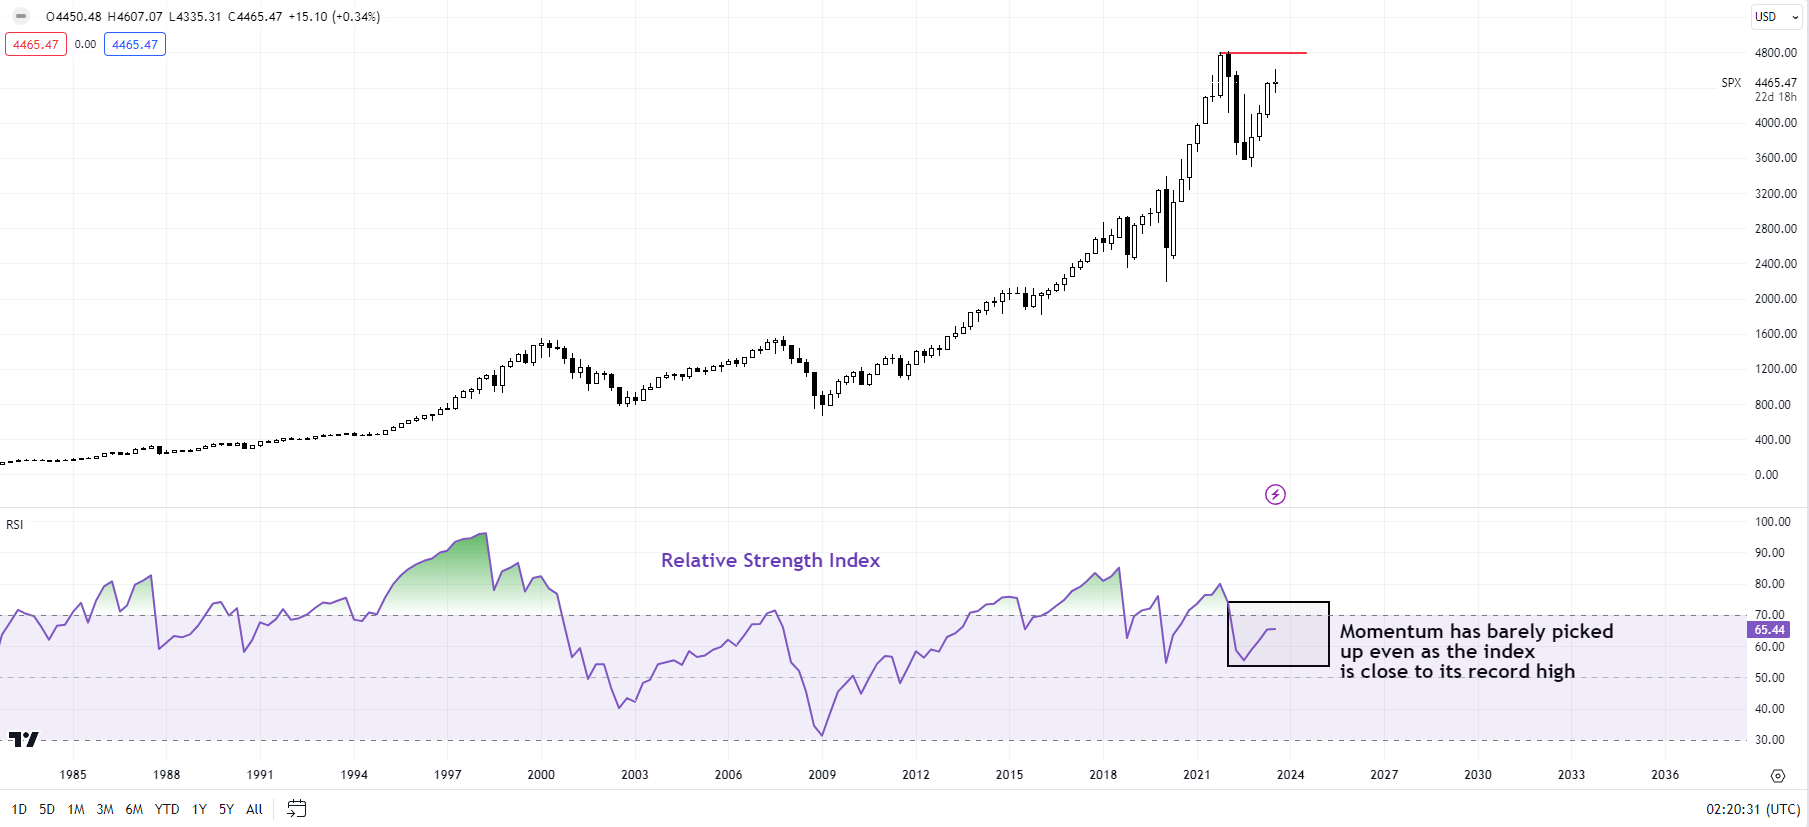
S&P 500 Quarterly Chart

image4.png

The recent retreat raises the risk of a potential lower high – for the first time since the rally began late last year. Any break below the August low of 4335 would disrupt the higher-top-higher-bottom sequence since late 2022, raising the odds that the ten-month-long rally was corrective, and not the start of a new uptrend. The feeble upward momentum on higher timeframe charts reinforces the corrective nature of the rebound. (See the quarterly chart.)