Oil Prices Forecast: OPEC Production Cuts Challenge China’s Demand Dip

Oil Prices Forecast: OPEC Production Cuts Challenge China’s Demand Dip

Oil Prices React to Mixed Market Signals

In recent Asian trading sessions, oil prices experienced a slight upswing. This movement stems from a balance between weak demand cues from China, the globe’s leading importer, and the potential impact of more U.S. rate hikes juxtaposed with possible constraints in oil supply.

China’s Economic Deceleration Impacts Oil Demand

China’s economic health plays a pivotal role in driving global oil demand. However, the world’s second-largest economy has been showing signs of deceleration. Market participants had placed high hopes on various stimulus measures, but the Chinese government’s efforts, such as a smaller-than-anticipated reduction in a key lending benchmark, haven’t met expectations. This lackluster performance casts a shadow over oil demand for the remaining months of this year.

Trading Derivatives carries a high level of risk to your capital and you should only trade with money you can afford to lose. Trading Derivatives may not be suitable for all investors, so please ensure that you fully understand the risks involved, and seek independent advice if necessary. A Product Disclosure Statement (PDS) can be obtained either from this website or on request from our offices and should be considered before entering into a transaction with us. Raw Spread accounts offer spreads from 0.0 pips with a commission charge of USD $3.50 per 100k traded. Standard account offer spreads from 1 pips with no additional commission charges. Spreads on CFD indices start at 0.4 points. The information on this site is not directed at residents in any country or jurisdiction where such distribution or use would be contrary to local law or regulation.

Central Banks’ Meeting Shadows OPEC+

Concurrently, all eyes are on Jackson Hole, Wyoming, as top officials from major global central banks, including the U.S. Federal Reserve, assemble for their annual meet. Investors are treading cautiously, looking for any hints on the future trajectory of interest rates. A higher rate environment, combined with China’s subdued demand, might temporarily eclipse the effects of tightening supply, primarily driven by OPEC+.

OPEC+ Efforts Tighten Oil Supply

On the brighter side for oil markets, supply has been constricting. Saudi Arabia’s initiative to reduce output by 1 million barrels per day from July to September and Russia’s pledge to cut exports by 500,000 bpd in August are prime examples. The collective effort from OPEC+ aims to rein in supply, offering support to prices. Additionally, in the U.S., despite a slight miss in expectations, crude stocks have been dwindling, suggesting a tauter supply landscape.

Short-Term Outlook

In the short-term, while rising interest rates and China’s waning demand present bearish cues, the tightening oil supply could provide a counterbalance. With pivotal events and data releases lined up, including the Energy Information Administration’s weekly report, market participants should brace for potential volatility.

Technical Analysis

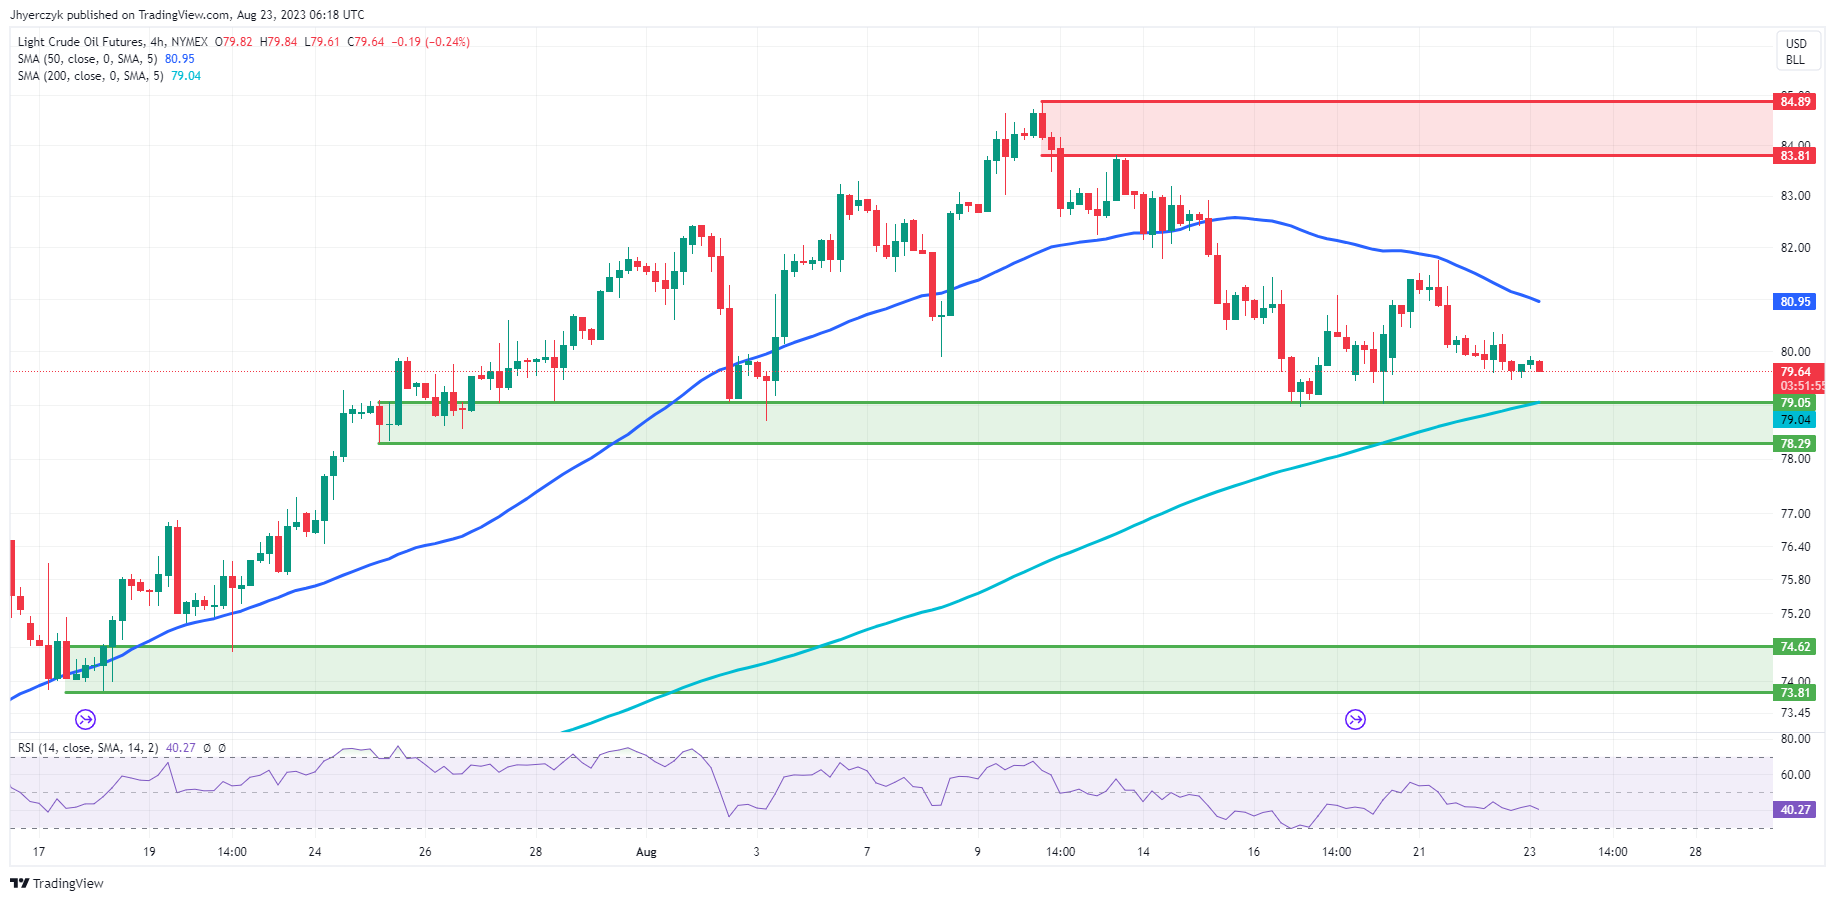
4-Hour Crude OilThe commodity’s price has slightly decreased on the 4-Hour chart, moving from 79.83 to 79.67. This price sits between the 200-4H moving average of 79.04 and the 50-4H moving average of 80.95, indicating a sideways movement or slight bearish momentum. The 14-4H RSI stands at 40.60, suggesting a weaker momentum, although not reaching the oversold territory.

Notably, the current price is hovering just above the main support area, which ranges from 79.05 to 78.29, and remains significantly below the main resistance area, which stretches between 83.81 to 84.89. Considering the moving averages and proximity to the support region, the current market sentiment for crude oil appears to be cautiously bearish.

Dax Index: Navigating Through US and Eurozone PMI Forecasts and Their Impact

Dax Index: Navigating Through US and Eurozone PMI Forecasts and Their Impact

Tuesday Session Overview

The DAX gained 0.66% on Tuesday. Following a 0.19% rise on Monday, the DAX wrapped up the day at 15,706. A bearish end to the session saw the DAX pull back from a session high of 15,799. Another rise in government bond yields weighed on riskier assets.

Monday gains from the US and a bullish Asian session across equity markets on Tuesday delivered an early boost. However, rising government bond yields left the DAX off the session high.

Trading Derivatives carries a high level of risk to your capital and you should only trade with money you can afford to lose. Trading Derivatives may not be suitable for all investors, so please ensure that you fully understand the risks involved, and seek independent advice if necessary. A Product Disclosure Statement (PDS) can be obtained either from this website or on request from our offices and should be considered before entering into a transaction with us. Raw Spread accounts offer spreads from 0.0 pips with a commission charge of USD $3.50 per 100k traded. Standard account offer spreads from 1 pips with no additional commission charges. Spreads on CFD indices start at 0.4 points. The information on this site is not directed at residents in any country or jurisdiction where such distribution or use would be contrary to local law or regulation.

There were no euro area economic indicators to provide direction. However, US housing sector numbers and uncertainty surrounding Fed monetary policy tested buyer appetite.

Investors remain divided on Fed interest rates, with the hawks expecting one final rate hike before the end of the year. However, other investors expect the Fed to wait for the next round of US economic indicators before providing guidance. With investors focused on the Jackson Hole Symposium, uncertainty is influencing.

The S&P 500 and the Dow fell by 0.28% and 0.51%, respectively, while the NASDAQ rose by 0.06%. Bank stocks struggled on the news of S&P Global downgrading US banks exposed to the real estate sector. Falling oil and natural gas prices weighed on energy stocks.

Daily Chart sends mixed price signals.

Tuesday’s Market Movers

The auto sector had another mixed session on Tuesday. BMW and Mercedes-Benz Group rose by 0.46% and 0.37%, respectively. Porsche gained 0.18%, while Volkswagen ended the day up 0.02%. The gains were modest, with recessionary fears weighing on the demand outlook.

Continental AG bucked the trend, falling by 0.17% after rallying by 5.87% on Monday as investors reacted to plans to sell the ContiTech car unit. Continental is undergoing reorganization to boost profitability.

Bank stocks avoided losses. Commerzbank and Deutsche Bank rose by 0.05% and 0.26%, respectively.

Infineon was among the best performers, gaining 2.71%. Tech stocks found support after the NASDAQ rally on Monday.

The Day Ahead for the DAX

Prelim private sector PMI figures for France, Germany, and the Eurozone will impact market risk sentiment.

The Germany economy stumbled into the third quarter. Weak economic indicators raised the chances of a sustained recession. However, the PMI numbers will influence investor sentiment and the ECB. A deeper contraction across the German manufacturing sector and weaker service sector activity will impact the DAX.

Economists forecast the German manufacturing PMI to fall from 38.8 to 38.7. Significantly, economists expect the German services PMI to fall from 52.3 to 51.5. A fall below 51 would likely spook investors.

While the German PMIs will have more impact, we expect the DAX to react to the Eurozone PMIs. Economists forecast the Eurozone Services PMI to fall from 50.9 to 50.5. A fall to sub-50.0 would signal a contraction and force the ECB to reconsider another interest rate hike. The manufacturing sector will likely continue to contract in August.

The US services PMI will test investor sentiment toward the US economy and the Fed. An unexpected contraction in the US services sector would reignite fears of a US recession. Economists forecast the August services PMI to fall from 52.3 to 52.2. A rise in the services PMI would increase the chance of a Fed rate hike.

DAX Technical Indicators

After two positive sessions, the DAX remained above the 15,600 – 15,525 support band. However, DAX sat below the 50-day and 200-day EMAs, sending bearish near and longer-term price signals.

Looking at the 14-4H RSI, the RSI sits at 46.45, reflecting bearish sentiment, with selling pressure overweighing buying pressure. Significantly, the RSI aligns with the EMAs signaling a fall through the 15,600 – 15,525 support band to give the bears a run at sub-15,500.

Price action hinges on the euro area and US prelim private sector PMIs.

DAX 4-hourly chart sends bearish price signals.
EUR/USD Prices Forecast: Lower on German Business Plunge, Fed Policy Fears

EUR/USD Prices Forecast: Lower on German Business Plunge, Fed Policy Fears

Euro Declines on Weak German Business Activity Amidst U.S. Dollar Resilience

The Euro tumbled against the U.S. Dollar on Wednesday, pressured by deteriorating German business activity, the worst since May 2020, even as the U.S. Treasury yields dipped. Market anticipation for insights on the Federal Reserve’s monetary stance is building up, with particular focus on Chair Jerome Powell’s forthcoming speech at the Jackson Hole symposium.

German Business Environment Worsens:

Germany’s business activity plunged at its quickest pace in over three years this August. The HCOB German Flash Composite PMI, an integral measure of manufacturing and service sectors making up the majority of Germany’s economic activity, dropped to 44.7 from July’s 48.5, surprising analysts. This marks the second successive month the indicator has remained beneath the growth level of 50. This decline underscores a deepening manufacturing downturn and a simultaneous contraction in services. Hamburg Commercial Bank’s chief economist, Cyrus de la Rubia, noted the evaporating hope of the service sector saving the German economy, indicating a looming dual-sector recession.

Trading Derivatives carries a high level of risk to your capital and you should only trade with money you can afford to lose. Trading Derivatives may not be suitable for all investors, so please ensure that you fully understand the risks involved, and seek independent advice if necessary. A Product Disclosure Statement (PDS) can be obtained either from this website or on request from our offices and should be considered before entering into a transaction with us. Raw Spread accounts offer spreads from 0.0 pips with a commission charge of USD $3.50 per 100k traded. Standard account offer spreads from 1 pips with no additional commission charges. Spreads on CFD indices start at 0.4 points. The information on this site is not directed at residents in any country or jurisdiction where such distribution or use would be contrary to local law or regulation.

Inflationary Concerns

While the manufacturing PMI showed a slight improvement, the service sector reported its first contraction in eight months. A pervasive gloomy sentiment persists among businesses, influenced by rising interest rates, mounting customer uncertainty, and inflation. In fact, service firms are notably aggressive in raising their prices, intensifying inflationary pressures.

U.S. Monetary Policy

All eyes are on the Jackson Hole event and particularly Powell’s address to understand the Fed’s future monetary policy direction. While recent robust U.S. economic figures have mitigated recession concerns, persistently high inflation has markets on edge. Indications are that the central bank may maintain higher interest rates for an extended period. The probability of the Fed maintaining its current rate at its next policy gathering is high, but anticipations of another hike this year are also surging.

Short-Term Forecast

With the Euro showing vulnerability due to German economic contraction and the markets keenly awaiting Fed signals, near-term currency movements may hinge on perceived U.S. monetary policy shifts, making the trading environment bearish for the Euro.

Technical Analysis

4-Hour EUR/USDThe EUR/USD currently trades at 1.0829, a drop from the previous 4-hour close at 1.0861. The pair is below both the 200-4H moving average (1.1001) and the 50-4H moving average (1.0900), indicating a bearish trend. Furthermore, the 14-4H RSI stands at 33.81, suggesting that the market is approaching an oversold territory but still reflects weaker momentum.

While the current price resides below the main resistance area (1.1042 to 1.1065), it’s precariously close to the main support zone (1.0844 to 1.0834). In light of these factors, the EUR/USD market sentiment appears bearish on the 4-hour timeframe.

Silver Prices Forecast: XAG/USD Spot Strengthens Despite Hawkish Fed Sentiments

Silver Prices Forecast: XAG/USD Spot Strengthens Despite Hawkish Fed Sentiments

XAG/USD Buoyed by Yield Dip

Silver prices, buoyed by a declining U.S. dollar index and a halt in the U.S. Treasury yield’s rally, are extending their gains, rapidly approaching near a key resistance level at $23.85. This rise contrasts with the precious metal’s gold counterpart, hinting at divergent market sentiments.

Yield Dynamics & Interest Rates

Treasury yields have provided some respite to investors after surging to their highest since November 2007. Despite this, the robust U.S. economy coupled with lasting inflationary pressures might compel the Federal Reserve to uphold higher interest rates longer than anticipated. Fed Chairman Jerome Powell’s upcoming speech at the Jackson Hole Symposium is the next focal point for insights into the bank’s rate trajectory and its stance on the 2% inflation benchmark.

Trading Derivatives carries a high level of risk to your capital and you should only trade with money you can afford to lose. Trading Derivatives may not be suitable for all investors, so please ensure that you fully understand the risks involved, and seek independent advice if necessary. A Product Disclosure Statement (PDS) can be obtained either from this website or on request from our offices and should be considered before entering into a transaction with us. Raw Spread accounts offer spreads from 0.0 pips with a commission charge of USD $3.50 per 100k traded. Standard account offer spreads from 1 pips with no additional commission charges. Spreads on CFD indices start at 0.4 points. The information on this site is not directed at residents in any country or jurisdiction where such distribution or use would be contrary to local law or regulation.

The Hawkish Fed Perspective

Richmond Fed president, Thomas Barkin, remains steadfast in the need for the Fed to uphold the 2% inflation target, emphasizing its credibility. Barkin’s stance reaffirms that the bank’s commitment to this target is unwavering. Furthermore, the U.S. economy’s potential resurgence, underpinned by robust indicators, suggests the Federal Reserve might sustain elevated rates for a more extended period.

Market Watch & Precious Metals

Silver’s uptick this week contrasts with gold’s lukewarm performance. The latter’s demand seems to be ebbing, as evidenced by the recent decline in holdings by the renowned SPDR Gold Trust ETF. However, the allure for silver, represented as XAU/USD, remains undiminished, leading the rally among precious metals.

Short-Term Forecast:  Modestly Bullish

Despite the oscillating market dynamics influenced by interest rates and inflation targets, silver’s market sentiment is cautiously optimistic. Current indicators suggest a modestly bullish trajectory for the metal in the near term.

Technical Analysis

4-Hour Silver (XAG/USD)The current 4-hour price of Silver (XAG/USD) stands at 23.68, a slight increase from its previous close at 23.59. This suggests a mild upward momentum. Regarding the moving averages, the commodity’s price is hovering just below the 200-4H moving average of 23.75, indicating resistance at this level. However, it has surpassed the 50-4H moving average of 22.83, signaling bullish momentum. The 14-4H RSI is at 76.60, which denotes an overbought market condition. This could hint at a potential pullback.

Finally, while the price is nearing the main resistance area between 23.60 to 23.85, it’s comfortably above the main support area of 22.70 to 22.28. Taking all these factors into account, the current market sentiment for Silver is cautiously bullish, but with the RSI indicating overbought conditions, some retracement might be on the horizon.

Nonetheless, traders should be prepared for a potential breakout above the 200-4H moving average of 23.75.

August Reveals German PMI Slump: Inflation Takes a Toll

August Reveals German PMI Slump: Inflation Takes a Toll

German Business Activity Dips Amid Rising Inflationary Pressures

August witnessed a significant slump in German business activity, the largest in over three years. Both manufacturing and services faced challenges, as revealed by the recent HCOB ‘flash’ PMI® survey. With high inflation, rising interest rates, and customer uncertainty looming large, German industries grapple with unfavorable conditions.

Manufacturing and Services Decline

The HCOB Flash Germany Composite PMI Output Index highlighted a troubling trend, as it sank to 44.7 from July’s 48.5, emphasizing the deepening contraction. Manufacturing, a cornerstone of the German economy, experienced its fourth consecutive monthly drop, with the decline rate reaching a three-year high at 39.7. Services didn’t fare much better. After eight months of stability, the sector witnessed its business activity drop significantly to an index of 47.3.

Challenges in Orders and Employment

August saw a recurring theme: declining new business inflows across the private sector. The plummeting manufacturing orders stood out, with client destocking and investment hesitancy causing the most significant demand decline since May 2020. The service sector didn’t escape unscathed, with new business falling rapidly due to hesitant clients and a squeeze on budgets. As backlogs of work reduced, manufacturing firms became reluctant to hire, resulting in a decrease in workforce numbers. Services sector job growth almost halted, maintaining the employment status quo for the month.

Price Inflation and Its Impacts

August observed a spike in input cost and output charge inflation, primarily driven by rising fuel prices. While manufacturing purchase prices experienced a drop, service firms faced substantial operational cost hikes, influenced by increased fuel costs and wage pressures. The disparity in output price inflation rates between sectors was evident as service charges rose sharply, contrasting with a continuous drop in manufacturing.

Short-Term Outlook

The downturn in German business activity, combined with escalating inflationary pressures, paints a bearish picture. As Dr. Cyrus de la Rubia from Hamburg Commercial Bank points out, there’s an onset of stagflation in the services economy. The silver lining, however, is that the declining trend in manufacturing might be nearing its end, hinting at a potential economic turnaround. Still, with inflation difficult to control in Europe’s largest economy, challenges await the ECB.

Gold Prices Forecast: XAU/USD Spot Value Navigates Uncertain Fed Landscape

Gold Prices Forecast: XAU/USD Spot Value Navigates Uncertain Fed Landscape

XAU/USD Stabilizes Near $1,900 Amid U.S. Dollar and Yield Retreat

Gold prices found traction on Wednesday, steadying near the significant $1,900 mark. The slide in the U.S. dollar index from two-month peaks, coupled with a pause in the U.S. Treasury yield’s rally, which recently touched a 16-year zenith, offered a brief breather to the non-interest-bearing gold.

Jackson Hole Symposium Awaits Powell

Central to this week’s financial watchlist is the Jackson Hole Symposium in Wyoming. Market watchers are eagerly anticipating Federal Reserve Chair Jerome Powell’s speech on Friday, seeking clarity on the future trajectory of interest rates. Insights into the Fed’s perspective on the 2% inflation benchmark and its viability against ongoing high core inflation will be of particular interest. A tilt towards a revised target might suggest rates stabilizing at current levels.

Trading Derivatives carries a high level of risk to your capital and you should only trade with money you can afford to lose. Trading Derivatives may not be suitable for all investors, so please ensure that you fully understand the risks involved, and seek independent advice if necessary. A Product Disclosure Statement (PDS) can be obtained either from this website or on request from our offices and should be considered before entering into a transaction with us. Raw Spread accounts offer spreads from 0.0 pips with a commission charge of USD $3.50 per 100k traded. Standard account offer spreads from 1 pips with no additional commission charges. Spreads on CFD indices start at 0.4 points. The information on this site is not directed at residents in any country or jurisdiction where such distribution or use would be contrary to local law or regulation.

Barkin Hints at Fed Openness

On Tuesday, Richmond Fed President Thomas Barkin hinted that the Fed should remain open-minded, considering the potential of the U.S. economy picking up pace rather than slowing, a situation that could impact the inflation battle strategy. Such sentiments are further strengthened by robust U.S. economic indicators that suggest the likelihood of the Fed maintaining elevated rates for an extended period.

Gold’s Attraction Dips Among Investors

However, the allure of gold seems to be waning among investors. This is evident in the decline of holdings in bullion-backed exchange-traded funds (ETF). Specifically, SPDR Gold Trust, the globe’s premier gold-backed ETF, reported a 0.5% dip in holdings on Tuesday, a slump to levels last seen in mid-January 2020.

Short-Term Outlook:  Cautiously Bearish

With shifting dynamics in interest rates, inflation targets, and robust economic data, gold’s appeal faces challenges. The immediate trajectory remains cautiously bearish.

Technical Analysis

4-Hour Gold XAU/USDThe current 4-hour price of XAU/USD is marginally above the previous 4-hour close, showing a slight upward movement. This price is also just above the 50-4H moving average of 1900.51, suggesting a potential short-term bullish momentum. However, it remains well below the 200-4H moving average of 1936.82, indicating a bearish longer-term trend. The 14-4H RSI stands at 60.13, revealing stronger momentum, being above the neutral 50 mark but below the overbought threshold.

The current price is slightly above the main support area (1893.07 to 1885.79) and considerably below the main resistance area (1946.99 to 1954.86). In conclusion, the market exhibits a short-term bullish sentiment within a longer-term bearish context.

Crude Oil Prices Ready to Extend Lower? Bearish Head & Shoulders in Focus

Crude Oil Prices Ready to Extend Lower? Bearish Head & Shoulders in Focus

Daily Chart

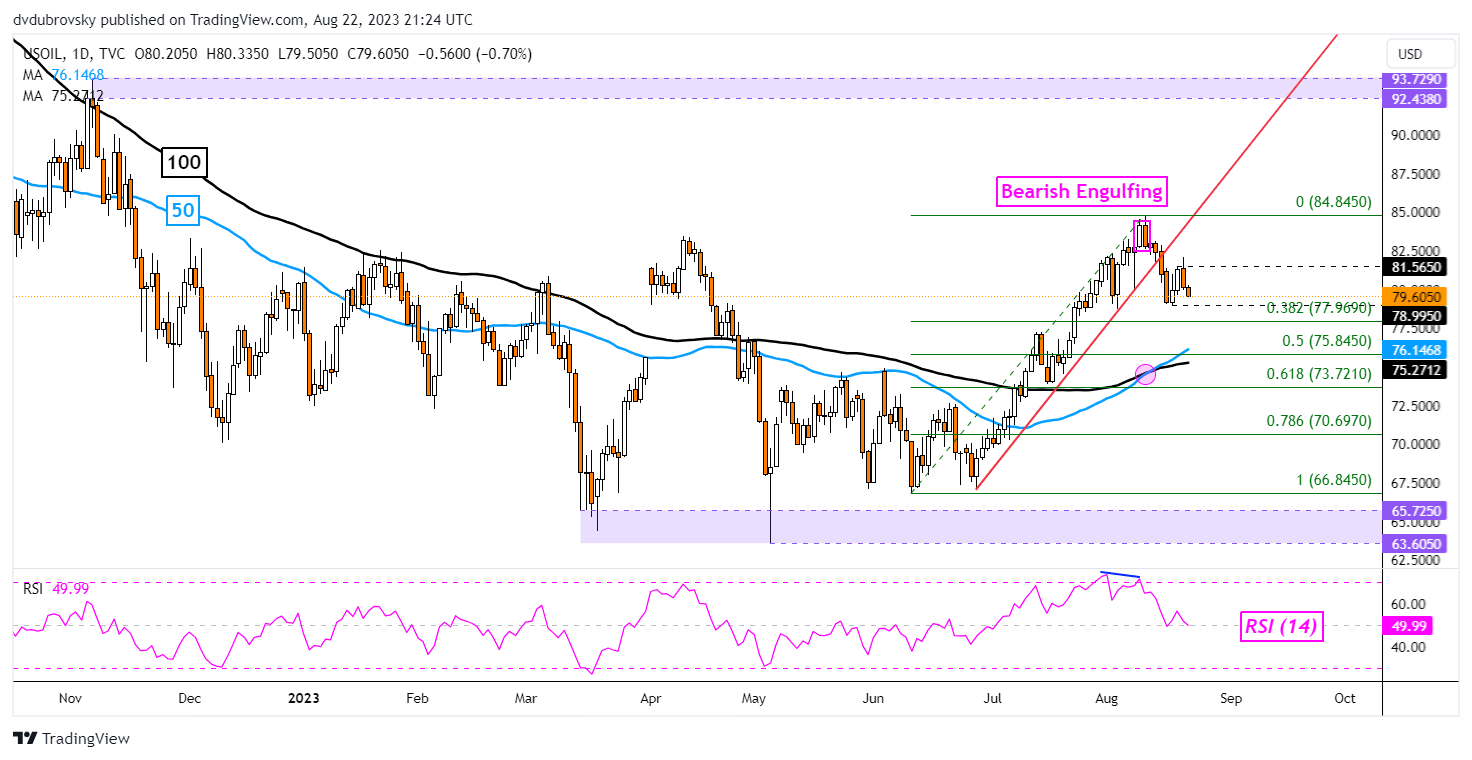
WTI crude oil prices may be reading to extend lower following recent technical developments, especially on the 4-hour chart. For now, let us focus on the daily setting. Oil is currently on course for a second consecutive weekly loss, which has been fairly unusual for WTI given price action since May. Is this a sign of technical exhaustion?

In recent days, WTI left behind new support around 78.99 after confirming a breakout under the rising trendline from June. This also followed the emergence of a Bearish Engulfing candlestick pattern. Meanwhile, resistance was established around 81.56. Below current price action, a bullish Golden Cross emerged between the 50- and 100-day Moving Averages (MAs).

So, while the near-term technical landscape is appearing bearish, the broader upside bias remains focused higher. But, there are brewing signs of potentially more bearish price action to come.

Daily Chart

4-Hour Chart

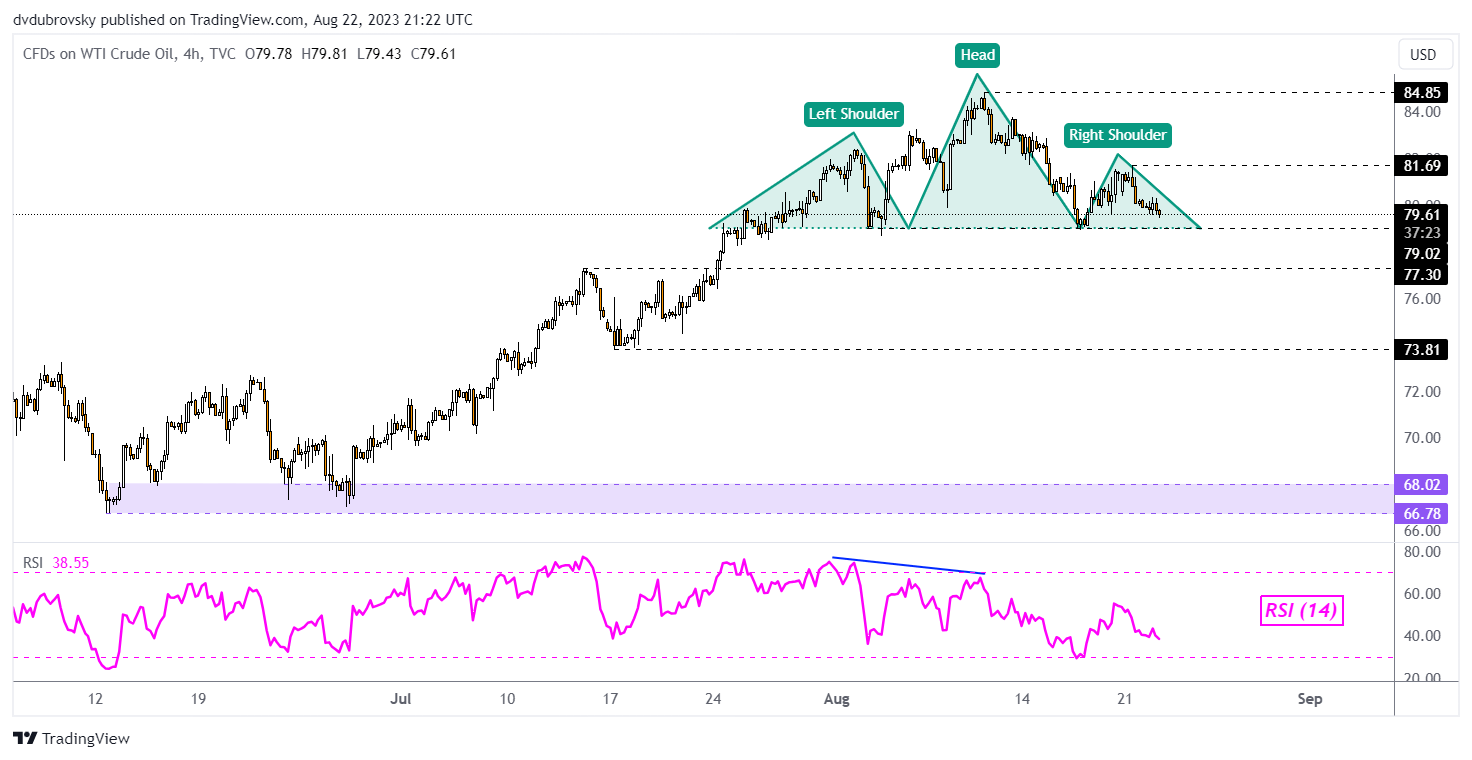
Using the 4-hour setting below, we can see the outlines of a Bearish Head & Shoulders chart formation taking shape. Recently, the peak of the right shoulder was established around 81.69. The neckline seems to be around 79.02.

Now, prices are sitting just above the bearish chart formation. Confirming a breakout lower could open the door to extending lower. That would place the focus on the 77.30 inflection point before the July 17th low of 73.81 comes into focus.

Otherwise, pushing back above the right shoulder may open the door to revisiting the August 10th high of 84.85.

4-Hour Chart

Gold Price Steadies Despite Treasury Yields and US Real Yields Rising. Lower XAU/USD?

Gold Price Steadies Despite Treasury Yields and US Real Yields Rising. Lower XAU/USD?

The gold price is oscillating around US$ 1,900 in the spot market going into Wednesday’s trading session as markets lie in wait for the Federal Reserve’s Jackson Hole economic symposium to get underway on Thursday.

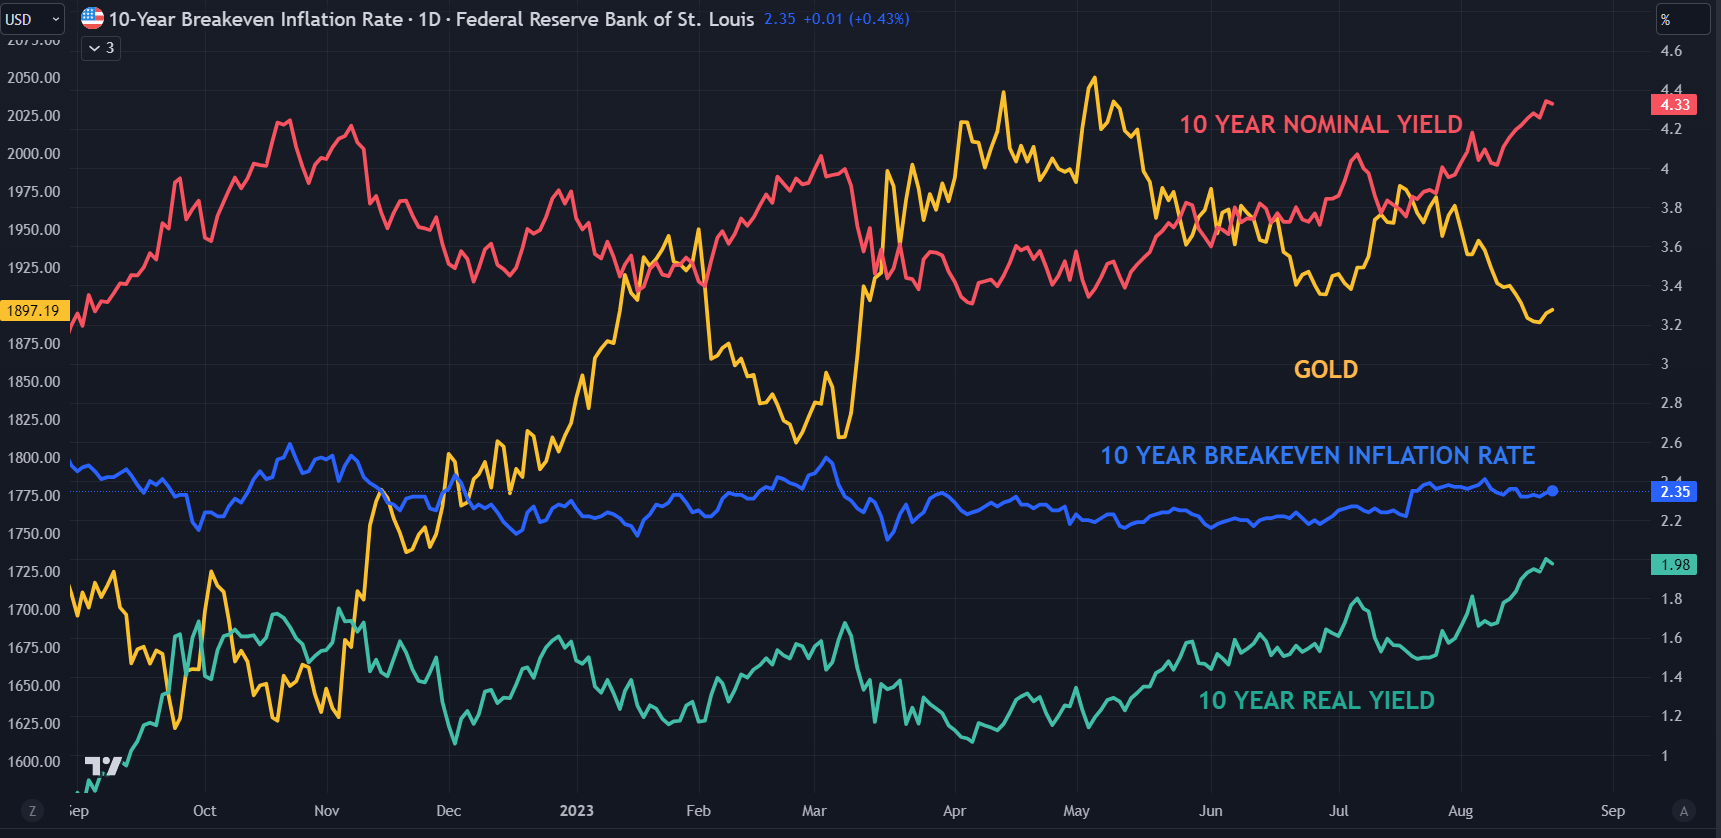
The precious metal has held up reasonably well considering the recent surge in Treasury yields. Yesterday, the benchmark 10-year note traded at its highest yield since 2007, eclipsing 4.36% after dipping to 3.57% in June.

Perhaps of more concern for gold bulls is the uptick in US real yields. The real yield is the nominal yield less the market-priced inflation rate derived from Treasury inflation-protected securities (TIPS) for the same tenor. This inflation rate is known as the breakeven inflation rate.

The breakeven rate has been relatively stable over the past month, and this has allowed the real yield to climb. This has potentially undermined the gold price as it does not offer investors and traders a return. In fact, there is a cost of carry for holding the yellow metal.

This brings the focus on nominal Treasury into focus and the outcome from Jackson Hole might be crucial for the gold price going forward.

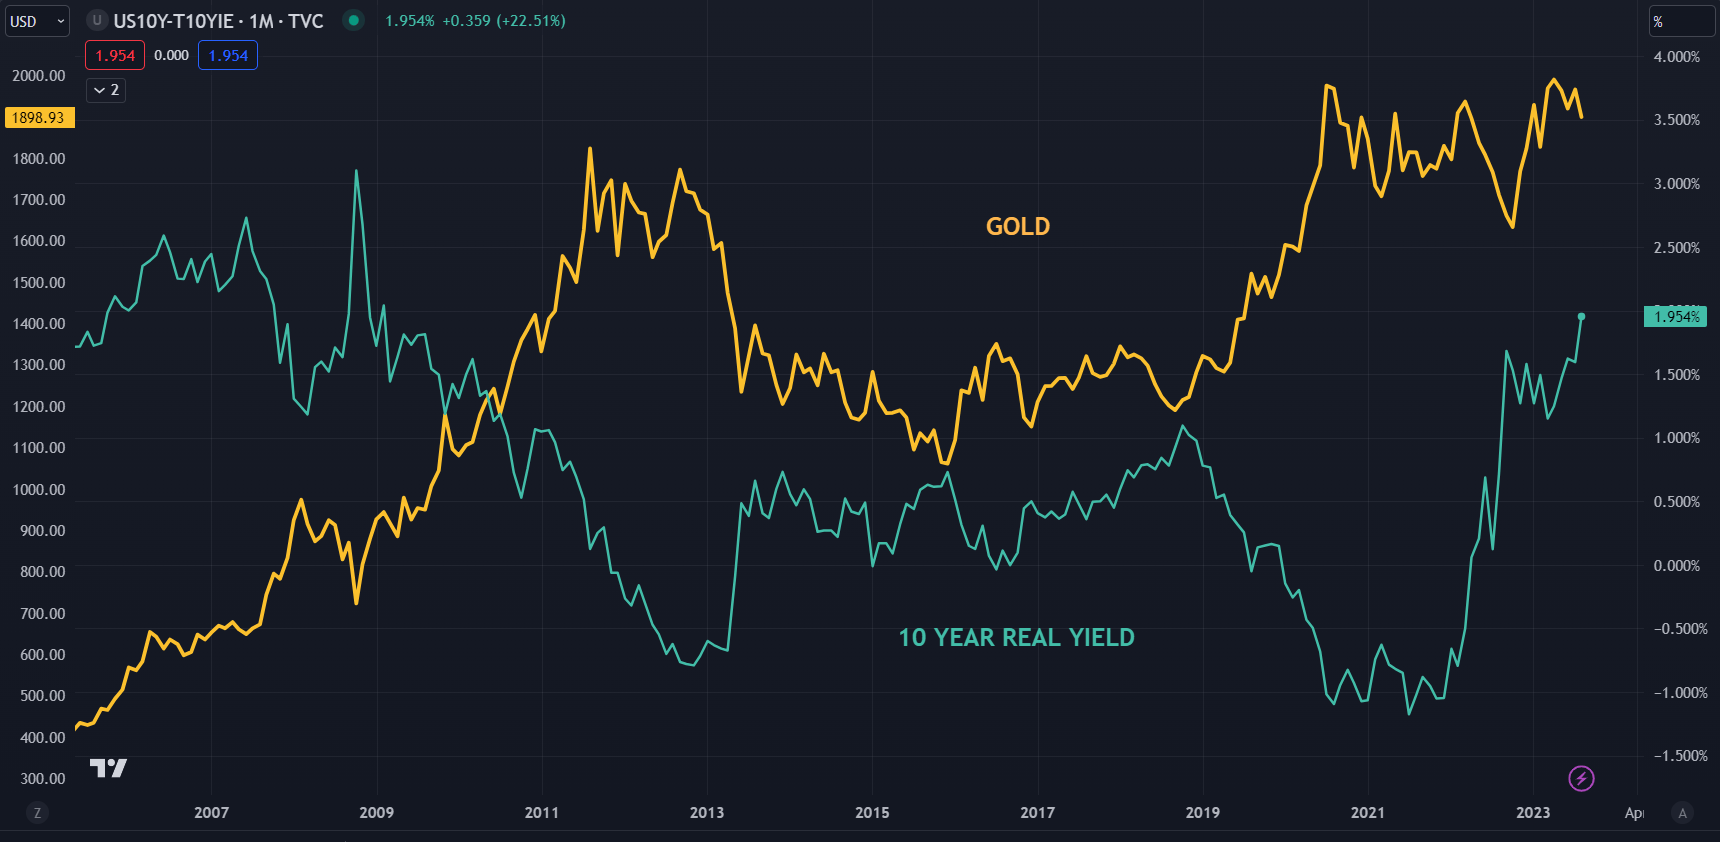
The US 10-year real yield traded above 2% on Tuesday, a level not seen since July 2009 when the gold price was around US$ 925.

The subsequent collapse in the real through to 2013, saw it go negative to almost -1%.

It was while that move lower was happening in the US real yields that gold roared to it peak of US$ 1,920 in 2011. If real yields continue to blitz higher, the gold price may come under pressure. See the second chart below.

Looking ahead for this week, while there be many Fed speakers will be crossing the wires once the symposium gets underway on Thursday. However, the markets are likely to be more finely tuned to Fed Chair Jerome Powell’s speech on Friday.

{{GUIDE|HOW_TO_TRADE_}}

SPOT GOLD AGAINST NOMINAL US 10-YEAR TREASURY YIELD, US 10-YEAR BREAKEVEN INFLATION AND US 10-YEAR REAL YIELD

image1.png

LONG-TERM – SPOT GOLD AGAINST US 10-YEAR REAL YIELD

image2.png

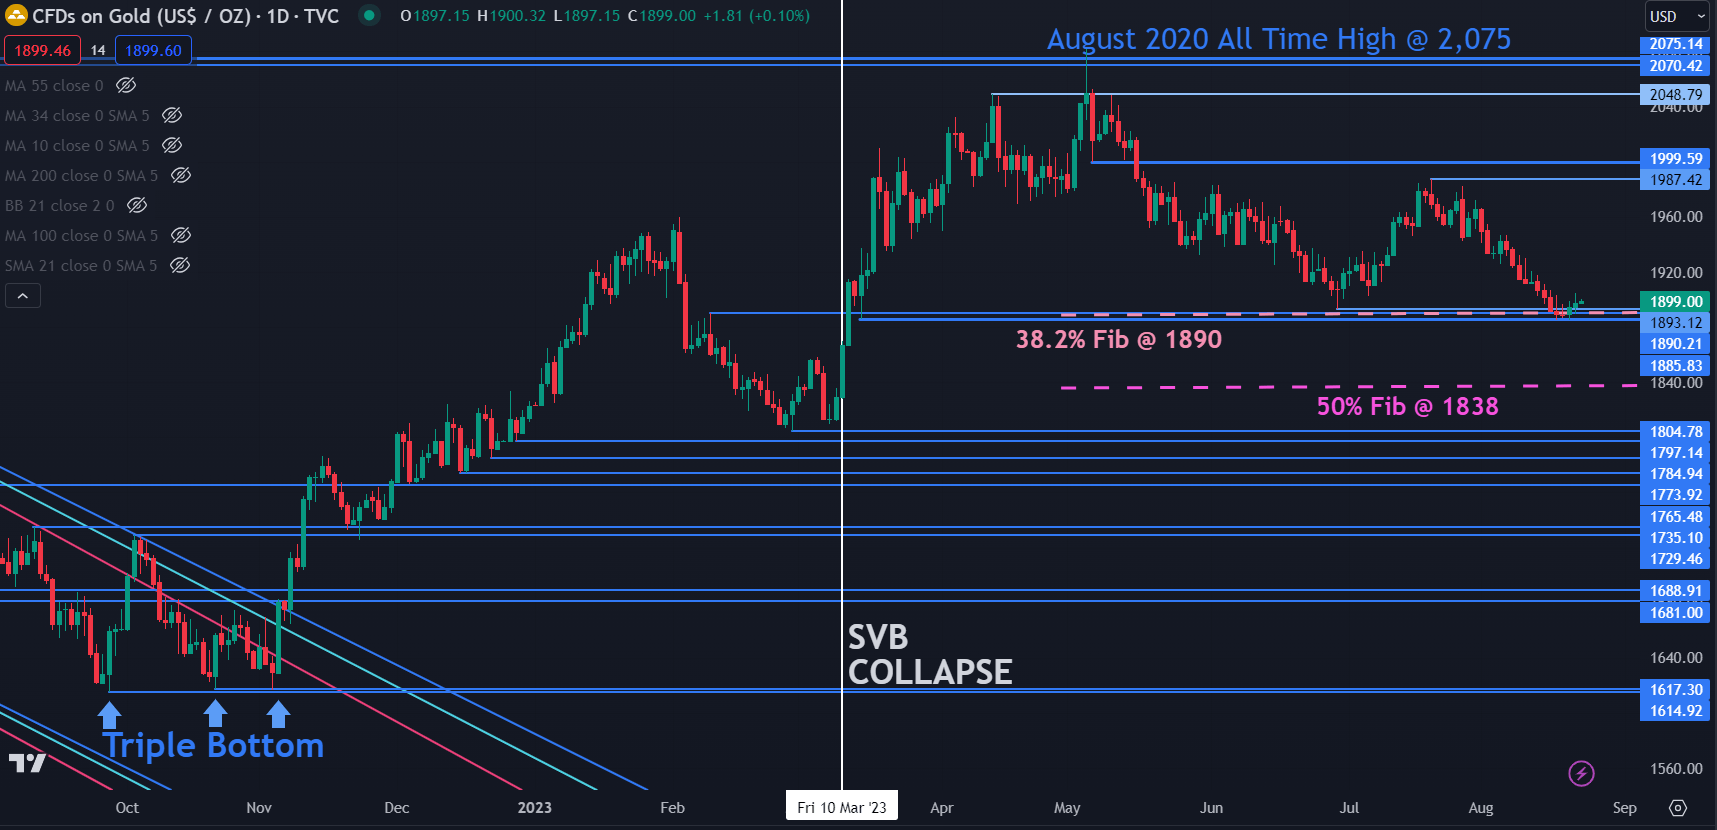
GOLD TECHNICAL ANALYSIS SNAPSHOT

The gold price recently tested a potential support zone in the 1885 – 1895 area.

In that zone, there are a series of prior lows, a breakpoint, and the 38.2% Fibonacci Retracement level of the move from 1614 up to 2062.

Further down the 50% Fibonacci Retracement at 1838 might lend support.

On the topside, resistance might be at the recent peak of 1897 or psychological level at 2000 where there is also the breakpoint nearby.

image3.png


Understanding what slippage means in forex?

Understanding what slippage means in forex?

A Forex Slippage occurs when a trading order is executed or a stop loss closes the position at a different rate than set in the order. For example, you wanted to by the EUR/USD at 1.1385, but the order was executed at 1.1390, so, there was a slippage of 5 price units.

To understand why a slippage occurs, you need to see the way how a trade operation,buying and selling,  is executed in any market. And the currency market is not an exception.

So, to execute any trade in the forex market, there must be at least 1 seller and 1 buyer. Therefore, if a buyer wants to by an instrument, to complete the trade, there must be a seller, willing to sell the instrument at a price that will satisfy the buyer. If there is no seller at such a price, either the trade will not be executed or the buyer will have to accept the price, currently offered by sellers.

The figure shows three sellers, offering to sell the US dollar at 1.1351, 1.1352 and 1.1353 respectively. If a buyer wants to buy at 1.1349, he/she can’t do it, as no one sells at this price. The buyer may try to wait until there will be a better price. If the buyer doesn’t want to wait, he/she will have to accept a less beneficial price. In this case, it is 1.1351, as it is the lowest available price.

LiteFinance: What is Forex Slippage | Litefinance

Yes, this is less profitable, but the trader so has a 100% guarantee that the trade will be executed.

In Forex, there are some moments when the prices are changing very quickly. Let us again see the previous example. Suppose, the buyer agrees to carry out the transaction at 1.1351, being reluctant to wait for the bid price of 1.1349. But, by the time he/she clicks on the Buy button, the market situation has already changed and there was a sharp price movement. And now, there are no sellers, offering the price of 1.1351, or even 1.1352. So, the next seller offers the price of 1.1353.

LiteFinance: What is Forex Slippage | Litefinance

What has happened? The buyer set a buy order at the price, closest to the desired one (at 1.1351). However, as the market situation has changed by the time of the order execution, the next sell price is already at 1.1353. There no sellers offering 1.1351 or 1.1352, so the execution price will be at 1.1353 that is 0.0002 price units higher.

The difference between the intended and the actual execution price, resulted from a change in the market sentiment, is called a slippage.

When can a slippage occur?

A slippage can occur only in trading market orders rather than limit orders. Market orders, when a trader agrees to the conditions of a counterparty come into a few types.

Market buy – A trader agrees to buy/sell at the lowest price currently offered by sellers;

Market sell – A trader agrees to sell at the highest price currently asked by buyers.

LiteFinance: What is Forex Slippage | Litefinance

Buy stop – a pending market buy set higher than the current price

Sell stop – a pending market sell set lower than the current price

Stop loss is also a pending market market buy/sell, closing the position opened.

All these orders are united by the fact that each of them is executed at the best AVAILABLE price. And this “best available” price may be worse than you expect.

What can go wrong?

Let’s take the simplest situation, trading during the news releases. As many know that during the important news publication the price may sharply change in any direction, some traders reduce their risks, moving their orders away from the current price.

It is clear from the figure that at usual time, the distance between the best sell price (1.1351) and the best buy price (1.1350) is only 1 pip, there are quite many active traders willing to trade in both directions, so you are likely to avoid slippage. During the time of important news publication, the distance between the best sell price (1.1353) and the best buy price (1.1349) is already 4 pips, and the trade volume is much less. If a buy order has been put at 1.1351, there will be a slippage, i.e. the price will slip to the nearest sell price, and the actual execution price will be 1.1353.

LiteFinance: What is Forex Slippage | Litefinance

Therefore, if your stop loss/buy stop/sell stop works out at this time, the order may be executed not at the intended price, but at a far worse one. The same will happen if you try to put a market buy or a market sell; a moment ago, the price was good, but when you put the order, the price may be completely different.

What does the a slippage size depend on?

his question especially concerns traders employing short-term trading strategy, who practise pipsing or scalping. Spreads, swaps, brokers’ commission, slippages can drop their profit to zero.  When making short-term trades aimed at a profit of just a few points, slippages may ruin estimated profits completely. So, what does the volume of slippage depend on? There are several factors:

  • market volatility,
  • market liquidity,
  • trading account type,
  • order processing type.

Factor №1: Market volatility

Simply put, market volatility means the degree of the price fluctuations. If, during a minute, the price is 10 pips up and then 5 pips down, the volatility is low. If, during the same time, the price goes 100 pips up and then drops by 70 pips, the volatility is high.

LiteFinance: What is Forex Slippage | Litefinance

The market volatility is mostly affected by the traders’ activity in relation to the instrument and by the instrument liquidity. As a rule, the more appealing is the instrument, the more funds will be invested in it and the stronger will be the price swings.

On the other hand, increased volatility may result from the low liquidity. For example, during the time of important news releases, the ltrade volume around the current price sharply declines as traders just move way the orders put.

Factor №2: Trader’s account type

Account types (I don’t mean a demo account or a cent account) are characterized by a variety of criteria, an order execution speed being one of them.  For example, Standard or Classic accounts are available to most traders because of moderate initial deposits and leverage, but the order execution speed in those accounts is quite average. On the contrary, ECN and STP accounts feature the high speed and accuracy of orders execution.

If you take a Stop Loss order execution as an example, then at a higher execution speed, you are more likely to reduce slippage.

Factor №3: Order processing type

Forex brokers offer two types of orders execution: Instant Execution and Market Execution.

  • With Market Execution, a trade is entered based on the current market situation. If there is no counter-party at the price indicated in a trader’s order, then a position is opened at the “best price currently available” that will differ from the indicated one.
  • With Instant Execution, a trade is opened exclusively at the price indicated in a trader’s order, which excludes naturally any slippages.  If a trader’s price is inadmissible, a requote occurs and a trader can either indicate another price or cancel a trade.

In addition, I should note that Market Execution is mostly offered by forex brokers who want their orders to be filled at the next available market price without any requotes. That is, in this case you are likely to deal with the real market, and it is suitable for all investors. If you are offered Instant execution, the broker is likely to be a so-called “kitchen”, and traders’ orders are not transferred to the real market in this case. It means that the counterparty for your trades will be the market-maker broker itself, so it will be interested in your loss.

Should you be afraid of slippages?

To please you a little, I’ll note that a slippage can be not only negative, but it also can be positive (when the actual execution price is better than you initially specified).

Hardly anyone worries about a positive slippage, so let’s try to understand a negative slippage in more detail.

Basically, a negative slippage (just like a worked-out stop loss or a canceled order) is not a disaster, if you are properly prepared for it.

First, you should keep in mind that a slippage may result not from a market situation but from a technical flaw; problems with a trader’s internet connection, delays in quotes from the liquidity provider and even a simple overload of the computer’s random access memory, due to which the trading terminal is frozen for a few important seconds. Therefore, I recommend closing all the tabs you don’t use for the time of trading and buy some USB-modem for an emergency. It is also advisable to install a trading terminal on a mobile phone / tablet with mobile Internet. In this case, your response will be as fast as possible.

Second, slippage depends on the traded currency pair. Slippage more often occurs during periods of illiquidity that is a feature of cross-currency pairs or minor currency pairs. So, you should ask yourself if trading these instruments is worth a high risk of slippages during the orders execution. You may also think over trading on the news, when the liquidity is much lower, do you really want to trade during such periods?

Third, you remember that pipsers and scalpers are most of all affected by slippages in currency trading. Slippage of 5-10 points cannot significantly affect a trader who trades on the H1 timeframe, whose stop loss is around 100 p. To reduce the chance of slippage, you can trade 5 instruments on the H1 timeframe instead of 1 instrument on the M1-M5 timeframe. The number of transactions in these cases will be about the same, but when trading on H1, slippage will affect your profit much less.

As a final touch when you put an order, pay attention to the Deviation box.

LiteFinance: What is Forex Slippage | Litefinance

This parameter determines the maximal value of slippage when the order will be executed. For example, if you select “3” and the slippage was “5” you order won’t be executed. This precaution makes sense only as an addition to your forex trading strategy along with all of the above, rather than the only method to mitigate slippage. After all, this is a parameter “inside” a trading terminal, entirely dependent on its efficiency.

Instead of a conclusion

Summing it all up, slippage has the least impact on the traders who work with the most traded forex pairs (“Majors”) on H1 and longer timeframes, as well as those with 2 terminals installed on different devices and with 2 Internet providers.

When you open a trading account, consider ECN, NDD and STP account types, where the orders are processed as fast as possible. These recommendations are enough to minimize the impact of slippage on your trading.

I wish you successful trading!


P.S. Did you like my article? Share it in social networks: it will be the best “thank you” 🙂

Ask me questions and comment below. I’ll be glad to answer your questions and give necessary explanations.

Useful links:

  • I recommend trying to trade with a reliable broker here. The system allows you to trade by yourself or copy successful traders from all across the globe.
  • Use my promo-code BLOG for getting deposit bonus 50% on LiteFinance platform. Just enter this code in the appropriate field while depositing your trading account.
  • Telegram chat for traders: https://t.me/litefinancebrokerchat. We are sharing the signals and trading experience
  • Telegram channel with high-quality analytics, Forex reviews, training articles, and other useful things for traders https://t.me/liteforex

Forex Slippage

The content of this article reflects the author’s opinion and does not necessarily reflect the official position of LiteFinance. The material published on this page is provided for informational purposes only and should not be considered as the provision of investment advice for the purposes of Directive 2004/39/EC.

Asia Day Ahead: Elevated Yields, Weaker Wall Street Handover Keeps Wait-and-See in Place

Asia Day Ahead: Elevated Yields, Weaker Wall Street Handover Keeps Wait-and-See in Place

Market Recap

Despite a resilient start to the week, Wall Street did not manage to find much follow-through overnight (DJIA -0.51%; S&P 500 -0.28%; Nasdaq +0.06%), as elevated Treasury yields and the lack of further heavy-lifting by Nvidia (-2.8%) kept a cautious tone in place. The US two-year yields have edged above the 5% level, while the 10-year yields continue to consolidate around its 16-year high.

There was not much of a trigger for the calibration in yields yesterday, except for a caution from Richmond Fed President Thomas Barkin that the reacceleration in demand may make the case for further tightening. More broadly, it seems that the series of resilient US economic data are providing a reckoning for rates to be kept high for longer, with the US economic surprise index hovering at its highest level since March 2021.

The day ahead will leave a series of flash PMI data in focus. Previous month’s readings have seen further weakening in global economic activities across the board, but expectations are for the US economy to hold up in July. Consensus are looking for the US flash PMI figures to stay largely unchanged from the previous month (52.0), with a more lukewarm outcome preferred by pointing to softer demand but also keep hopes of a soft landing in place.

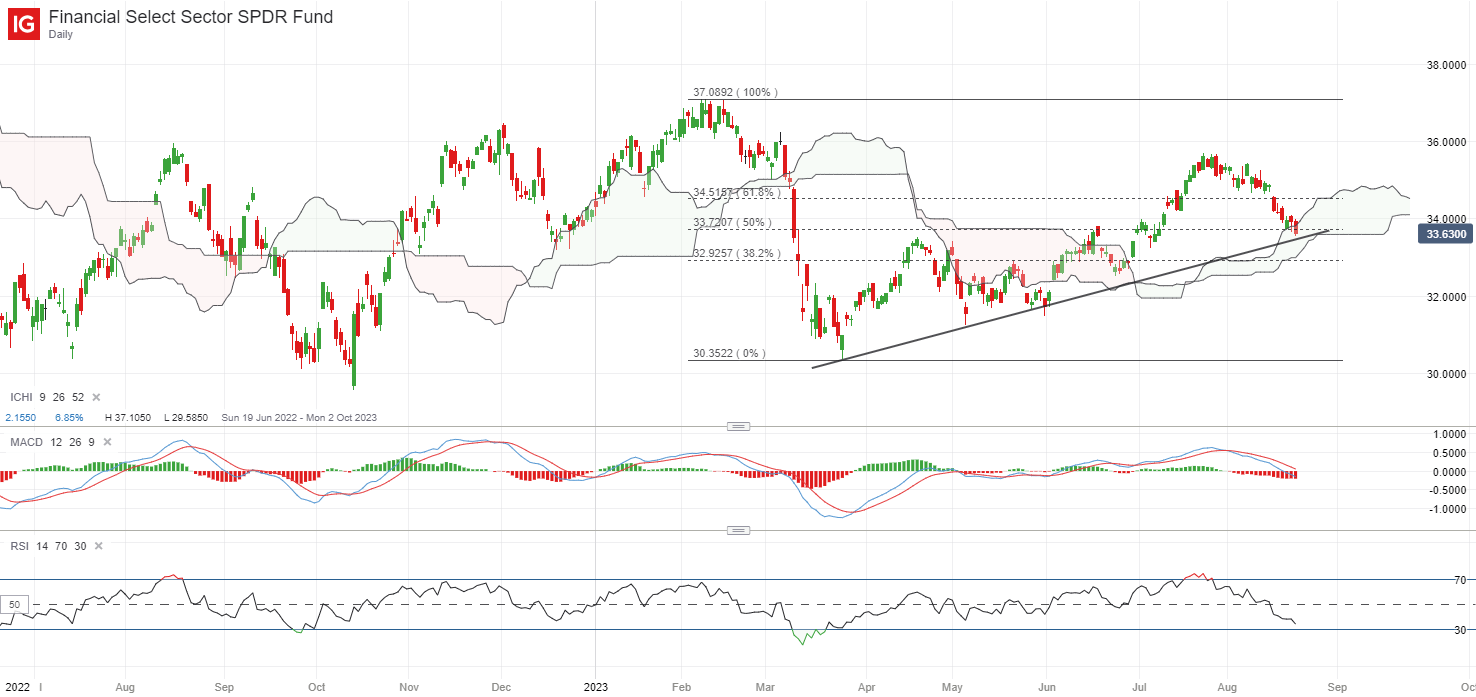
Perhaps one to watch may be the Financial Select Sector SPDR Fund (XLF), in which recent S&P’s downgrade of five US regional banks has put the sector down by 0.9% overnight. That brought the XLF back towards a trendline support, which coincides with its Ichimoku cloud support zone on the daily chart. However, a break below its 200-day moving average (MA) overnight does not provide much conviction for the bulls, who now face the task of having to reclaim the MA line. Any break below the trendline support could place the 32.50 level on watch next.

image1.png

Source: IG charts

Asia Open

Asian stocks look set for a subdued open, with Nikkei +0.11%, ASX +0.47% and KOSPI -0.03% at the time of writing. Elevated US yields and the weaker handover from Wall Street may put on some wait-and-see in the region in the lead-up to Nvidia’s result release today, which may determine if the AI hype and tech rally could find another round of invigoration. On another note, Chinese equities saw a late-afternoon bounce in yesterday’s trading session, with one to watch for any follow-through today.

The economic calendar today saw Australia’s flash composite PMI dipping further into contractionary territory (47.1 versus previous 48.2) on softer services activities, while a slightly firmer footing is found in Japan’s PMI data (52.6 versus previous 52.2). The day ahead will leave Singapore’s Consumer Price Index (CPI) data on the radar next.

Thus far, the series of policy tightening by the MAS has been working its way into economic conditions, with headline inflation receding from its earlier peak of 7.5% to the current 4.5%, while the core aspect softened below 5% for the second straight month. Expectations are for the moderating trend in inflation to continue, with headline inflation to further ease to 4.1% and core CPI to head below the 4% mark at 3.8% in July.

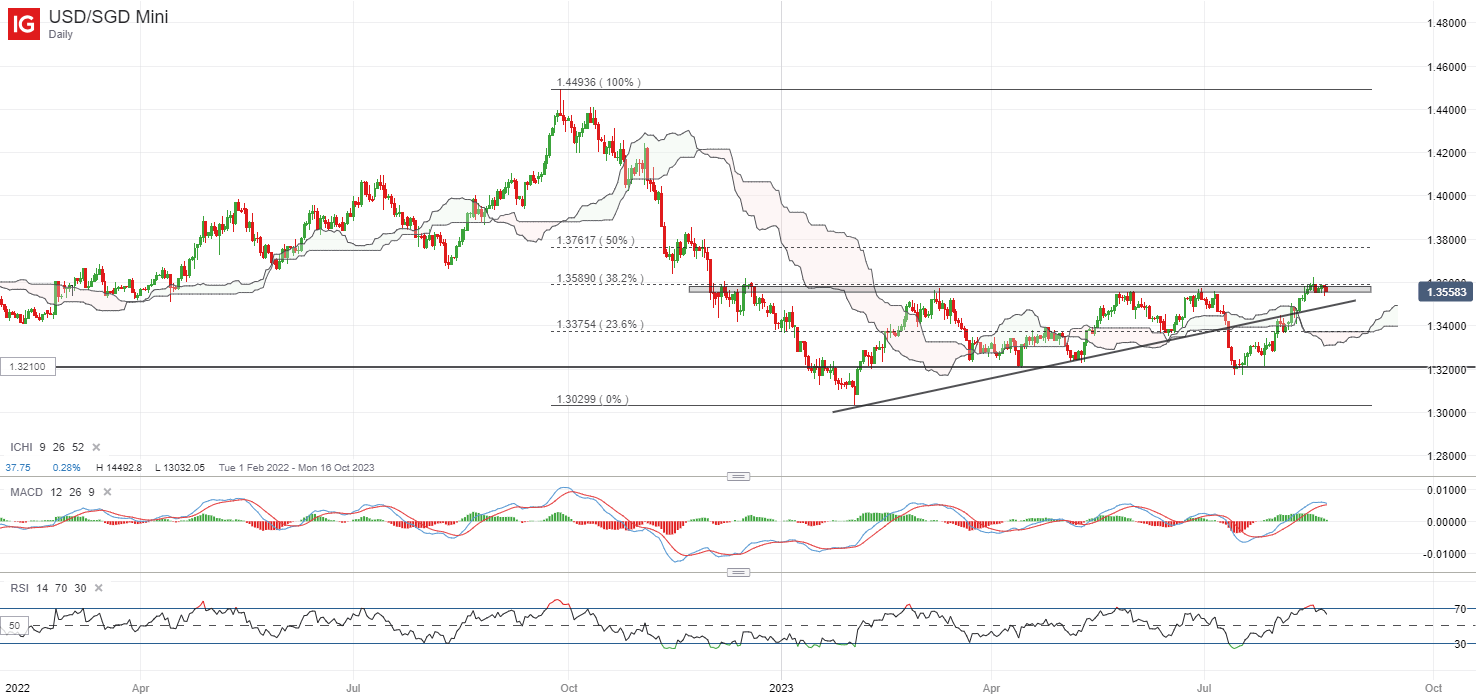
The USD/SGD continues to hover around its year-to-date high at the 1.360 level. Trading above its 200-day MA for the first time since November 2022 could still place buyers in control, while its weekly RSI heads above the 50 level. Any softer read in Singapore’s inflation numbers could support the pair further, with any break above the 1.360 level potentially paving the way to retest the 1.376 level next.

image2.png

Source: IG charts

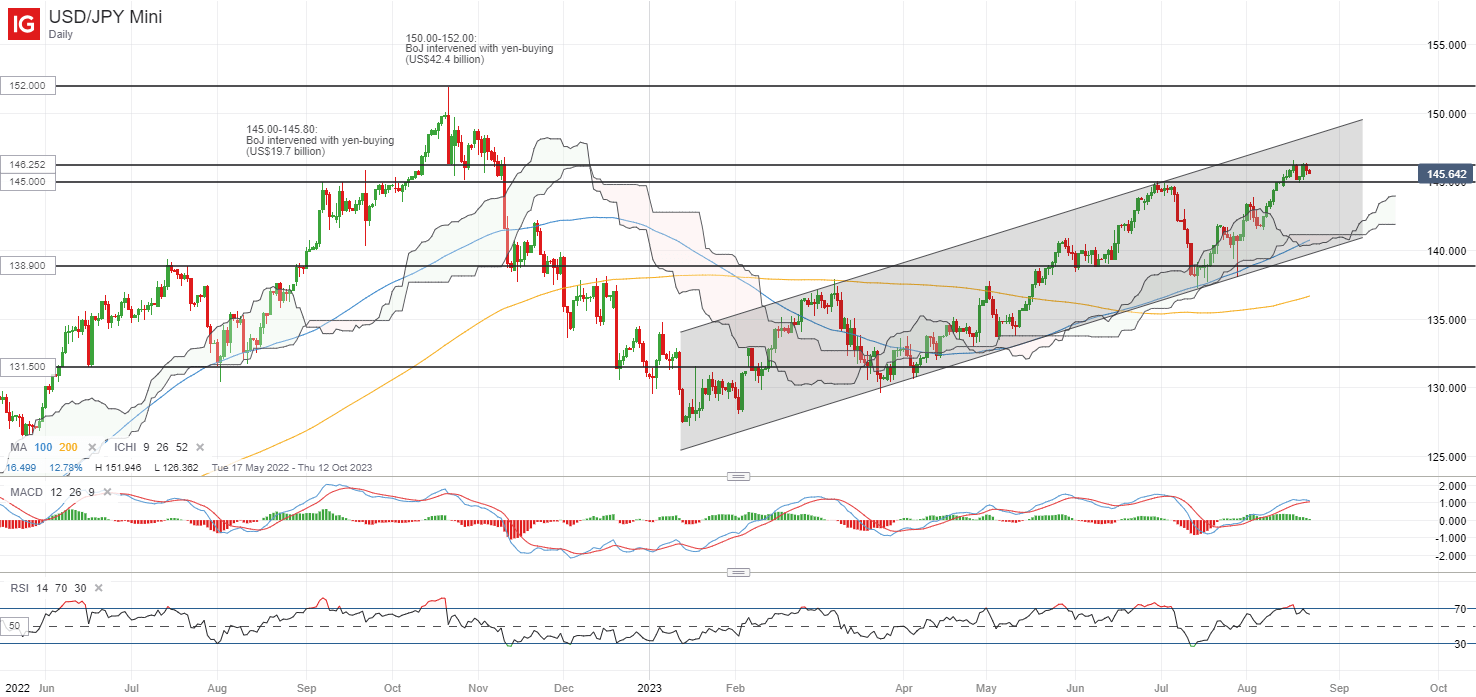
On the watchlist: USD/JPY attempting to defend 145.00 level

Despite a firmer US dollar overnight, the USD/JPY continues to face a near-term test of resistance at the 145.00-145.80 level, where an earlier yen-buying intervention by the Bank of Japan (BoJ) was executed in September 2022. Some signs of exhaustion are displayed for now, with lower highs in the daily RSI on recent tops, as sentiments are kept in check for fresh clues on the Fed’s policy outlook ahead of the key Jackson Hole Symposium. The 145.00 level will have to see some defending from the bulls, failing which could call for a retest of the 141.80 level next, while the 146.25 level will be an immediate resistance to overcome.

image3.png

Source: IG charts