The Crypto Market Has Fallen Victim to the Safe-haven Demand

The Crypto Market Has Fallen Victim to the Safe-haven Demand

Bitcoin’s Drop Below Moving Averages Indicates Bearish Trend

The financial markets have been under pressure due to the trend of moving out of risky assets as government bond yields rose, said Alex Kuptsikevich, the FxPro senior market analyst. Cryptocurrencies seemed to be immune to this trend for a while, but last week, there was a switch to a sell-off mode amid rising US Treasury yields to 16-year highs and fears about China’s debt problems.

Crypto market capitalisation fell 9.7% last week to stabilise at $1.058 trillion, finding buyers on dips below $1.05 trillion. Technically, the market is still above the previous local lows of June, giving hope for a continued uptrend. However, it is worrying that July’s highs are lower than April’s.

Trading Derivatives carries a high level of risk to your capital and you should only trade with money you can afford to lose. Trading Derivatives may not be suitable for all investors, so please ensure that you fully understand the risks involved, and seek independent advice if necessary. A Product Disclosure Statement (PDS) can be obtained either from this website or on request from our offices and should be considered before entering into a transaction with us. Raw Spread accounts offer spreads from 0.0 pips with a commission charge of USD $3.50 per 100k traded. Standard account offer spreads from 1 pips with no additional commission charges. Spreads on CFD indices start at 0.4 points. The information on this site is not directed at residents in any country or jurisdiction where such distribution or use would be contrary to local law or regulation.

Bitcoin weekly chartBitcoin closed the week with a notable drop below its 200-week and 200-day moving averages, signalling a shift to a bearish trend. From current levels near $26.0K, the following area of decline appears to be the last pivot area at $24.7K.

Crypto News

According to JPMorgan, Bitcoin miners are exploring new lines of business ahead of the halving. According to the bank, miners could find it lucrative to provide computing services in the fast-growing artificial intelligence market.

The US Securities and Exchange Commission (SEC) is ready to approve the first applications for Ethereum futures ETFs in October, Bloomberg reported, citing sources. The SEC is now reviewing 11 applications to launch such ETFs.

Payments giant Mastercard has launched a CBDC innovation research partner programme with companies in the blockchain industry, including Ripple, ConsenSys and Fireblocks. Mastercard notes that 93% of the world’s central banks are experimenting with digital currency, and four retail CBDCs are already in circulation.

Oil Prices Forecast: WTI, Brent Futures Strength Reflects Tightening Supplies

Oil Prices Forecast: WTI, Brent Futures Strength Reflects Tightening Supplies

Oil Prices Climb Amid Tightening Global Supply

Oil prices witnessed a surge on Monday, with Brent and WTI crude futures observing an uptick, reflecting tighter global supply dynamics. Key exporters such as Saudi Arabia and Russia are trimming down their supply, rendering the overall supply-demand landscape intriguing for traders and investors.

Reduced Exports by Key Players

The tightening of global oil supply can be attributed to decisions made by significant oil exporters. Preliminary data from ship-tracking firm Kpler indicated a second consecutive month of falling OPEC+ crude exports in August. Saudi Arabia, in particular, has decreased its shipments to China by a significant 31% in July from June. Despite this decrease, Russia, offering its crude at discounted rates, has maintained its position as China’s top supplier.

Trading Derivatives carries a high level of risk to your capital and you should only trade with money you can afford to lose. Trading Derivatives may not be suitable for all investors, so please ensure that you fully understand the risks involved, and seek independent advice if necessary. A Product Disclosure Statement (PDS) can be obtained either from this website or on request from our offices and should be considered before entering into a transaction with us. Raw Spread accounts offer spreads from 0.0 pips with a commission charge of USD $3.50 per 100k traded. Standard account offer spreads from 1 pips with no additional commission charges. Spreads on CFD indices start at 0.4 points. The information on this site is not directed at residents in any country or jurisdiction where such distribution or use would be contrary to local law or regulation.


China’s Shift and Economic Concerns

As oil prices soared above $80 a barrel due to supply cuts by OPEC and allies, including Russia, China has opted to utilize its record inventories accumulated earlier this year. This has led Chinese refiners to cut back on new purchases. Additionally, amidst China’s deepening property crisis and potential sluggish economic growth, concerns about sustained oil demand growth have arisen. However, to capitalize on strong export margins, Chinese refiners have amplified their refined product exports in July.

US Oil Output and Interest Rate Concerns

On the American front, a drop in the number of operating oil rigs was noted, marking their lowest count since March 2022, according to Baker Hughes’ recent report. This comes alongside concerns about a persistent robust US dollar, given speculations that interest rates might remain elevated for an extended period.

Short-term Outlook

The prevailing scenario reflects a bullish short-term outlook for oil. With global supplies reducing and demand surging, unless an unforeseen economic downturn occurs, it seems OPEC+ holds the reins. The next movements, especially concerning interest rates and global economic health, will be critical for the oil market’s trajectory.

Technical Analysis

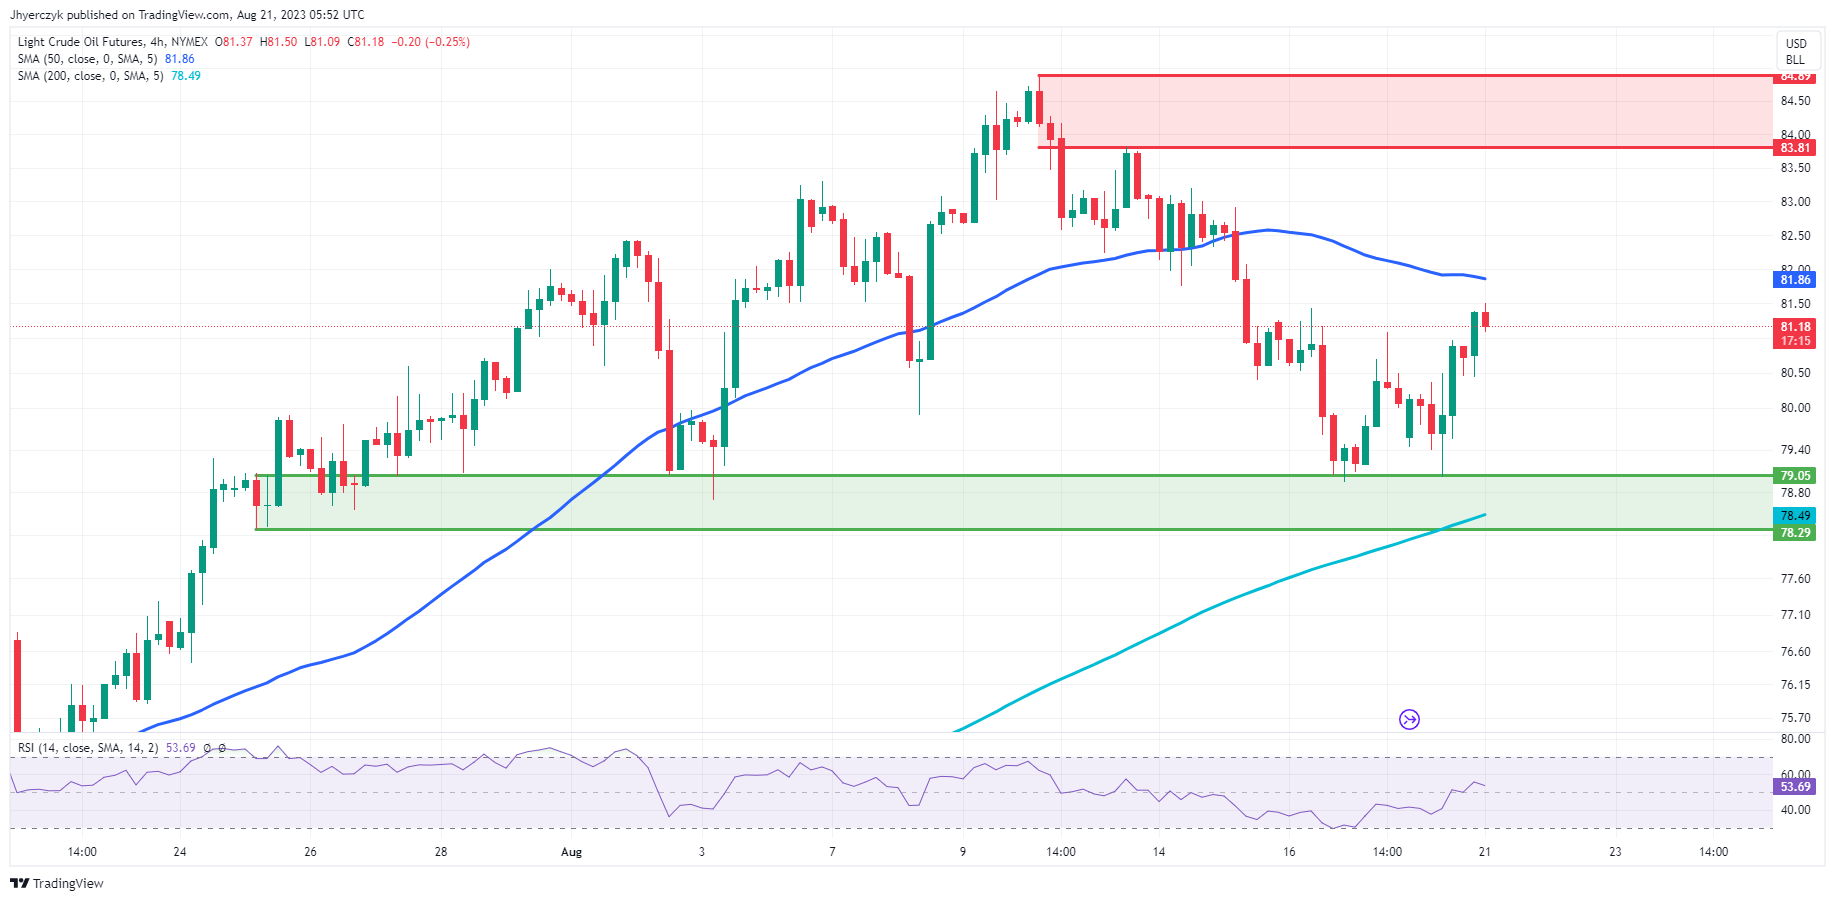
4-Hour Crude OilThe current 4-hour price for Crude Oil stands at $81.18, slightly below the previous 4-hour close of $81.38. This price resides comfortably between the 200-4H moving average of $78.49 and the 50-4H moving average of $81.86, suggesting a consolidation phase. The 14-4H RSI reads 53.49, slightly above the neutral 50 mark, indicating a tad stronger momentum.

With respect to key levels, the price is hovering just above the main support area of $79.05 to $78.29 and below the main resistance zone of $83.81 to $84.89. Given these technical indicators, the market sentiment for Crude Oil on a 4-hour timeframe appears to be mildly bullish but largely neutral.

AUD to USD Forecast: Australian Dollar Eyes PBoC’s LPR Cuts Amid Fed Rate Speculations

AUD to USD Forecast: Australian Dollar Eyes PBoC’s LPR Cuts Amid Fed Rate Speculations

Friday Overview

On Friday, the AUD/USD slipped by 0.02%, ending the week down 1.41% to 0.64017. A bullish start to the session saw the Australian dollar rise to an early high of $0.64289 before falling to a midday low of $0.63790.

China and the PBoC Are in the Spotlight Today

It is a quiet start to the week. There are no economic indicators from Australia or China to influence investor sentiment.

Trading Derivatives carries a high level of risk to your capital and you should only trade with money you can afford to lose. Trading Derivatives may not be suitable for all investors, so please ensure that you fully understand the risks involved, and seek independent advice if necessary. A Product Disclosure Statement (PDS) can be obtained either from this website or on request from our offices and should be considered before entering into a transaction with us. Raw Spread accounts offer spreads from 0.0 pips with a commission charge of USD $3.50 per 100k traded. Standard account offer spreads from 1 pips with no additional commission charges. Spreads on CFD indices start at 0.4 points. The information on this site is not directed at residents in any country or jurisdiction where such distribution or use would be contrary to local law or regulation.

However, the PBoC will be in the spotlight this morning. The PBoC will set the one-year and five-year loan prime rates (LPR) as investors look toward Beijing for more stimulus.

Economists expect the PBoC to cut the one-year and five-year loan prime rates by 15 basis points to 3.4% and 4.05%, respectively. The Aussie dollar may need larger-than-expected cuts in the LPRs and the talk of more stimulus to kickstart the week on a bullish footing.

Last week, employment figures from Australia raised bets on an RBA hold on interest rates in September. Weaker labor market conditions and an elevated interest rate environment should curb spending and ease consumer-demand-driven inflationary pressures.

China’s economic woes and contagion fear will likely be another consideration for the RBA.

A Light US Economic Calendar Leaves the Fed in Focus

It is a quiet start to the week on the US economic calendar. There are no US economic indicators to impact sentiment toward Fed monetary policy.

However, investors should consider FOMC member chatter ahead of the Jackson Hole Symposium on Thursday and Friday. On Wednesday, the FOMC meeting minutes revealed FOMC members are open to further rate hikes. Fed Chair Powell could greenlight a September rate hike on Friday.

We expect hawkish Fed chatter to drive bets on a September rate hike and a higher-for-longer interest rate environment to tackle the tight US labor market and sticky inflation.

At present, monetary policy divergence remains firmly in favor of the dollar. Interest rate differentials and sentiment toward RBA and Fed monetary policy outlooks tip the scales, leaving the dollar vulnerable to dovish Fed commentary.

AUD/USD Price Action

Daily Chart

The Daily Chart showed the AUD/USD sat below the $0.6430 – $0.6450 resistance band. Significantly, a nine-day losing streak left the Aussie below the 50-day and 200-day EMAs, sending bearish near and longer-term price signals.

Looking at the 14-Daily RSI, 29.31 shows the AUD/USD in oversold territory. The RSI aligns with the 50-day EMA, signaling a fall to sub-$0.64 to give the bears a run at the $0.6340 – $0.6320 support band. However, avoiding sub-$0.64 would bring the $0.6430 – $0.6450 resistance band into play.

AUD to USD Daily Chart sends bearish price signals.
AUDUSD 210823 Daily Chart

4-Hourly Chart

Looking at the 4-Hourly Chart, the AUD/USD hovers below the $0.6430 – $0.6450 resistance band. The extended pullback from the $0.68 handle leaves the AUD/USD below the 50-day and 200-day EMAs, affirming bearish near and longer-term price signals.

Looking at the 14-4-Houly RSI, 43.16 reflects a bearish sentiment, with selling pressure overweighing buying pressure. The RSI is aligned with the EMAs supporting a fall to sub-$0.64 to give the bears a run at the $0.6340 – $0.6320 support band. However, a move through the $0.6430 – $0.6450 resistance band would bring the 50-day EMA into play.

4-Hourly Chart affirms bearish price signals.
AUDUSD 210823 4-Hourly Chart
EUR/USD Forecast: Analysis of ECB Rhetoric and German Producer Price Impacts

EUR/USD Forecast: Analysis of ECB Rhetoric and German Producer Price Impacts

Friday Overview

The EUR/USD declined by 0.03% on Friday, ending the week down 0.70% to $1.08682. A bullish start to the Friday session saw the EUR/USD rise to an early high of $1.08938. However, risk aversion sent the EUR/USD to a midday low of $1.08448 before steadying.

People’s Bank of China Cuts Loan Prime Rates

China was in focus this morning. Investors will consider the latest PBoC move to support the ailing economy. The PBoC reduced the one-year loan prime rate (LPR) by 10 basis points. However, the PBoC left the five-year LPR unchanged.

Trading Derivatives carries a high level of risk to your capital and you should only trade with money you can afford to lose. Trading Derivatives may not be suitable for all investors, so please ensure that you fully understand the risks involved, and seek independent advice if necessary. A Product Disclosure Statement (PDS) can be obtained either from this website or on request from our offices and should be considered before entering into a transaction with us. Raw Spread accounts offer spreads from 0.0 pips with a commission charge of USD $3.50 per 100k traded. Standard account offer spreads from 1 pips with no additional commission charges. Spreads on CFD indices start at 0.4 points. The information on this site is not directed at residents in any country or jurisdiction where such distribution or use would be contrary to local law or regulation.

Economists expected the PBoC to reduce the one-year and five-year loan prime rates by 15 basis points each to 3.40% and 4.05%, respectively.

Beijing needs to deliver a substantial stimulus package to ease market jitters about the Chinese economy and contagion. Failure to convince the markets will likely pressure the EUR/USD over the nearer term.

German Producer Price Numbers a Litmus Test

It is a relatively quiet start to the week for the EUR/USD. However, German producer prices for July will provide direction. The current weak demand environment has weighed on producers, with intense competition to attract new orders sending producer prices south.

While falling producer prices ease consumer price inflationary pressures, falling prices reflect the macroeconomic environment and raise the threat of an extended recession. The combination would leave the ECB in a holding pattern, a bearish price scenario.

Economists forecast German producer prices to fall by 0.2% in July after a 0.3% decline in June. Significantly, economists expect producer prices to decrease by 5.1% year-over-year versus +0.1% in June. Numbers aligned with or worse than the year-on-year forecast would be bearish for the EUR/USD.

Hotter-than-expected numbers would signal a possible shift in demand and ease fears of a deep recession.

With inflation still the hot topic among central bankers, investors should track ECB chatter. However, no ECB Members are on the calendar to speak today, leaving commentary with the media to move the dial.

On Friday, ECB Chief Economist Philip Lane said the Eurozone should avoid a deep or sustained economic recession, lifting the EUR/USD from session lows. However, prelim private sector PMIs would need to send a similar message on Wednesday to signal the beginning of a recovery.

Quiet US Economic Calendar Puts the Jackson Hole Symposium in Focus

There are no US economic indicators to influence the afternoon. After hotter-than-expected US economic indicators from last week, Fed chatter will need consideration.

We expect EUR/USD sensitivity to Fed commentary as investors consider the Jackson Hole Symposium, which will draw interest on Thursday and Friday. With sentiment toward Fed monetary policy still hawkish, the dollar is at risk of a sharp pullback on dovish Fed comments. However, market risk sentiment will also provide direction.

Risk aversion and a flight to safety would drive demand for the dollar as a safe haven currency.

EUR/USD Price Action

Daily Chart

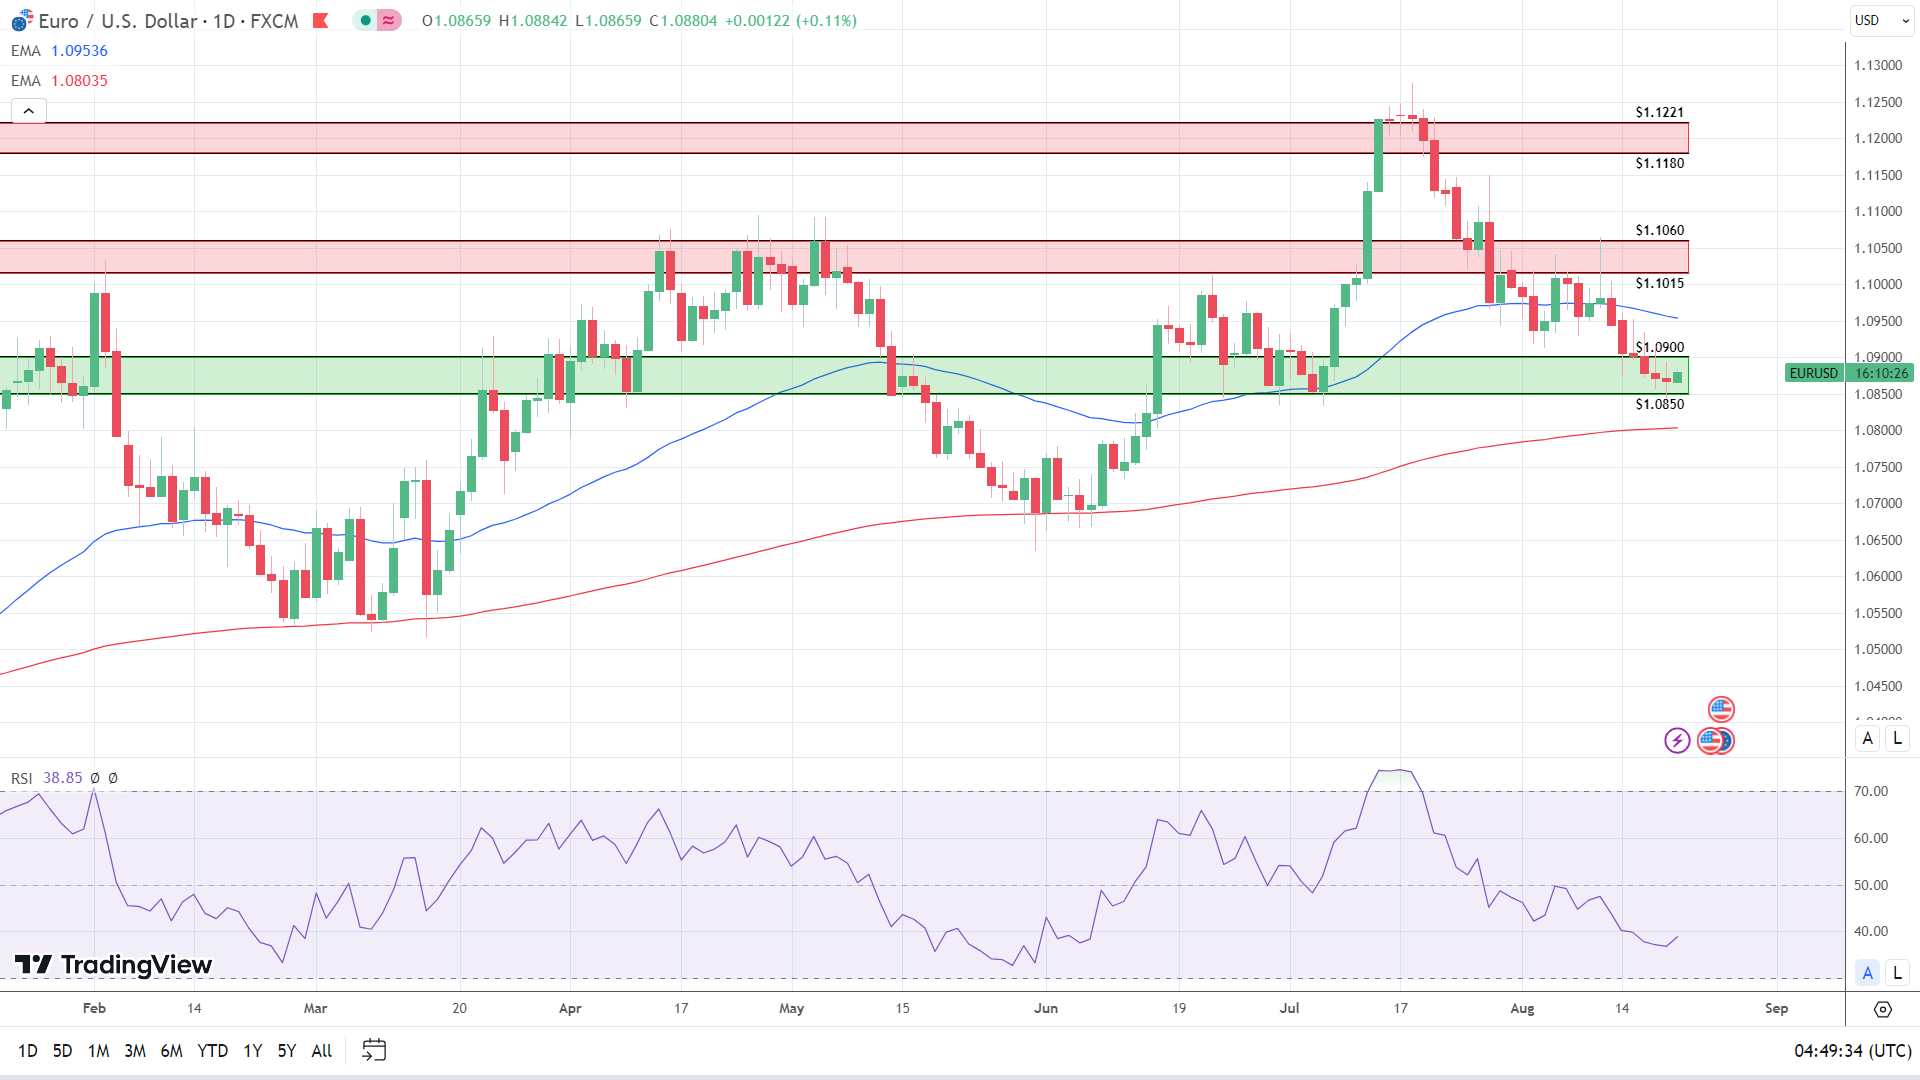
The Daily Chart showed the EUR/USD sitting above the lower level of the 1.0900 – $1.0850 support band. After six consecutive days in the red, the EUR/USD sat below the 50-day EMA while holding above the 200-day EMA, sending bearish near-term but bullish longer-term price signals.

Looking at the 14-Daily RSI, the 38.85 reading reflects bearish sentiment. The RSI aligns with the 50-day EMA, signaling a fall through the $1.0900 – 1.0850 support band to target the 200-day EMA and $1.08. However, a EUR/USD break out from the upper level of the $1.0850 – $1.0900 support band would bring the 50-day EMA into play.

EUR/USD Daily Chart sends bearish near-term price signals.
EURUSD 210823 Daily Chart

4-Hourly Chart

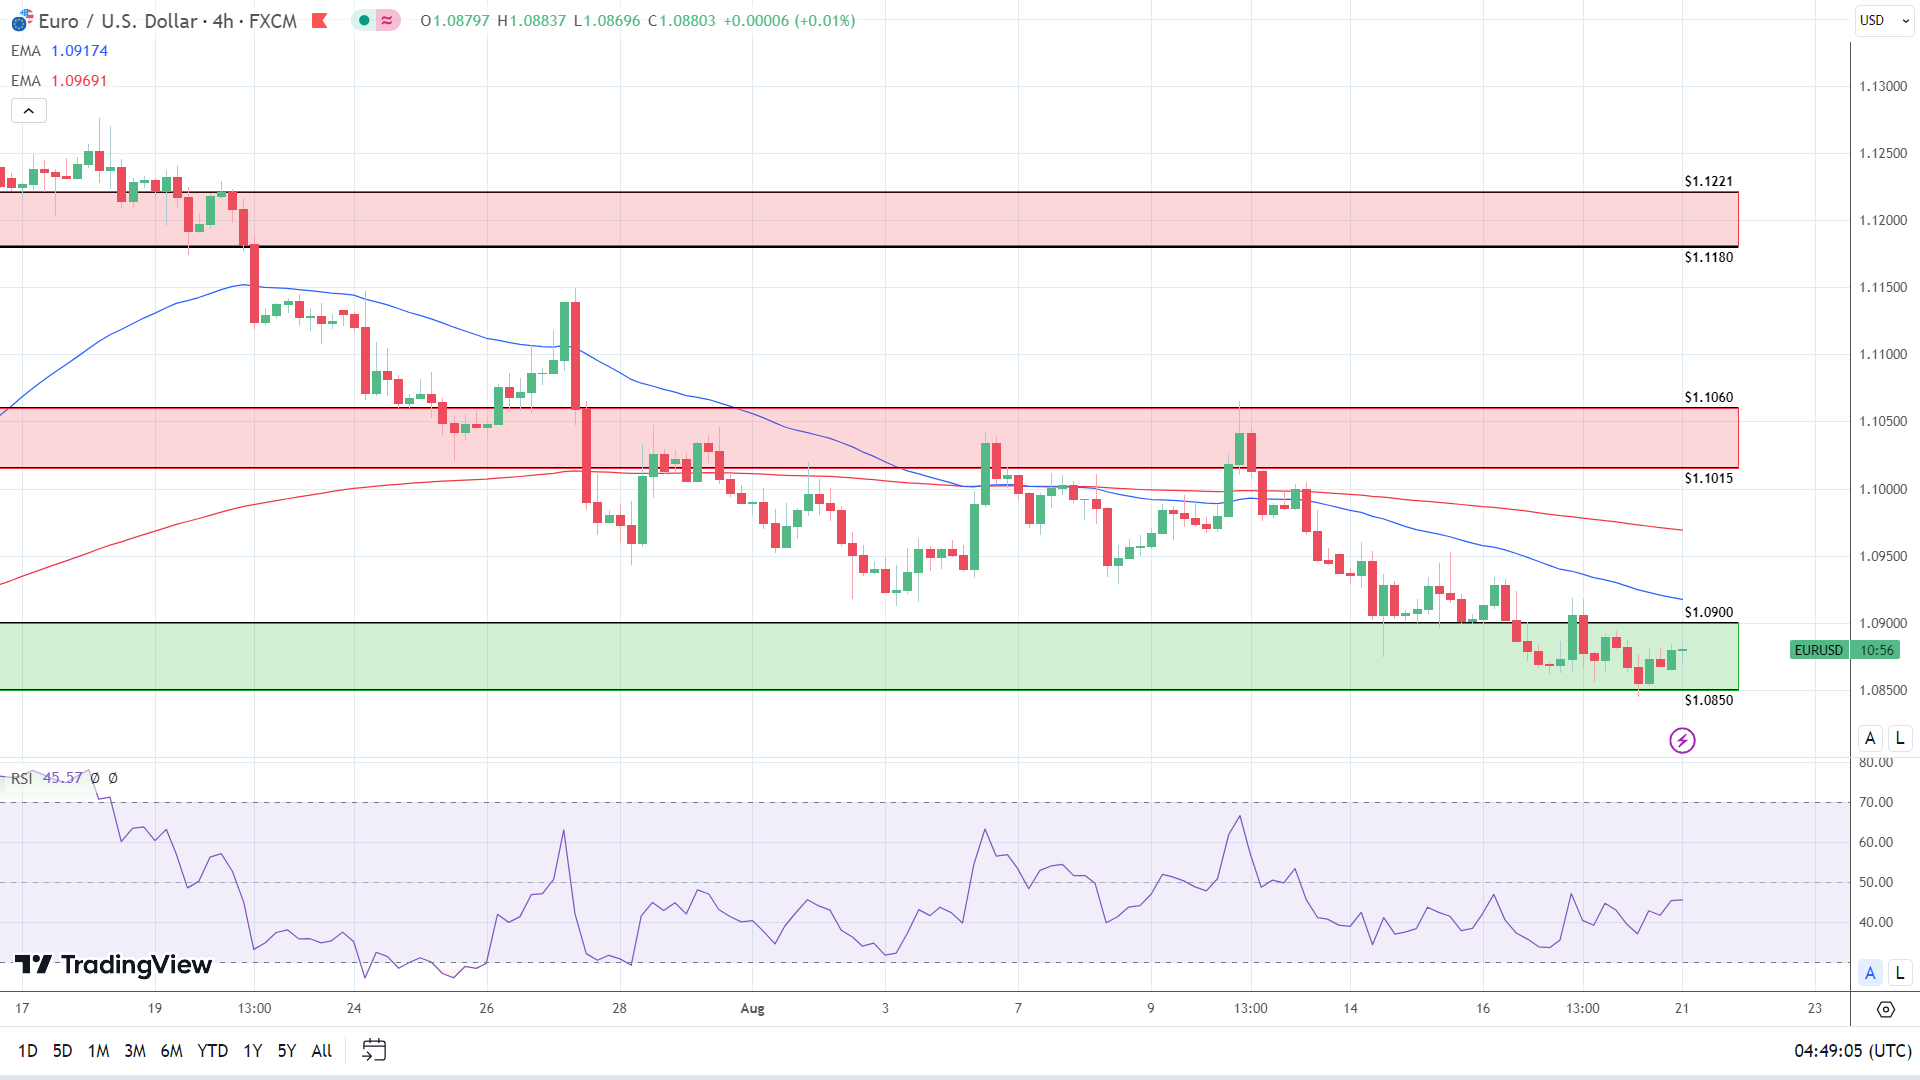
Looking at the 4-Hourly Chart, the EUR/USD sits within the $1.0900 – $1.0850 support band. After the August 7 bearish cross, the EUR/USD remains below the 50-day and 200-day EMAs, affirming bearish near and longer-term price signals.

The 14-4H RSI at 45.57 reflects bearish sentiment, with selling pressure outweighing buying pressure. Significantly, the RSI signals a fall through the $1.0900 – $1.0850 support band to target $1.08. However, a move through the upper level of the $1.0900 – $1.0850 support band would bring the 50-day EMA into play.

Price action today hinges on the German producer prices and central bank speeches.

4-Hourly Chart affirms bearish near-term price signals.
EURUSD 210823 4 Hourly Chart
Silver Prices Forecast: XAG/USD Resilient Amid Gold’s Woes

Silver Prices Forecast: XAG/USD Resilient Amid Gold’s Woes

Silver’s Response to Economic Moves and Central Bank Insights

Silver (XAG/USD) is experiencing an uptick, rebounding from 5-month lows, and remaining resilient amidst gold’s struggles. As the trading community keenly awaits updates from the central bankers’ summit in Jackson Hole, Wyoming, economic forecasts and interest rate discussions are keeping investors vigilant.

Treasury Yields, Dollar Pressure XAG/USD

Recent surges in the U.S. Treasury yields and a stronger U.S. dollar have exerted pressure on both gold and silver markets. Notably, the 10-year U.S. Treasury note recently achieved a 15-year high, while the dollar maintains a robust position, hovering above the 103-mark. This strength in the dollar, combined with the benchmark 10-year U.S. Treasury note yielding 4.23%, is creating challenges for silver’s growth.

Trading Derivatives carries a high level of risk to your capital and you should only trade with money you can afford to lose. Trading Derivatives may not be suitable for all investors, so please ensure that you fully understand the risks involved, and seek independent advice if necessary. A Product Disclosure Statement (PDS) can be obtained either from this website or on request from our offices and should be considered before entering into a transaction with us. Raw Spread accounts offer spreads from 0.0 pips with a commission charge of USD $3.50 per 100k traded. Standard account offer spreads from 1 pips with no additional commission charges. Spreads on CFD indices start at 0.4 points. The information on this site is not directed at residents in any country or jurisdiction where such distribution or use would be contrary to local law or regulation.

Powell’s Speech Fuels Rate Speculations

Global attention is now centered on U.S. Federal Reserve chair Jerome Powell’s imminent speech. Speculations are rife about whether Powell’s remarks will echo the recent hawkish tone of the FOMC minutes. The minutes highlighted the potential for more rate hikes due to persistently high inflation, suggesting the need for further monetary restrictions to alleviate pricing pressures.

Economists Debate Future Fed Moves

However, a recent Reuters poll of economists hinted at a possible pause in the Fed’s rate hikes, with a subset even proposing a potential rate cut after March. External factors like rising Treasury bond yields and climbing home mortgage rates might reduce the Fed’s appetite for additional hikes. In Asia, the underwhelming rate cut by China added to market uncertainties.

Short-Term Outlook on Silver

For Silver (XAG/USD), its near-future is heavily influenced by central bank decisions. As the market anticipates Powell’s address, any indications, be it dovish or hawkish, could instigate market movements. With SPDR Gold Trust seeing its first influx since July, it underscores the sustained investor appetite for precious metals. In essence, silver’s forthcoming path is a tightrope walk, influenced by global financial indicators and inherent demand patterns.

Technical Analysis

4-Hour Silver (XAG/USD)Silver’s current 4-hour price of 22.82 shows a slight decline from the previous 4-hour price of 22.85. This price is positioned between the 200-4H moving average (23.72) and the 50-4H moving average (22.68). The fact that it’s above the 50-4H MA but below the 200-4H MA suggests a neutral to slightly bearish momentum in the short term, but longer-term bearishness. The 14-4H RSI at 55.19 indicates stronger momentum, being above the neutral 50 mark but not reaching the overbought zone.

With the price in close proximity to the main support area (22.70 to 22.28) and below the main resistance area (23.00 to 23.85), the market leans towards a bearish sentiment although susceptible to a near-term short-covering rally.

Gold Prices Forecast: Powell’s Upcoming Speech Could Tip XAU/USD’s Scales

Gold Prices Forecast: Powell’s Upcoming Speech Could Tip XAU/USD’s Scales

Gold (XAU/USD) Prices React Ahead of Central Bankers’ Gathering in Wyoming

Gold (XAU/USD) prices saw a slight reprieve from recent declines, moving off 5-month lows as the trading world awaits pivotal insights from central bankers’ gathering in Jackson Hole, Wyoming. Key discussions on economic outlooks and interest rate decisions have kept investors on their toes.

Gold Prices Rise Amidst Struggle

In early trades, spot gold (XAU/USD) advanced 0.3% to $1,892.88 per ounce, while U.S. gold futures mirrored the movement, ticking up 0.3% to $1,921.70. This positive momentum comes even as gold struggled, earlier touching a mid-March low, prompted by robust economic data fueling expectations of prolonged higher U.S. interest rates. Such rates often dampen the allure of non-yielding assets like gold.

Trading Derivatives carries a high level of risk to your capital and you should only trade with money you can afford to lose. Trading Derivatives may not be suitable for all investors, so please ensure that you fully understand the risks involved, and seek independent advice if necessary. A Product Disclosure Statement (PDS) can be obtained either from this website or on request from our offices and should be considered before entering into a transaction with us. Raw Spread accounts offer spreads from 0.0 pips with a commission charge of USD $3.50 per 100k traded. Standard account offer spreads from 1 pips with no additional commission charges. Spreads on CFD indices start at 0.4 points. The information on this site is not directed at residents in any country or jurisdiction where such distribution or use would be contrary to local law or regulation.

Dollar’s Strength Challenges Gold’s Advance

In the currency realm, the dollar’s steadfast hold above the 103-mark continues to challenge gold’s progress. With global attention focused on U.S. Federal Reserve chair Jerome Powell’s upcoming speech, anticipation mounts on whether his statements will align with the recent hawkish undertones of the FOMC minutes. Notably, most economists in a Reuters poll suggest the Fed may halt further interest rate hikes, with a slight tilt towards those believing a potential cut might only emerge post-March.

Asian Markets React to China’s Moves

Rising Treasury bond yields and increasing home mortgage rates hint at a possible wane in the Federal Reserve’s enthusiasm for more hikes, especially given the softer inflation backdrop. Meanwhile, the Asian markets faced headwinds. China’s smaller-than-expected cut to lending rates left markets wanting, extending a pattern of underwhelming fiscal actions from Beijing.

Short-Term Forecast

Gold’s (XAU/USD) immediate future hinges significantly on central bank movements and sentiments. The metal’s slight recovery might be tested post-Powell’s speech, and any dovish or hawkish hints could catalyze shifts. Moreover, SPDR Gold Trust’s reported 0.3% rise, its first inflow since late July, indicates underlying investor interest in the precious metal. Gold’s trajectory remains a balancing act between global economic cues and intrinsic demand dynamics.

Technical Analysis

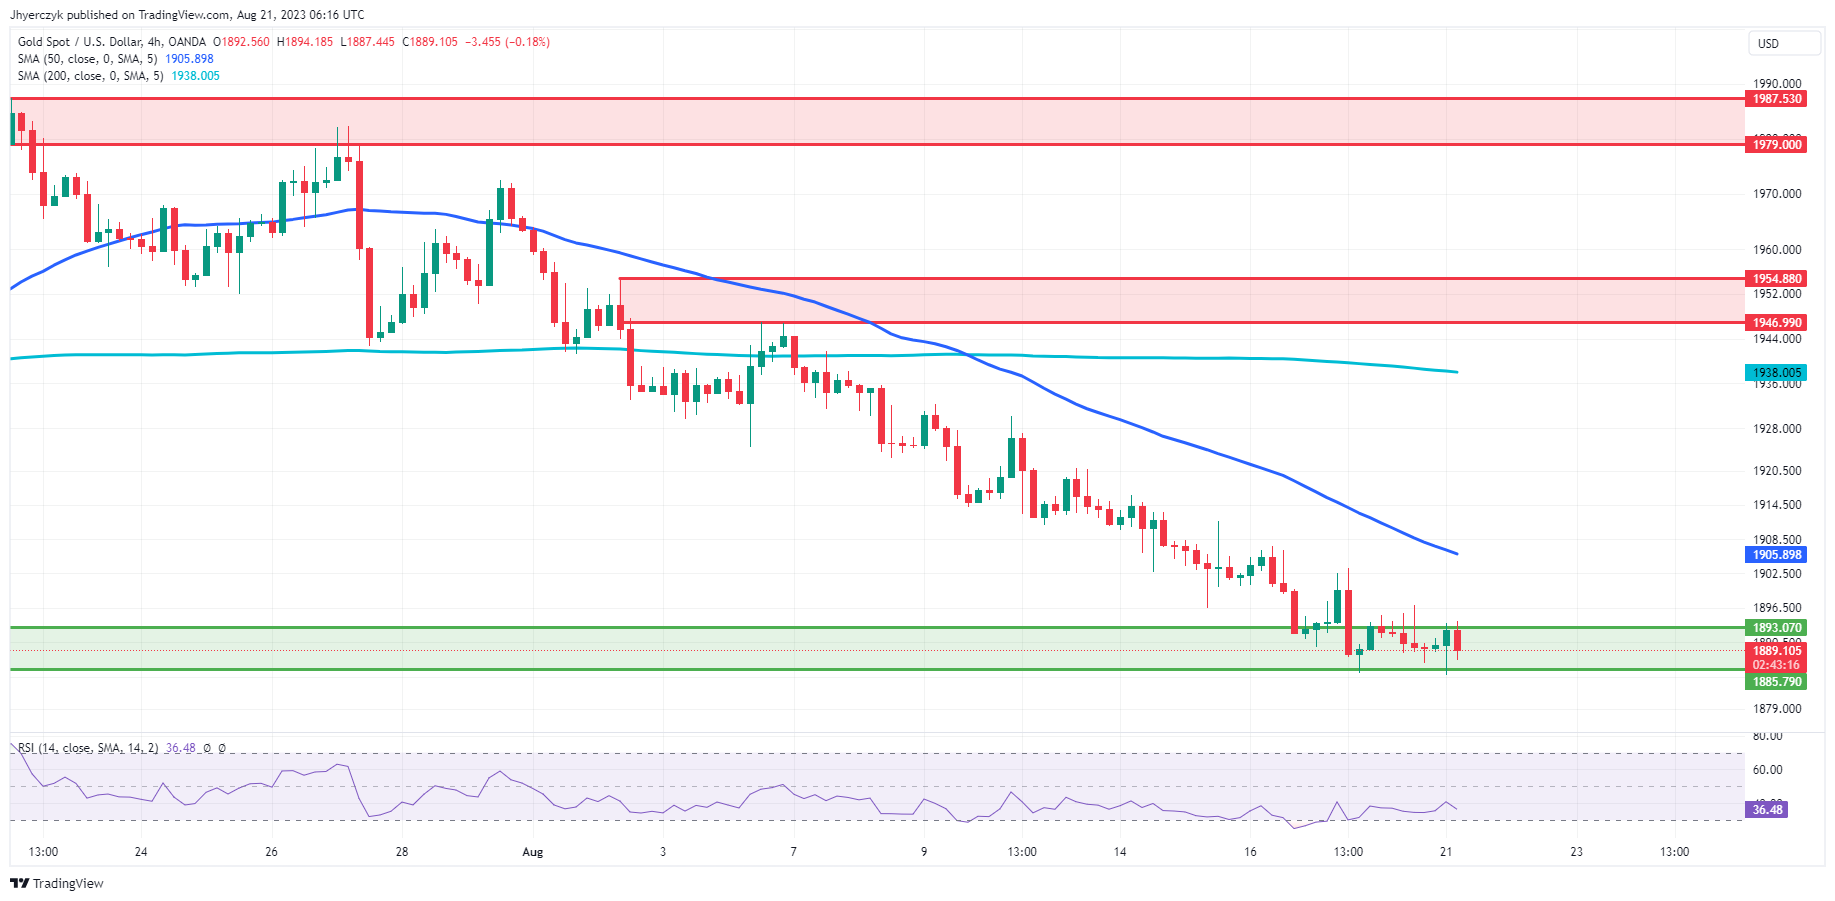
4-Hour Gold (XAU/USD)Gold’s (XAU/USD) current 4-hour price sits at 1889.17, slightly below the previous 4-hour price of 1892.56, indicating a minor retracement. Importantly, this price is below both the 200-4H moving average (1938.00) and the 50-4H moving average (1905.90), suggesting a bearish sentiment in the short term. The 14-4H RSI reading of 36.46 is below the neutral 50 mark, leaning towards the oversold territory, hinting at weakened momentum.

The current price is nearing the main support area, which ranges from 1893.07 to 1885.79, potentially acting as a floor for the commodity. However, considering all the technical indicators, the current market sentiment for Gold on the 4-hour chart appears bearish, but vulnerable to a near-term counter-trend retracement.

German Producer Prices Fall at a Faster Pace In July, Down 1.1%

German Producer Prices Fall at a Faster Pace In July, Down 1.1%

German Producer Prices

It is a relatively quiet day on the European economic calendar today. However, German producer prices for July garnered interest this morning. The ongoing weak demand environment has weighed on producer prices, delivering more recessionary jitters.

Today’s numbers provide little relief, with the worse-than-expected figures dashing hopes of a pickup in demand.

German producer prices fell by 1.1% in July (June: -0.3%), while producer prices were down 6.0% (June: +0.1%) year-over-year. Economists forecast a 0.2% decline in July and a 5.1% fall year-over-year.

According to Destatis, the surge in producer prices in July 2022 because of the Ukraine war weighed on the year-on-year figure.

Looking at the numbers,

  • Energy prices slid by 2.5% in July and were down 19.3% compared with July 2022.
  • Significantly, electricity prices tumbled by 4.1% in July and fell by 30.0% year-over-year.
  • Natural gas prices saw a first year-over-year decline since December 2020, falling by 16.2%.
  • Excluding energy prices, the producer price index rose by 2.0% year-over-year while declining by 0.4% in July.

However, the sector breakdown delivered mixed signals.

  • Prices for intermediate goods declined by 1.0% in July and were down 3.4% year-over-year.
  • In contrast, non-durable consumer goods prices increased by 8.1% year-over-year, while flat for July. Food prices contributed to the year-on-year increase.
  • Prices for durable consumer goods were also flat in July, while prices increased by 5.8% year-over-year.
  • Capital goods prices gained 0.3% in July and increased by 5.5% year-over-year.
  • Motor vehicle, trailer, and semi-trailer prices increased by 5.1% year-over-year, contributing to the rise in the headline number.

While the year-over-year figure was bearish, the ECB will be mindful of the base effect stemming from the war in Ukraine. However, the larger-than-expected monthly decline was bearish, suggesting a deteriorating demand environment.

EUR/USD Reaction to German Producer Prices

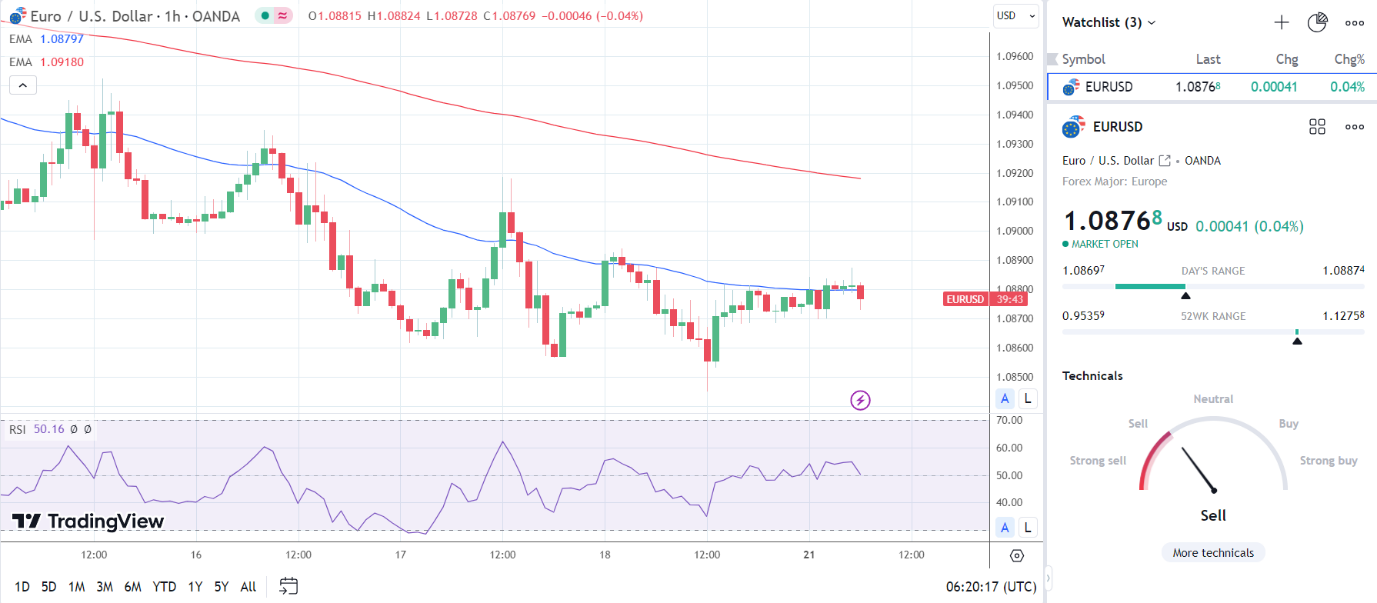
Before the German producer price figures, the EUR/USD fell to a pre-report low of $1.08697 before rising to a high of $1.08874.

However, in response to the numbers, the EUR/USD rose to a post-stat high of $1.08824 before falling to a low of $1.08728.

This morning, the EUR/USD was up 0.04% to $1.08768.

EUR/USD responds to German Producer Price Index figures.
210823 EURUSD Hourly Chart 

US indices attempt to stabilise, while China’s loan prime rates delivered more modest response: Nasdaq 100, Hang Seng Index, US dollar

US indices attempt to stabilise, while China’s loan prime rates delivered more modest response: Nasdaq 100, Hang Seng Index, US dollar

Major US indices were subdued to end last Friday (DJIA +0.07%; S&P 500 -0.01%; Nasdaq -0.20%), but nevertheless, it reflected an attempt to stabilise following three straight days of heavy losses. This comes as the VIX touches its highest level in nearly three months as a sign of prevailing market caution, but with the sharp paring of its gains on Friday potentially providing some solace in the near term.

This week, movements in the US Treasury yields will remain on the radar to guide risk sentiments, with the two-year yields stuck in a consolidation over the past week while the 10-year and 30-year yields are both hovering just below their October 2022 peak. A fresh break to a new multi-year high may keep a high-for-longer rate outlook in place, which is likely to renew the selling pressure on risk assets, while a turn lower in bond yields could support some near-term relief. For now, all three US indices remain below their respective 50-day moving average (MA).

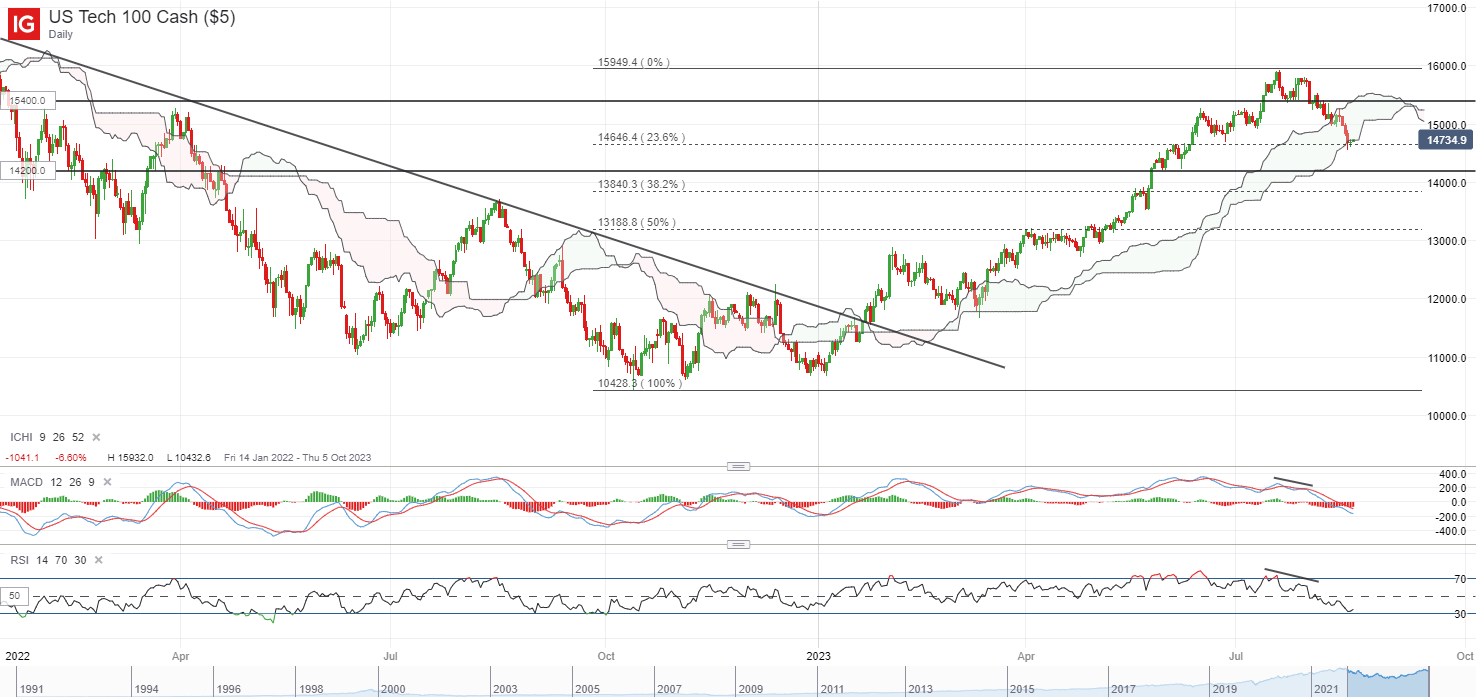
Perhaps one to watch may be the Nasdaq 100 index, which is retesting a near-term support confluence at the 14,600 level, where a 23.6% Fibonacci retracement stands if drawn from its October 2022 bottom to recent July 2023 peak. This also coincides with a Ichimoku cloud support zone on the daily chart. Any failure for the 14,600 level to hold this week may potentially pave the way to retest the 14,200 level next.

image1.png

Asia Open

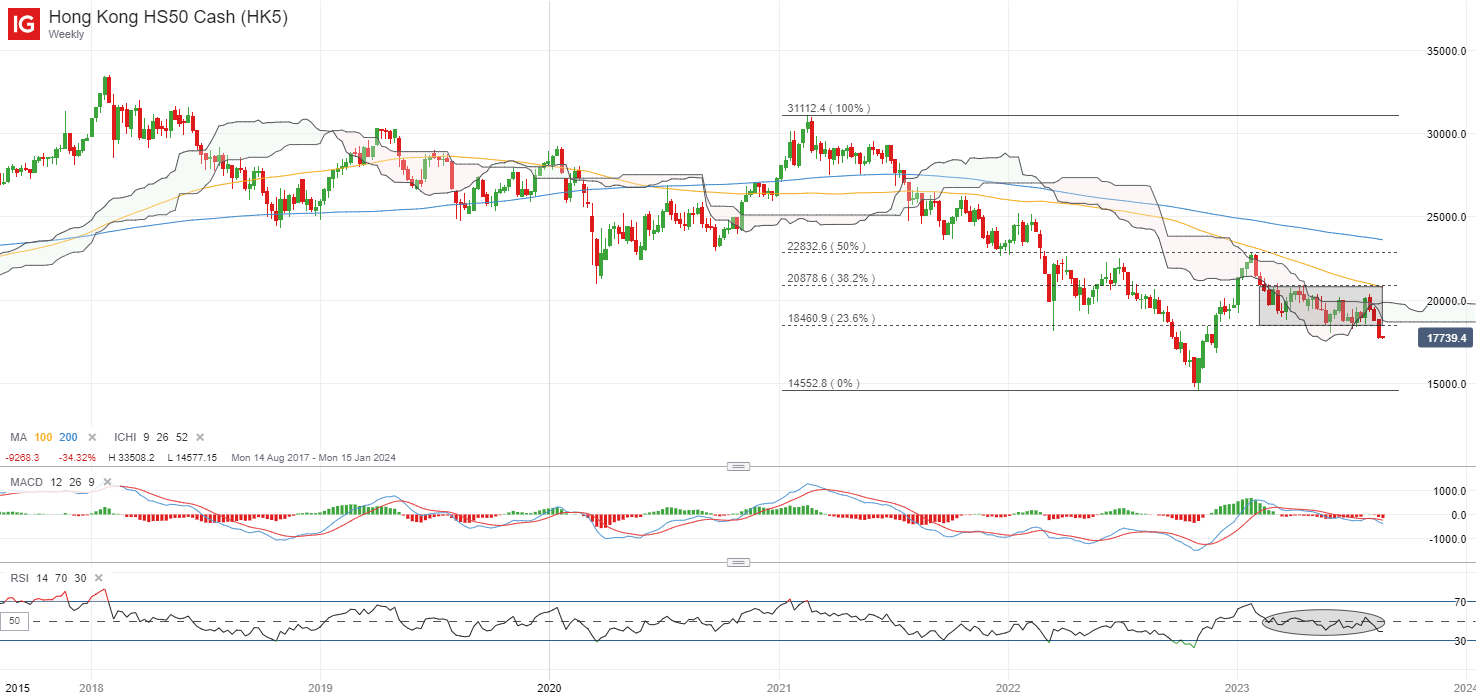
Asian stocks look set for a mixed open, with Nikkei +0.55%, ASX -0.26% and KOSPI +0.66% at the time of writing. Chinese equities continue to see some shunning, with the Nasdaq Golden Dragon China Index down 3.5% last Friday despite the more subdued showing in Wall Street. The Hang Seng Index has now registered a new year-to-date low, as risks in the property sector have not been met with a compelling response from authorities thus far. The preferences for more indirect support from authorities were once again reflected with further calls from the People’s Bank of China (PBoC) and financial regulators for banks to increase lending, but whether it will be met with a significant increase in demand will still be a question.

Following the surprise 15 basis-point (bp) cut to its one-year medium-term lending facility (MLF) rate last week, broad expectations for a similar cut to both one-year and five-year loan prime rate today were met with disappointment. The one-year loan prime rate today was cut by 10 bp cut to 3.45%, while the five-year loan prime rate, which influences the pricing of home mortgages, was surprisingly kept unchanged. The more modest response has kept overall sentiments in Chinese equities in check, potentially with worries for the property sector risks to drag for longer and drive a low-for-longer economic growth story.

Having broken to a new lower low, it seems that sellers remain in control for the Hang Seng Index, with a 23.6% Fibonacci retracement level given way last week. That may place the 16,900 level on watch next. Greater conviction for the bulls may still have to come from a move back above its Ichimoku cloud resistance on the weekly chart around the key psychological 20,000 level.

image2.png

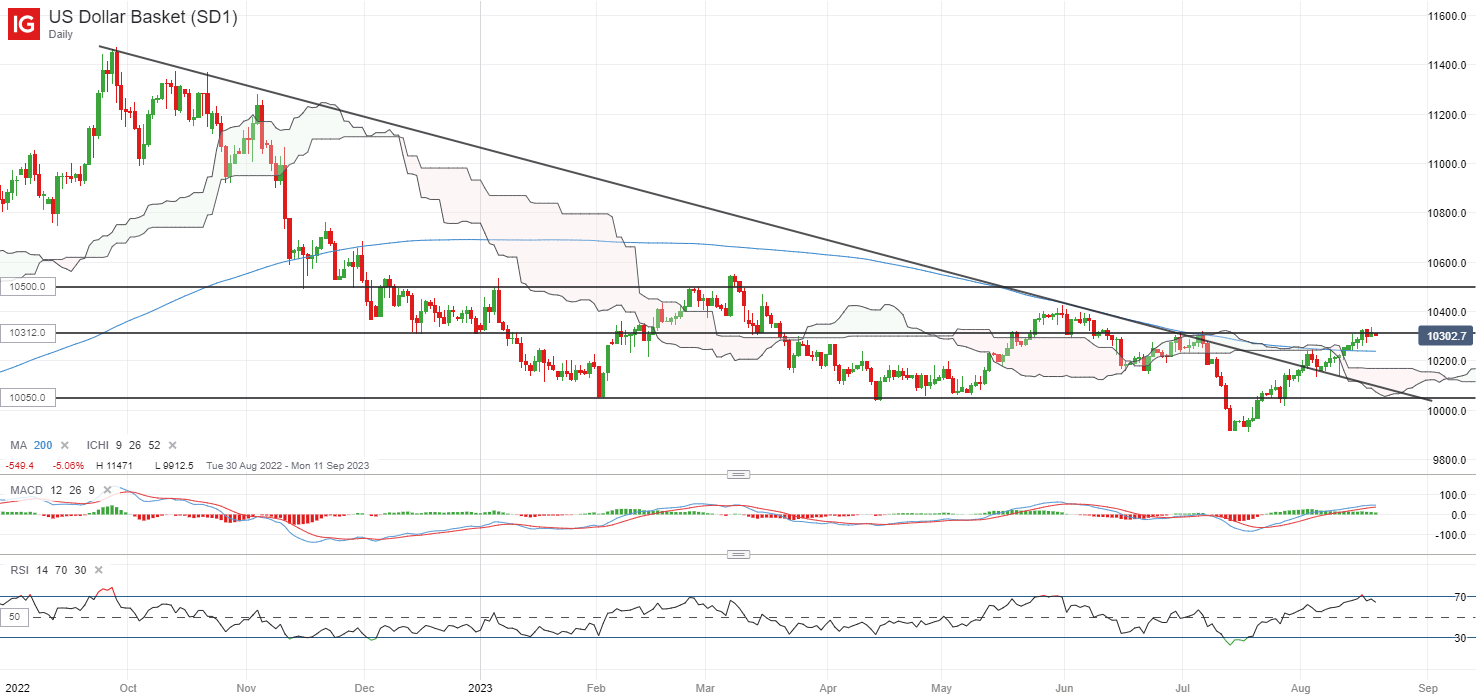
Similar to the point of reckoning for US Treasury yields ahead, the US dollar is also consolidating around a key resistance at the 103.12 level, where it failed to overcome back in June and July this year. Its relative strength index (RSI) on the weekly chart is also hovering at its key 50 level, where it has failed to get over since November last year. Failure to move past the 50 level could still leave sellers in greater control, which keeps the broader downward trend in place. For now, any turn lower in the US dollar could leave the 102.30 level on watch, while on the other hand, breaking past the 103.12 level of resistance could potentially pave the way to retest the 105.00 level.

image3.png


New Zealand Dollar Reverses Gains After PBOC Move; NZD/USD, AUD/NZD, GBP/NZD Setups

New Zealand Dollar Reverses Gains After PBOC Move; NZD/USD, AUD/NZD, GBP/NZD Setups

The New Zealand dollar gave up early gains against its peers after China cut its one-year benchmark lending rate but left its five-year rate unchanged.

The one-year benchmark lending rate was cut by 10 basis points, while the five-year rate was left unchanged, contrary to expectations for 15 basis-point cuts to both. Over the weekend, China pledged to coordinate financial support to resolve local government debt problems.

Local government finances have worsened due to the prolonged weakness in the property sector, causing a credit crunch for a number of developers. Last week, China unexpectedly lowered key policy rates for the second time in three months in a bid to revive the faltering post-Covid economic recovery, rising deflation risks, and tightening credit conditions.

NZD/USD Daily Chart

image1.png

Beijing has announced a series of measures in recent months to cushion some of the downside risks to the economy, including cuts in key lending benchmarks, targeted measures toward the property sector aimed at the supply side, and signaled the end of the years-long crackdown on the technology sector. Many are awaiting additional measures for the struggling property sector addressing the demand side and infrastructure. China is New Zealand’s largest trading partner, and any improvement in China’s growth prospects bodes well for NZD.

NZD has been underperforming against some of its amid deteriorating NZ economic growth outlook for the current year and the belief that NZ interest rates have peaked. Last week, the Reserve Bank of New Zealand (RBNZ) kept its cash rate steady, as expected, but slightly pushed out when it expects to start cutting interest rates to 2025.

NZD/USD: At the lower edge of the support

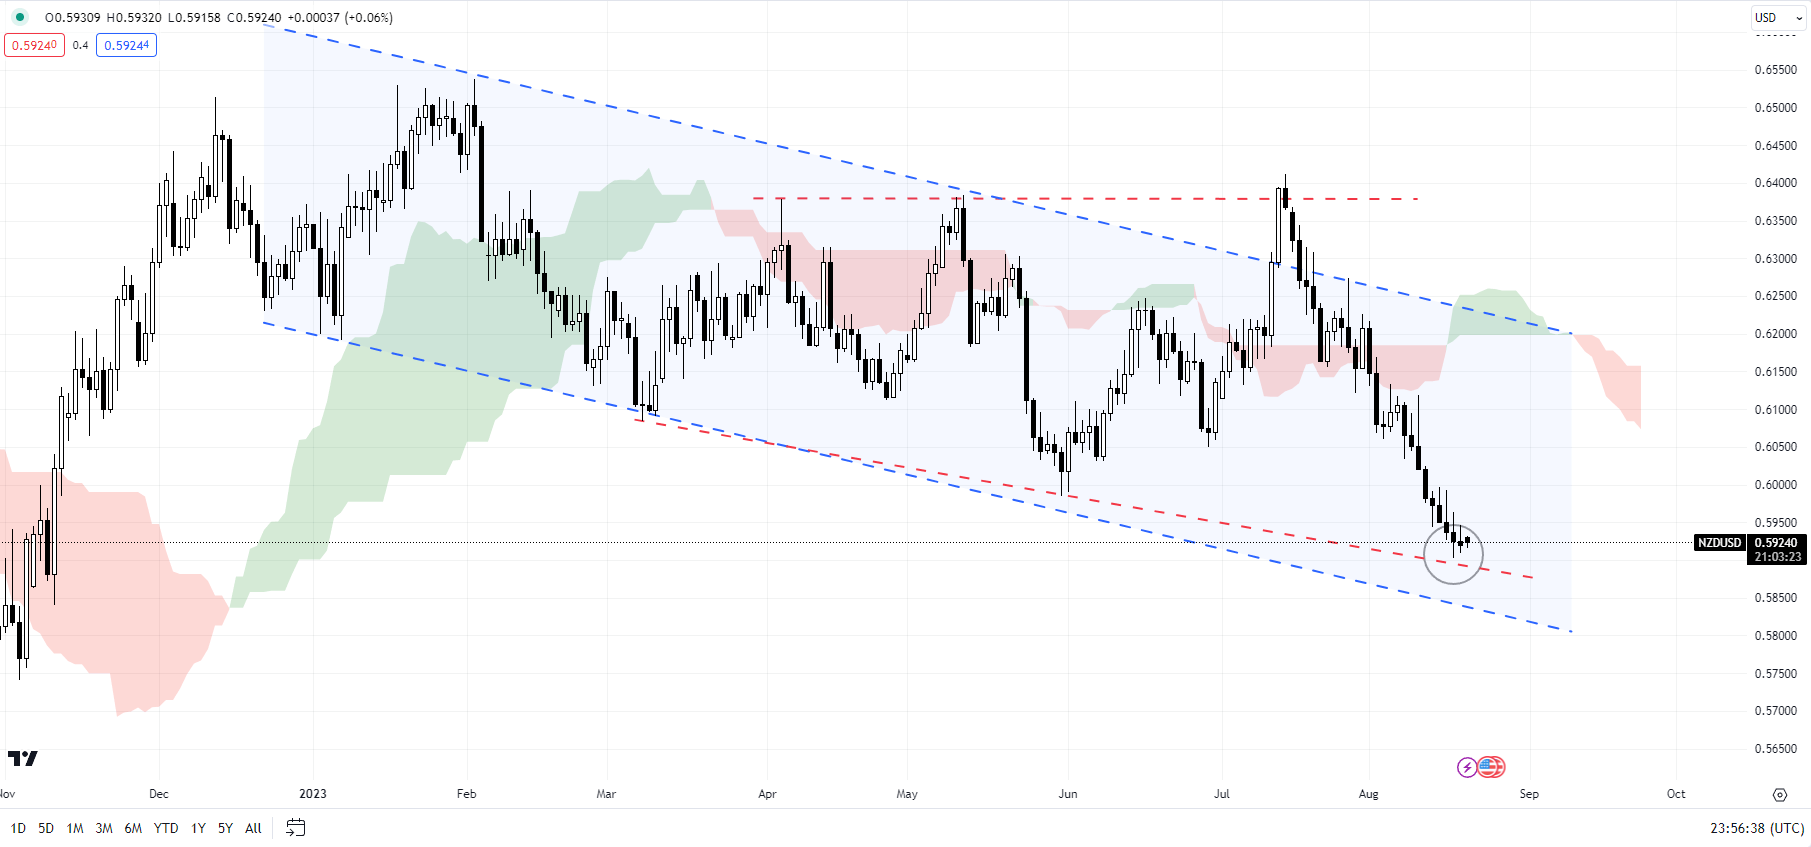
On technical charts, NZD/USD looks oversold as it tests support on a downtrend line from March, slightly above the bottom end of a downtrend channel from the beginning of the year. There is no sign of reversal yet, and NZD/USD would need to rise above the end-June low of 0.6050 for the immediate downward pressure to ease.

GBP/NZD Monthly Chart

image2.png

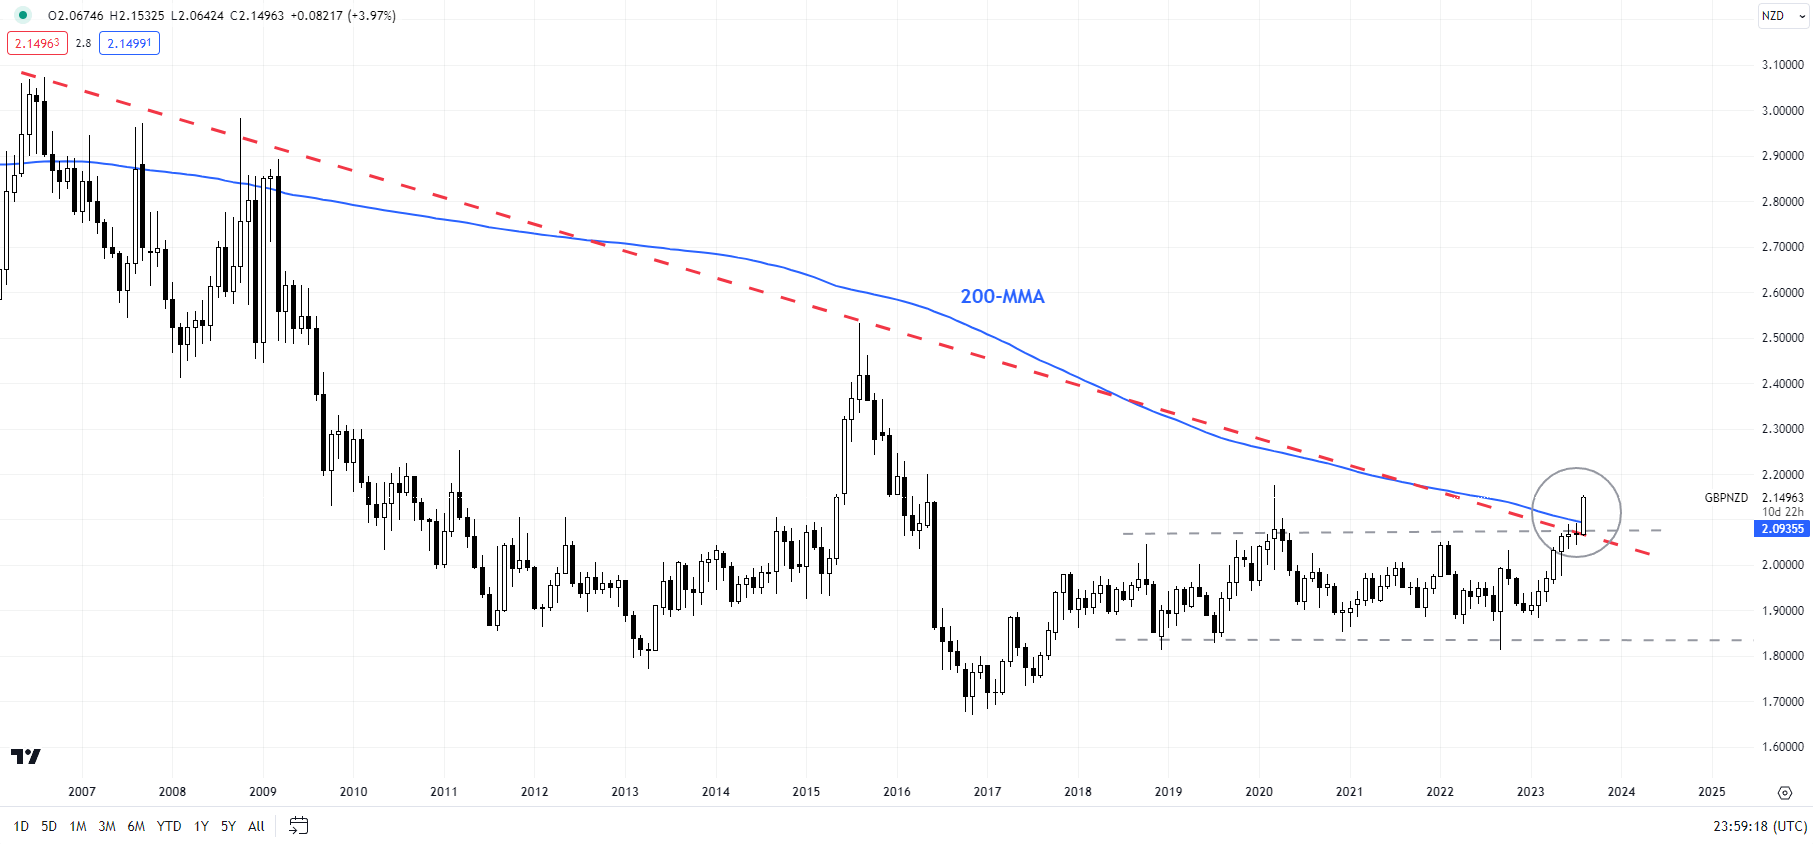
GBP/NZD: Testing a tough barrier

GBP/NZD is testing a key converged hurdle at 2.10-2.20, including the 200-month moving average, coinciding with a downtrend line from 2007, and the 2020 high of 2.18. This resistance is very important, and a decisive break above could clear the path toward the 2015 high of 2.46.

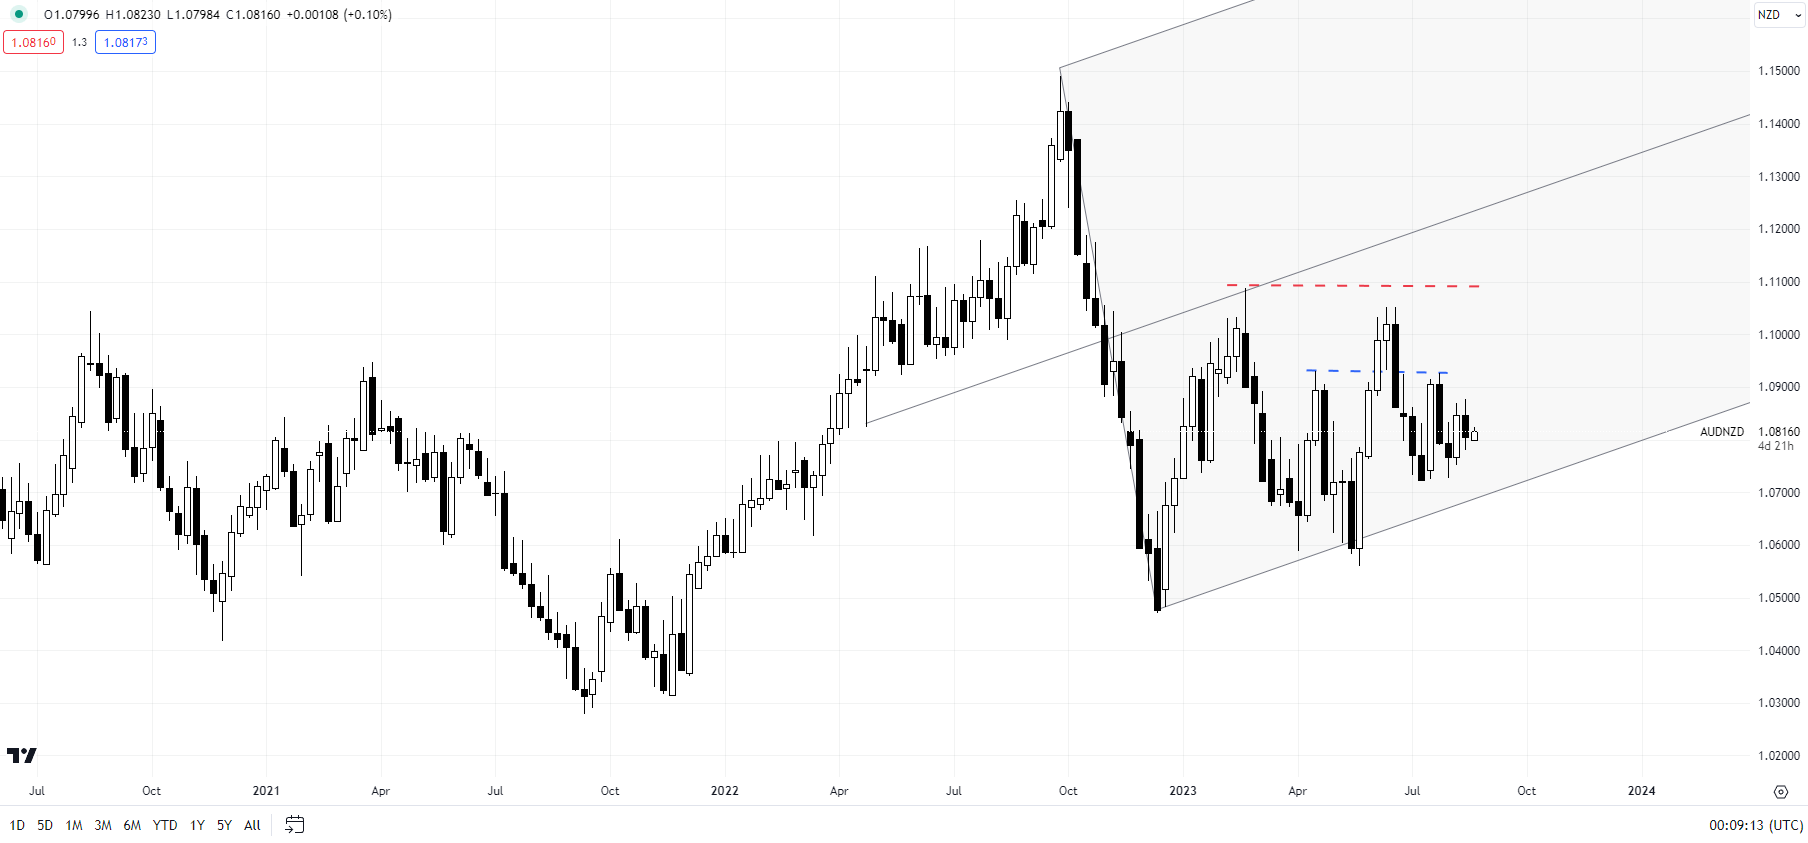
AUD/NZD Weekly Chart

image3.png

Euro Steadies as Hang Seng Tanks on PBOC’s Shallow Cut. Lower EUR/USD?

Euro Steadies as Hang Seng Tanks on PBOC’s Shallow Cut. Lower EUR/USD?

The Euro steadied to start the week as it pauses in its recent run lower on the back of the US Dollar regaining its ascendency this month. Most of the other major currency pairs have also had a slow Monday so far.

The Federal Reserve meeting minutes for the July gathering opened the door to a potential hike in the target rate going into the end of the year.

Later this week the Kansas City Fed will host its annual Jackson Hole Economic Symposium.

For the near term, the market will be looking for clues on the September Federal Open Market Committee (FOMC) rate decision.

The podium at this event also lends itself for notable adjustments in the bigger picture for the Fed. As a result, Fed Chair Jerome Powell’s speech will be closely watched by the market this Friday.

The People’s Bank of China (PBOC) eased monetary policy today by 15 basis points (bp) for the 1- and 5-year loan prime rate. They ended up moving the 1-rate by only 10 bp to 3.45% and kept the 5-year rate unchanged at 4.20%.

Earlier today the People’s Bank of China (PBOC) eases monetary policy, moving the 1-year loan prime rate by only 10 basis points to 3.45% and kept the 5-year rate unchanged at 4.20%. The market had been anticipating a 15 bp cut for both instruments.

Hong Kong’s Hang Seng Index (HSI) plunged on the news, trading more than 1.8% at one stage. Other APAC equity indices are generally, except for Japan, that saw modest gains.

Crude oil has found firming footing with the WTI futures contract is nearing US$ 82 bbl while the Brent contract is a touch above US$ 85 bbl. Spot gold remains below US$ 1,900 and has been oscillating around US$ 1,890 today.

Looking ahead, the US will see some existing home sales adata and a number of Fed speakers will be crossing the wires.

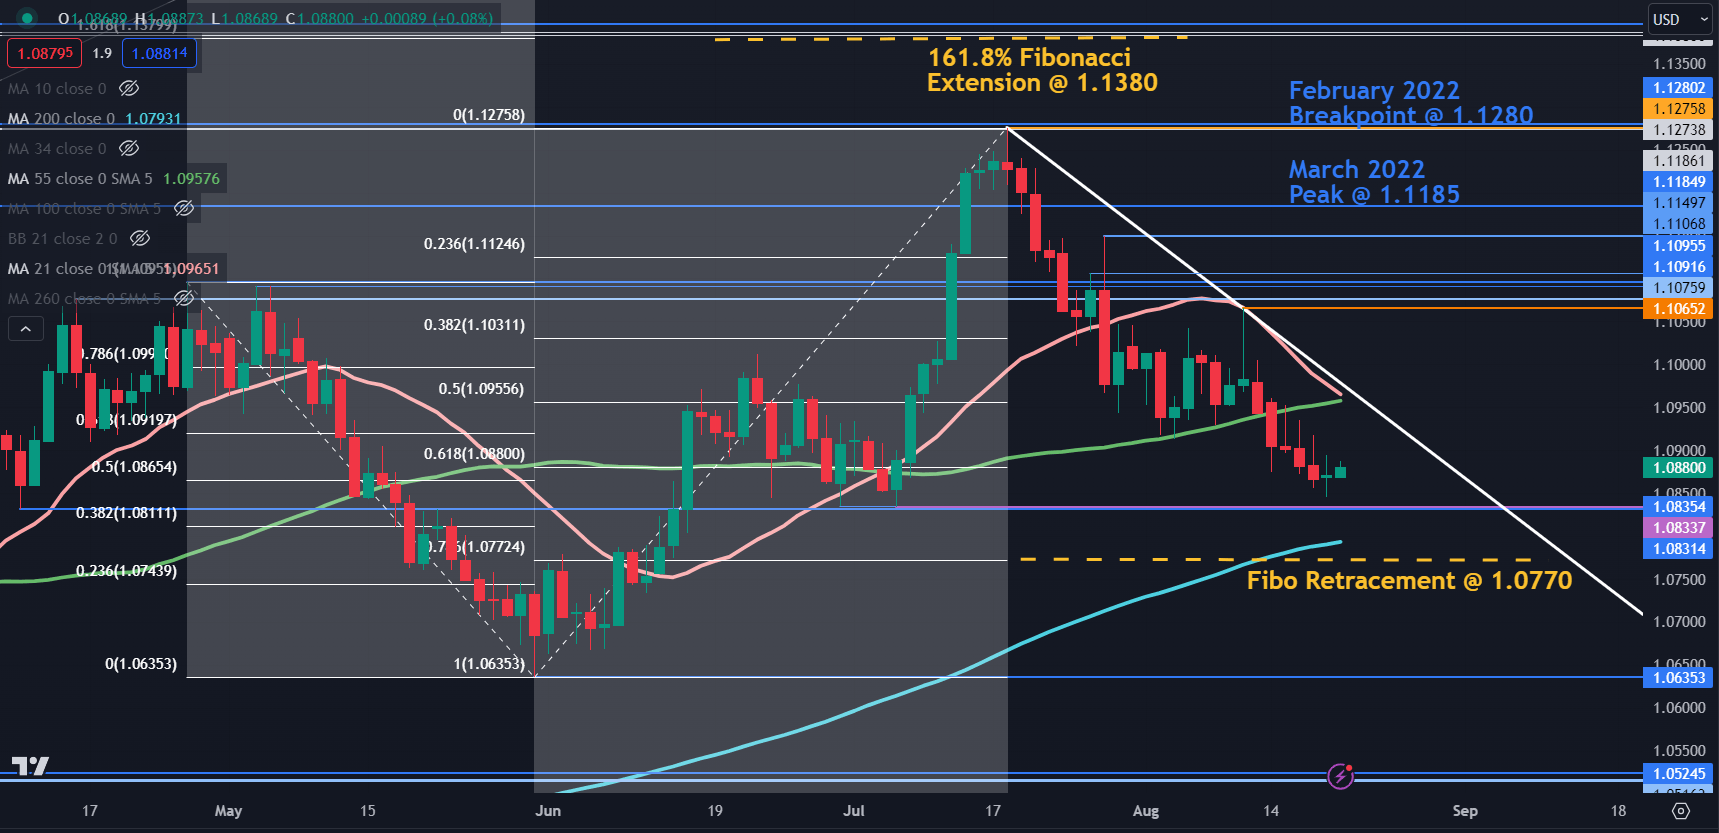
EUR/USD DAILY TECHNICAL ANALYSIS SNAPSHOT

EUR/USD remains below a descending trend line but has stalled in its bearish run just above a potential support zone in the 1.0830 – 1.0835 area where there are some breakpoints and prior lows.

Support could also be near the 78.6% Fibonacci Retracement levels at 1.0770 which is just above the 200-day simple moving averages (SMA).

Ahead of that level, some prior lows and the breakpoint in the 10830- 1.0835 area may provide support.

If EUR/USD was to rally and approach the descending trend line, there could be resistance at the 21- and 55-day SMAs just ahead of it.

Potential resistance might also be offered in the 1.1065 – 1.1095 area where several historical breakpoints reside along with a recent high and just ahead of the psychological level at 1.1100.

Further up, resistance could be at the breakpoint from the March 2022 high at 1.1185 or the recent peak at 1.1275, which coincides with two historical breakpoints.

Above those levels, resistance might be at the Fibonacci Extension of the move from 1.1095 to 1.0635 at 1.1380. Just above there are some more breakpoints in the 1.1385 – 95 area.

To learn more about trend trading, click on the banner below.

image1.png