AUD Price Forecast: No Respite for Aussie after Reserved China Rate Cut

AUD Price Forecast: No Respite for Aussie after Reserved China Rate Cut

AUSTRALIAN DOLLAR FUNDAMENTAL BACKDROP

The Australian dollar is trading at extreme levels this Monday as the PBoC decided to modestly reduce interest rates (see economic calendar below) on the 1-year LPR while keeping the 5-year rate on hold. This unexpected outcome resulted in the pro-growth AUD weaker against the US dollar despite the DXY marginally lower for the day.

Pricing today across FX markets are relatively subdued with investor uncertainty increasing due to key upcoming risk events including the BRICS summer and Jackson Hole Economic Symposium. With Jackson Hole being the focal point as Fed Chair Jerome Powell could alter the current ‘higher for longer’ narrative, potentially providing some support for the fading Aussie dollar.

AUD/USD ECONOMIC CALENDAR (GMT +02:00)

image1.png

Looking at money market pricing for the Reserve Bank of Australia (RBA) below, expectations for a rate cut does not look to be priced in for 2023 or 2024 unlike the Fed who is forecasted to cut around May of 2024. Should Fed Chair Jerome Powell push a more accommodative stance this week, this interest rate differential may further augment any AUD upside.

RBA INTEREST RATE PROBABILITIES

image2.png

TECHNICAL ANALYSIS

AUD/USD DAILY CHART

image3.png

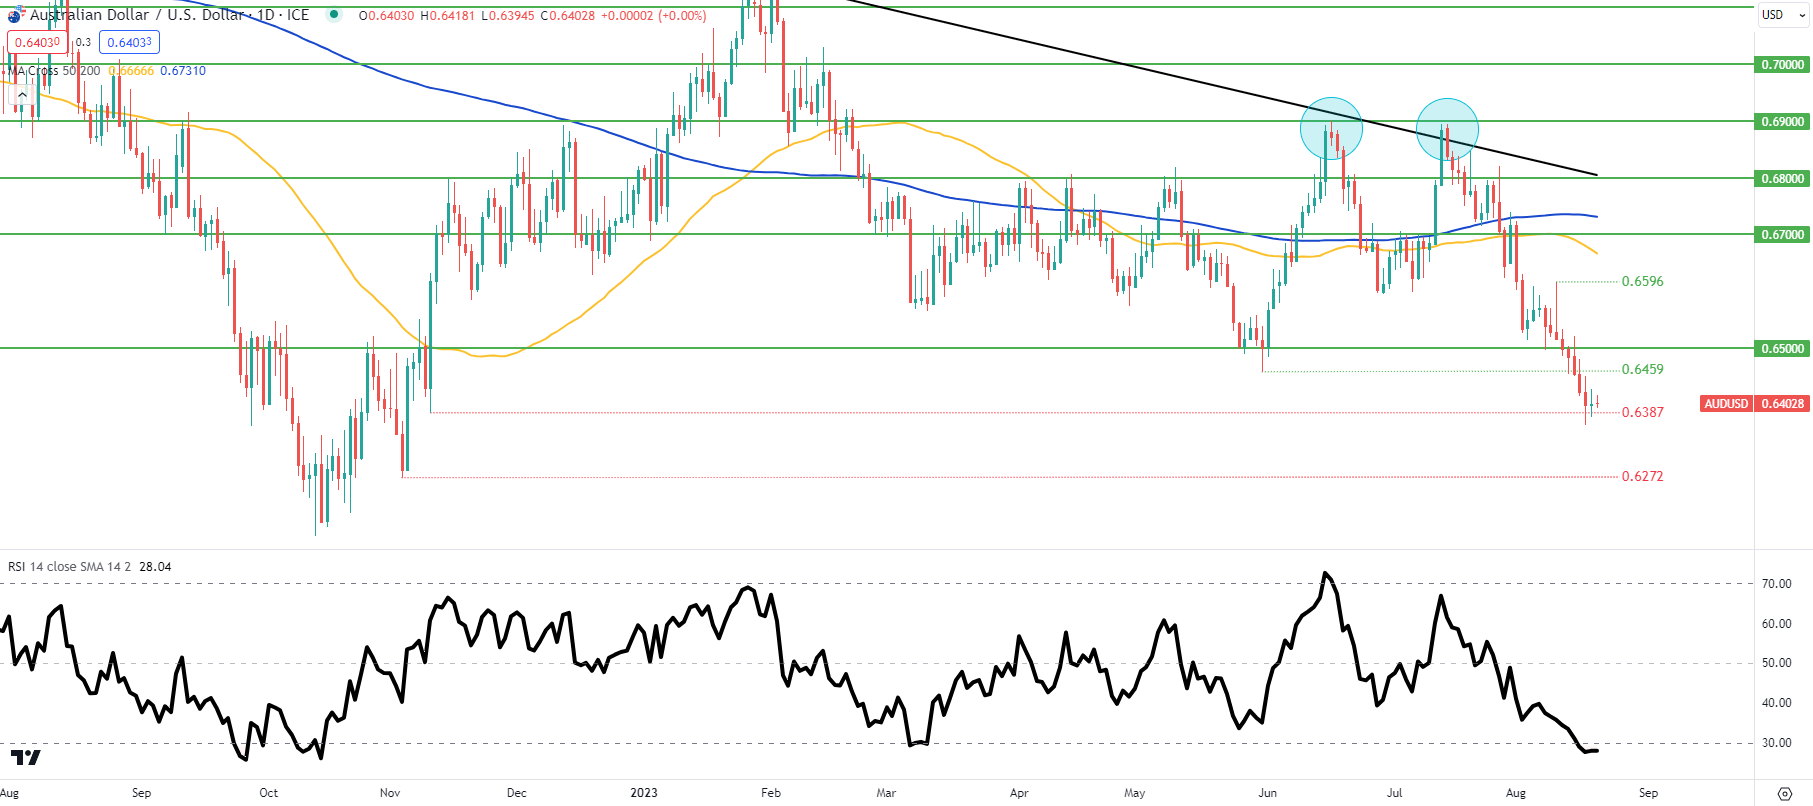
Daily AUD/USD price action continues to hover around the 0.6387 swing support and a daily confirmation candle close could spark another leg lower towards the November 2022 low at 0.6272. That being said, the Relative Strength Index (RSI) is now in oversold territory and could indicate a possible end to the recent downtrend although moving against the prevailing trend carries a high degree of risk.

Investors may want to wait for the fundamental drivers to take place before entering the market as Jackson Hole traditionally carries significant price swings. Trader hesitancy has already commenced with the latest slew of doji candlesticks that could point to a pause before a resumption of the downtrend or a shift.

Key resistance levels:

  • 0.6596
  • 0.6500
  • 0.6495

Key support levels:

  • 0.6387
  • 0.6272

IG CLIENT SENTIMENT DATA: BULLISH (AUD/USD)

IGCS shows retail traders are currently net LONG on AUD/USD, with 81% of traders currently holding long positions. Download the latest sentiment guide (below) to see how daily and weekly positional changes affect AUD/USD sentiment and outlook.

Forex Candlesticks: A Complete Guide for Forex Traders

Forex Candlesticks: A Complete Guide for Forex Traders

What could possibly be more important to a technical forex trader than price charts? Forex charts are defaulted with candlesticks which differ greatly from the more traditional bar chart and the more exotic renko charts. These forex candlestick charts help to inform an FX trader’s perception of price movements – and therefore shape opinions of trends, determine entries, and more.

All currency traders should be knowledgeable of forex candlesticks and what they indicate. After learning how to analyze forex candlesticks, traders often find they can identify many different types of price action far more efficiently, compared to using other charts. The added advantage of forex candlestick analysis is that the same method applies to candlestick charts for all financial markets.

Individual candlesticks often combine to form recognizable patterns. Test your knowledge with our forex trading patterns quiz!

Forex candlesticks explained

There are three specific points that create a candlestick, the open, the close, and the wicks. The candle will turn green/blue (the color depends on the chart settings) if the close price is above the open. The candle will turn red if the close price is below the open.

If you have the chart on a daily setting each candle represents one day, with the open price being the first price traded for the day and the close price being the last price traded for the day.

  • Open price: The open price depicts the first traded price during the formation of a new candle.
  • High price: The top of the upper wick. If there is no upper wick, then the high price is the open price of a bearish candle or the closing price of a bullish candle.
  • Low price: The bottom of the lower wick. If there is no lower wick, then the low price is the open price of a bullish candle or the closing price of a bearish candle.
  • Close price: The close price is the last price traded during the formation of the candle.

The image below shows a blue candle with a close price above the open and a red candle with the close below the open.
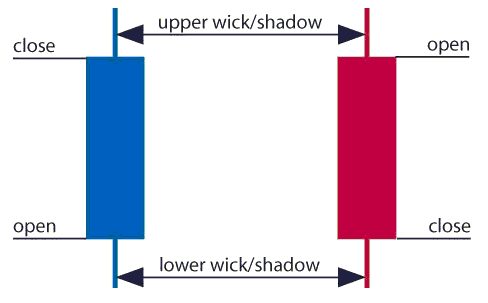
A blue and red candlestick showing open and close wicks

See our page on How to Read a Candlestick Chart for a more in depth look at candlestick charts

Why forex traders tend to use candlestick charts rather than traditional charts

Candlestick charts are the most popular charts among forex traders because they are more visual. Candlestick charts highlight the open and the close of different time periods more distinctly than other charts, like the bar chart or line chart.

Candlestick charts have certain advantages:

  • Forex price movements are perceived more easily on candlestick charts compared to others.
  • It is easier to recognize price patterns and price action on candlestick charts.
  • Candlestick charts offer more information in terms of price (open, close, high and low) than line charts.

However, there are some disadvantages of candlestick charts:

  • Candles that close green or red may mislead amateur forex traders into thinking that the market will keep moving in the direction of the previous closing candle.
  • Candlestick charts may clutter a page because they are not a simple as line charts or bar charts.

How to trade forex using candlestick charts

Candlestick formations and price patterns are used by traders as entry and exit points in the market. Forex candlesticks individually form candle formations, like the hanging man, hammer, shooting star, and more. Forex candlestick charts also form various price patterns like triangles, wedges, and head and shoulders patterns.

While these patterns and candle formations are prevalent throughout forex charts they also work with other markets, like equities (stocks) and cryptocurrencies.

Trading forex using candle formations:

The hanging man:

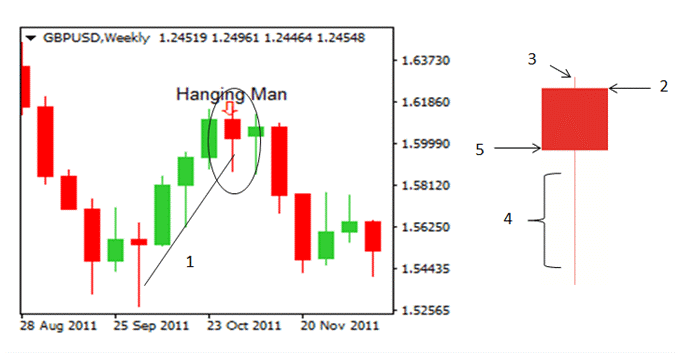
The hanging man candle, is a candlestick formation that reveals a sharp increase in selling pressure at the height of an uptrend. It is characterized by a long lower wick, a short upper wick, a small body and a close below the open.

It is a bearish signal that the market is going to continue in a downward trend. Learning to recognize the hanging man candle and other candle formations is a good way to learn some of the entry and exit signals that are prominent when using candlestick charts.

The chart below shows the GBP/USD on a weekly timeframe. This means that each candle depicts the open price, closing price, high and low of a single week. The hanging man candle below (circled) is a bearish signal. Traders use bearish signals like this to enter short trades, a bet on the GBP depreciating relative to the USD.

If a trader uses the hanging man to execute a short trade, he/she should then place a stop loss and a take profit with a positive risk-reward ratio.
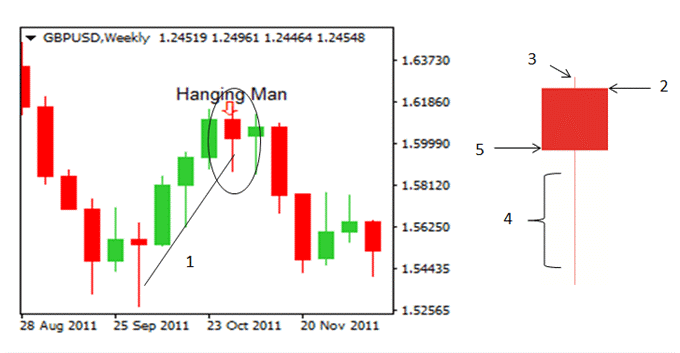
Hanging man chart pattern showing stop

The Shooting Star

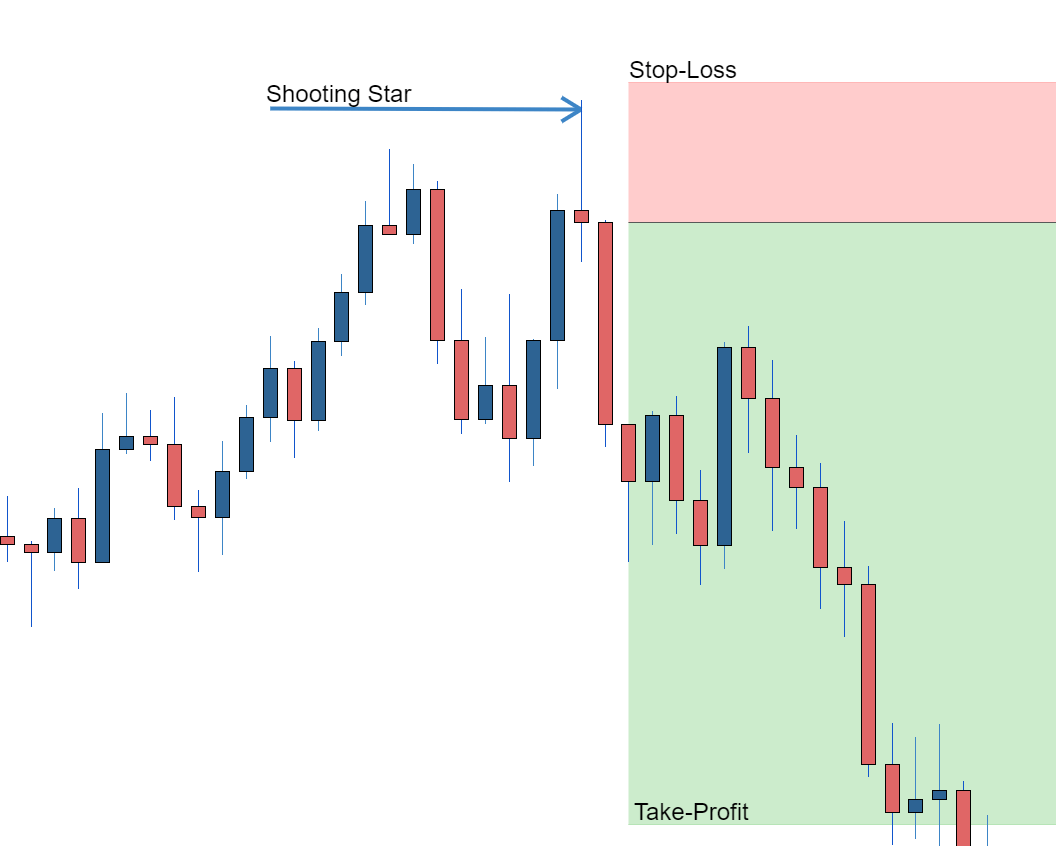
A shooting star candle formation, like the hang man, is a bearish reversal candle that consists of a wick that is at least half of the candle length. The long wick shows that the sellers are outweighing the buyers. A shooting star would be an example of a short entry into the market, or a long exit.

Traders could take advantage of the shooting star candle by executing a short trade after the shooting star candle has closed. Traders could then place a stop loss above the shooting star candle and target a previous support level or a price that ensures a positive risk-reward ratio. A positive risk-reward ratio has been shown to be a trait of successful traders.

Chart showing shooting star candlestick pattern

The Hammer

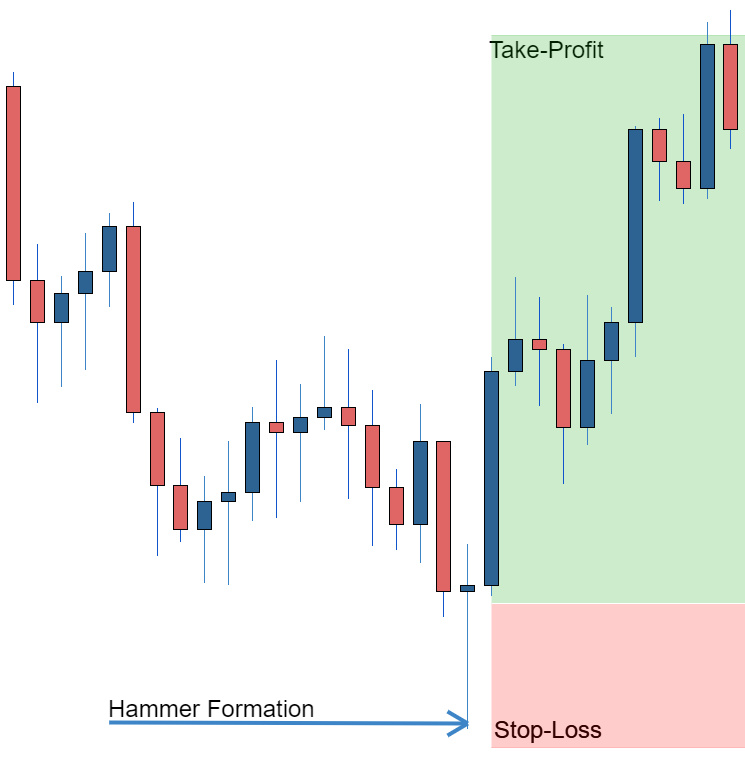
The hammer candle formation is essentially the shootings stars opposite. It is a bullish reversal candle that signals that the bulls are starting to outweigh the bears. It is characterized by its long wick and small body. A hammer would be used by traders as a long entry into the market or a short exit.

The image below is an example of how a forex trader would use the hammer candle formation to enter a long trade, while placing a stop-loss below the hammer candle and a take profit at a high enough level to ensure a positive risk-reward ratio.
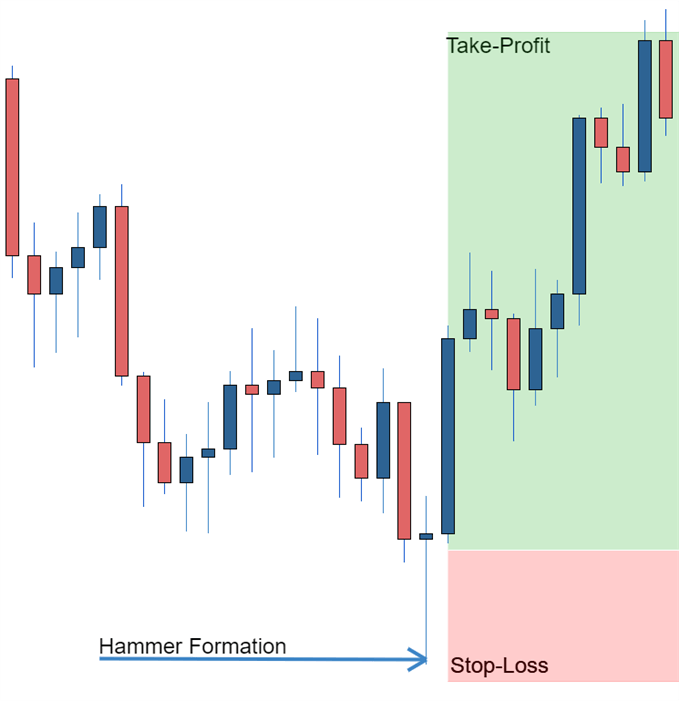
Chart showing hammer formation with stop loss

Take your forex trading to the next level

Supplement your understanding of forex candlesticks with one of our free forex trading guides. Our experts have also put together a range of trading forecasts which cover major currencies, oil, gold and even equities.

USD to CAD Prices Forecast: Mixed Trade Ahead of Canadian Producer Inflation Data

USD to CAD Prices Forecast: Mixed Trade Ahead of Canadian Producer Inflation Data

USD/CAD’s Dance with Treasury Yields and Key Exports

The USD to CAD is retreating from its recent peak on Friday, yet it’s on track for its fifth consecutive weekly gain. The U.S. Dollar’s volatile movements are being influenced mainly by the fluctuations in U.S. Treasury yields. These yields have dipped as market players ponder over the country’s economic future, closely watching inflation trends and potential shifts in the Federal Reserve’s monetary policies.

Canadian Exports and the Greenback’s Weight

Apart from the U.S. Dollar’s sway, traders are closely monitoring Canada’s primary exports: crude oil and gold. Since both commodities are priced in dollars, the strength of the greenback plays a pivotal role in shaping international demand for these resources.

Trading Derivatives carries a high level of risk to your capital and you should only trade with money you can afford to lose. Trading Derivatives may not be suitable for all investors, so please ensure that you fully understand the risks involved, and seek independent advice if necessary. A Product Disclosure Statement (PDS) can be obtained either from this website or on request from our offices and should be considered before entering into a transaction with us. Raw Spread accounts offer spreads from 0.0 pips with a commission charge of USD $3.50 per 100k traded. Standard account offer spreads from 1 pips with no additional commission charges. Spreads on CFD indices start at 0.4 points. The information on this site is not directed at residents in any country or jurisdiction where such distribution or use would be contrary to local law or regulation.

Economic Reports: A Close Watch on Domestic Inflation

While the U.S. economic calendar remains relatively light for Friday, the ripple effects of this week’s robust data and the Fed’s hawkish stance are palpable. Canada is releasing its IPPI and RMPI reports today, both critical indicators of inflation. The expected increase in these figures could hint at a consistent stance on interest rates by the Bank of Canada, particularly if they outpace expectations.

Federal Reserve’s Inflation Concerns

The minutes from the Federal Reserve’s recent gathering underscored the majority’s concerns about mounting inflation risks, hinting at more potential rate hikes. This week’s hearty retail sales figures further strengthened the case for this tightening stance.

Short-Term Outlook: Bullish

Recent spikes in 10-year Treasury yields to 4.328% and resilient economic reports have supported the U.S. dollar’s strength. Market players might wish for the Fed to pause, but current data seems to be guiding it otherwise, thus bolstering the U.S. dollar’s position in the short term.

Technical Analysis

4-Hour USD to CADThe USD to CAD is currently positioned at 1.3542, showing no change from its previous 4-hour position. This indicates a potential consolidation phase. It trades above the 200-4H moving average of 1.3297, signaling a longer-term bullish momentum. Conversely, it’s slightly above the 50-4H moving average of 1.3469, supporting the idea of an ongoing bullish sentiment in the shorter term. The 14-4H RSI, standing at 62.37, reinforces this bullish momentum, being above the neutral 50 but not yet in the overbought territory.

Currently hovering between the main support area of 1.3142 to 1.3118 and the main resistance zone of 1.3612 to 1.3654, the currency pair shows an overall bullish sentiment, but traders should remain vigilant as it approaches resistance levels.

Oil Prices Forecast: Seven-Week Rally Teeters Amid Global Financial Shifts

Oil Prices Forecast: Seven-Week Rally Teeters Amid Global Financial Shifts

Oil Prices Waver Amid Economic Uncertainties and Tightening Supply

Oil prices, having ridden a seven-week high, appear ready to relinquish their gains as China’s economic slowdown and potential U.S. interest rate hikes counterbalance tightening supply cues. This rally, the longest of the year for both Brent and WTI benchmarks, saw them surging by 18% and 20% respectively.

US Economic Indicators & Oil Prices

Recent U.S. data has been bullish for the economy but has indirectly impacted the oil market. The U.S. Federal Reserve’s commitment to curbing inflation has kept a check on escalating oil prices. Two key indicators – a decline in jobless claims and robust retail sales figures – imply that the Fed might sustain higher interest rates. This might seem positive, but higher borrowing costs could potentially slow economic growth, leading to decreased oil demand.

Trading Derivatives carries a high level of risk to your capital and you should only trade with money you can afford to lose. Trading Derivatives may not be suitable for all investors, so please ensure that you fully understand the risks involved, and seek independent advice if necessary. A Product Disclosure Statement (PDS) can be obtained either from this website or on request from our offices and should be considered before entering into a transaction with us. Raw Spread accounts offer spreads from 0.0 pips with a commission charge of USD $3.50 per 100k traded. Standard account offer spreads from 1 pips with no additional commission charges. Spreads on CFD indices start at 0.4 points. The information on this site is not directed at residents in any country or jurisdiction where such distribution or use would be contrary to local law or regulation.

China’s Role in the Global Oil Landscape

China, being the world’s second-largest oil consumer, significantly influences oil market dynamics. Recent economic reports from the nation indicate a swift deceleration in economic momentum since Q2, especially with the ongoing property crisis unsettling global markets. Yet, in an unexpected move, China tapped into its crude oil reserves in July, marking the first such instance in nearly three years.

Supply & Demand Dynamics

Despite the above uncertainties, several factors are supporting oil prices. OPEC+ production cuts, burgeoning demand due to elevated U.S. travel and industrial activity, and the diminishing U.S. rig count signal a tightening supply. Concurrently, U.S. crude oil inventories dipped by almost 6 million barrels recently, hinting at strong exports and refining activities. This supply squeeze is evident as net-long positions, a bullish bet, touch yearly peaks.
Short-term Forecast

While concerns from the U.S. and China introduce bearish sentiments, the tightening supply primarily driven by OPEC+ interventions and growing U.S. demands suggests a bullish outlook for oil. In the coming days, analysts predict prices might edge upward, especially if the supply continues to constrict and global demand remains robust.

Technical Analysis

4-Hour Crude OilCrude oil, currently priced at $80.00 per 4-hour interval, has recently dipped slightly from its previous $80.04. Positioned between the 200-4H moving average of $78.24 and the 50-4H moving average of $81.96, the commodity hints at a consolidation phase. Its position above the 200-4H MA but below the 50-4H MA implies a tug-of-war between buyers and sellers. The 14-4H RSI stands at 41.37, indicating a somewhat weaker momentum, yet not in the oversold territory.

With main support areas ranging from $79.05 to $78.29 and resistance between $83.81 to $84.89, the oil market appears neutral, but with a slightly bearish tilt due to its proximity to the support zone.

The key area to focus on is the combination of the 200-4H moving average at $78.24 and the lowest support level at $78.29. This support cluster has to hold or prices could collapse over the near-term.

AUD Price Forecast: No Respite for Aussie after Reserved China Rate Cut

AUD to USD Forecast: China’s Woes and Fed’s Hawk Eye Weigh on Australian Dollar

Overview

On Thursday, the AUD/USD fell by 0.32% to wrap up the day at $0.64031. It was another bear trap for the bulls. The Aussie dollar fell to an early session low of $0.63643 before reaching a high of $0.64471. However, a bearish US session left the Australian dollar in negative territory.

China and the Fed Remain Headwinds on a Quiet Friday Session

There are no economic indicators from Australia or China to move the dial this morning. The lack of distraction will leave China’s woes and central banks in the spotlight.

Trading Derivatives carries a high level of risk to your capital and you should only trade with money you can afford to lose. Trading Derivatives may not be suitable for all investors, so please ensure that you fully understand the risks involved, and seek independent advice if necessary. A Product Disclosure Statement (PDS) can be obtained either from this website or on request from our offices and should be considered before entering into a transaction with us. Raw Spread accounts offer spreads from 0.0 pips with a commission charge of USD $3.50 per 100k traded. Standard account offer spreads from 1 pips with no additional commission charges. Spreads on CFD indices start at 0.4 points. The information on this site is not directed at residents in any country or jurisdiction where such distribution or use would be contrary to local law or regulation.

While the PBoC attempts to boost growth, the latest Australian employment and wage growth numbers support an RBA hold. In contrast, US economic indicators and FOMC meeting minutes point to a Fed rate hike.

The combination is a bearish price scenario for the Aussie dollar. Commodities are more expensive with a stronger dollar, raising demand concerns. China’s economic turmoil and contagion risk add to the weak demand outlook.

While there are no economic indicators, investors should monitor the news wires for stimulus-related chatter from Beijing that would ease the selling pressure.

Quiet US Economic Calendar Leaves Fed Chatter in Focus

The US economic calendar is on the light side on Friday. There are no US economic indicators for investors to consider. The lack of US economic indicators will leave Fed monetary policy in the spotlight.

US retail sales, inflation, and labor market conditions continue to support a more aggressive interest rate trajectory to bring inflation to target. With the FOMC meeting minutes revealing an openness to more tightening, we expect AUD/USD sensitivity to Fed chatter.

Hawkish Fed commentary would support the shift in sentiment toward monetary policy divergence in favor of the dollar.

AUD/USD Price Action

Daily Chart

The Daily Chart showed the AUD/USD hover below the $0.6430 – $0.6450 resistance band. Significantly, the Aussie remained below the 50-day and 200-day EMAs, sending bearish near and longer-term price signals.

Looking at the 14-Daily RSI, 27.87 shows the AUD/USD in oversold territory. However, the RSI aligns with the EMAs, signaling a fall to sub-$0.6350 to bring the $0.6340 – $0.6320 support band into play. Avoiding sub-$0.6350 would support a move through the $0.6430 – $0.6450 resistance band to target the Thursday high of $0.64507.

AUD to USD Daily Chart sends bearish price signals.
AUDUSD 180823 Daily Chart

4-Hourly Chart

Looking at the 4-Hourly Chart, the AUD/USD remains below the $0.6430 – $0.6450 resistance band. Significantly, the AUD/USD sits below the 50-day and 200-day EMAs, sending bearish near and longer-term price signals.

Looking at the 14-4-Houly RSI, 36.58 affirms the bearish sentiment, with selling pressure overweighing buying pressure. The RSI is aligned with the EMAs supporting a fall to sub-$0.6350 to give the bears a run at the $0.6340 – $0.6320 support band. However, a move through the lower level of the $0.6430 – $0.6450 resistance band would bring the Thursday high of $0.64507 into play.

Price action today is hinged on central bank commentary.

4-Hourly Chart affirms bearish price signals.
AUDUSD 180823 4-Hourly Chart
EUR/USD Forecast: Inflation Pressure Puts ECB in Tight Spot, EUR to USD Suffers

EUR/USD Forecast: Inflation Pressure Puts ECB in Tight Spot, EUR to USD Suffers

Overview

The EUR/USD slipped by 0.07% to wrap up the day at $1.08720 on Thursday. A bullish morning session saw the EUR/USD strike a midday high of $1.09183. However, US economic indicators and hawkish Fed bets sent the EUR/USD to a late low of $1.08563 before steadying.

Eurozone Inflation Numbers to Draw ECB Scrutiny

It is a relatively busy morning on the European economic calendar. Finalized Eurozone inflation numbers for July will influence ECB sentiment. ECB Executive Board members remain focused on core inflation, which continued to defy gravity.

Trading Derivatives carries a high level of risk to your capital and you should only trade with money you can afford to lose. Trading Derivatives may not be suitable for all investors, so please ensure that you fully understand the risks involved, and seek independent advice if necessary. A Product Disclosure Statement (PDS) can be obtained either from this website or on request from our offices and should be considered before entering into a transaction with us. Raw Spread accounts offer spreads from 0.0 pips with a commission charge of USD $3.50 per 100k traded. Standard account offer spreads from 1 pips with no additional commission charges. Spreads on CFD indices start at 0.4 points. The information on this site is not directed at residents in any country or jurisdiction where such distribution or use would be contrary to local law or regulation.

According to prelim figures, the Eurozone annual core inflation rate stayed at 5.5% in July. Revisions to the prelim core inflation figure will move the dial. However, investors should also consider the headline number. According to prelim numbers, the annual inflation rate softened from 5.5% to 5.3% in July.

Inflation remains elevated, leaving the ECB under pressure to tighten monetary policy further to bring inflation to target. Higher interest rates reduce spending power, leading to a fall in spending, easing demand-driven inflationary pressures.

With inflation still the hot topic among central bankers, ECB Chief Economist Philip Lane will speak today, delivering an ECB Podcast on the role of banks in fighting inflation. We expect EUR/USD sensitivity to comments relating to the finalized inflation figures and ECB monetary policy goals to tame inflation.

Hawkish FOMC Member Chatter Would Tip the Scales in Favor of the Fed

After a busy week on the US economic calendar, there are no US economic indicators to consider this afternoon.

However, the latest US retail sales, Jobless Claims, and Philly Fed Manufacturing Index numbers support a more hawkish Fed monetary policy outlook. When considering the FOMC meeting minutes, hawkish FOMC member comments would raise the bets on a September Fed rate hike.

In contrast, the ECB remains data dependent, with the euro area macroeconomic backdrop a factor to consider while the US economy runs hot. Monetary policy and economic divergence continue to favor the dollar, leaving the EUR/USD at risk of sub-$1.08.

EUR/USD Price Action

Daily Chart

The Daily Chart showed the EUR/USD remain above the lower level of the 1.0900 – $1.0850 support band. After a bearish Thursday, the EUR/USD sat below the 50-day EMA while holding above the 200-day EMA, sending bearish near-term but bullish longer-term price signals.

A EUR/USD move through the upper level of the $1.0850 – $1.0900 support band would give the bulls a run at the 50-day EMA. However, failure to move through the 50-day EMA would leave the lower level of the $1.0900 – 1.0850 support band and 200-day EMA in play.

Looking at the 14-Daily RSI, the 39.03 reading reflects bearish sentiment. The RSI aligns with the 50-day EMA, signaling a fall through the $1.0900 – 1.0850 support band to target the 200-day EMA and $1.08.

EUR/USD Daily Chart sends bearish near-term price signals.
EURUSD 180823 Daily Chart

4-Hourly Chart

Looking at the 4-Hourly Chart, the EUR/USD sits below the upper level of the $1.0900 – $1.0850 support band. The EUR/USD also sits below the 50-day and 200-day EMAs, affirming bearish near-term price signals.

The 14-4H RSI at 43.30 reflects bearish sentiment, with selling pressure outweighing buying pressure. Significantly, the RSI suggests further losses and a fall through the lower level of the $1.0900 – $1.0850 support band to target $1.08.

Price action today hinges on the euro area inflation figures and central bank speeches.

4-Hourly Chart affirms bearish near-term price signals on hawkish Fed bets.
EURUSD 180823 4 Hourly Chart
Silver Prices Forecast: XAG/USD Resilient but Remains on Shaky Ground

Silver Prices Forecast: XAG/USD Resilient but Remains on Shaky Ground

Silver’s Fate Amidst Market Turbulence

Silver (XAG/USD) prices are on the rise this Friday, shaking off their multi-month lows, as the U.S. dollar and bond yields take a dip. Despite this, silver is gearing up for its fourth weekly decline, a result of heightened concerns over the Federal Reserve’s prolonged high-interest rate stance.

Federal Reserve’s Stance & Market Dynamics

The Federal Reserve’s commitment to keeping interest rates elevated has been fueling market dynamics. Recent data showcases a solid U.S. economy, which intensifies the likelihood of the Fed hiking rates once more this year. The release of minutes from the Fed’s July assembly revealed that officials are torn over the necessity for additional hikes. With most members focusing on inflation control, the debate over economic risks remains intense. Investors are now poised for Fed Chair Jerome Powell’s forthcoming address on the economic perspective scheduled for Aug. 25.

Trading Derivatives carries a high level of risk to your capital and you should only trade with money you can afford to lose. Trading Derivatives may not be suitable for all investors, so please ensure that you fully understand the risks involved, and seek independent advice if necessary. A Product Disclosure Statement (PDS) can be obtained either from this website or on request from our offices and should be considered before entering into a transaction with us. Raw Spread accounts offer spreads from 0.0 pips with a commission charge of USD $3.50 per 100k traded. Standard account offer spreads from 1 pips with no additional commission charges. Spreads on CFD indices start at 0.4 points. The information on this site is not directed at residents in any country or jurisdiction where such distribution or use would be contrary to local law or regulation.

Global Economic Indicators

On the global front, Japan’s core consumer inflation has slowed, but it has remained above the Bank of Japan’s target for a consistent 16 months. Conversely, in China, Evergrande, a significant property developer grappling with massive debts, is now seeking protection from its creditors in U.S. courts.

Negative Factors Capping Gains

The current scenario presents a dichotomy for silver. Short-term indicators suggest the metal might be oversold. However, from a broader perspective, the market is besieged by a myriad of negative forces, creating a cascading effect that is hard to break. Benchmark 10-year U.S. Treasury yields and the dollar index’s movements also continue to play a pivotal role in determining silver’s allure for international buyers.

Short-Term Forecast

The silver market is weathering a storm, showcasing some tenacity amidst market volatilities. Speculations run high about the Fed’s next move regarding interest rates. Regardless of whether another hike transpires soon, the silver market has felt its impact. Observers believe that any formidable rally for silver might only materialize once the Fed considers slashing rates, potentially around mid-2024.

In essence, silver’s journey is set against a backdrop of global economic shifts and Federal Reserve speculations, making it a precious metal to watch closely in the coming months.

Technical Analysis

4-Hour Silver (XAG/USD)Silver’s current 4-hour price stands at 22.79, slightly below the previous 4-hour close of 22.83, indicating a marginal downtick in the recent timeframe. When we assess the commodity against its moving averages, we find it hovering above the 50-4H moving average of 22.69, suggesting an underlying bullishness. However, it’s below the 200-4H moving average at 23.73, pointing to a broader bearish trend. The 14-4H RSI reads 55.15, indicating a somewhat stronger momentum but still reasonably close to the neutral zone.

The current price is snugly positioned between the main support area (22.70 to 22.28) and just below the main resistance zone (23.60 to 23.85). In summary, while Silver showcases a minor bullish undertone in the short term, the overarching sentiment leans slightly bearish.


Gold Prices Forecast: Global Events Shape XAU/USD’s Vulnerable Landscape

Gold Prices Forecast: Global Events Shape XAU/USD’s Vulnerable Landscape

Gold Prices Edge Higher Amid U.S. Dollar and Bond Yield Declines

Gold prices slightly rebounded on Friday from a series of lows, benefiting from a dip in the U.S. dollar and bond yields. This uptick in the precious metal’s price comes despite looming concerns about the Federal Reserve’s interest rate policies, which have led to its potential fourth straight weekly decline.

Robust US Economy Weighs on Gold Demand

Economic indicators have signaled a robust U.S. economy, raising prospects of another interest rate hike this year by the Federal Reserve. However, Friday’s dip in the dollar index by 0.3% and the benchmark 10-year U.S. Treasury yields from their highest levels since October made gold more attractive to international buyers, at least temporarily.

Trading Derivatives carries a high level of risk to your capital and you should only trade with money you can afford to lose. Trading Derivatives may not be suitable for all investors, so please ensure that you fully understand the risks involved, and seek independent advice if necessary. A Product Disclosure Statement (PDS) can be obtained either from this website or on request from our offices and should be considered before entering into a transaction with us. Raw Spread accounts offer spreads from 0.0 pips with a commission charge of USD $3.50 per 100k traded. Standard account offer spreads from 1 pips with no additional commission charges. Spreads on CFD indices start at 0.4 points. The information on this site is not directed at residents in any country or jurisdiction where such distribution or use would be contrary to local law or regulation.

Fed Divided; Powell Speech Awaited

Minutes from the Federal Reserve’s July meeting highlighted a division among policymakers, with the majority still prioritizing combating inflation. Events like the anticipated speech from Fed Chair Jerome Powell and developments in the U.S. labor market remain in focus, impacting global economic sentiments.

Global Issues Eyed by Gold Traders

Globally, the recent bankruptcy filing by China Evergrande in the U.S. and Japan’s consistent inflation rates offer additional contexts to the broader economic narrative. With all these factors in play, the gold market remains vulnerable and could continue to face challenges unless there’s a significant shift in economic indicators.

Technical Analysis

4-Hour Gold XAUUSDGold’s current 4-hour price at $1893.69 is slightly above its previous close of $1892.24, indicating marginal bullishness. When compared to the 200-4H moving average of $1939.09, the metal’s price is currently below this average, suggesting a bearish sentiment in the short term.

Moreover, it is also trading below the 50-4H moving average of $1910.52, reaffirming the bearish outlook. The 14-4H RSI reading stands at 39.27, slightly below the neutral 50 mark, suggesting weaker momentum. Lastly, the current price is hovering near the main support area, bounded by $1893.07 and $1885.79.

In summation, based on the provided indicators and levels, the gold market appears to lean bearish in the short term although vulnerable to a near-term short-covering rally.

GBP to USD Forecast: Sterling Sways on UK Retail Sales Slide

GBP to USD Forecast: Sterling Sways on UK Retail Sales Slide

Thursday’s Overview

On Thursday, the GBP to USD gained 0.12% to wrap up the day at $1.27462. A choppy start to the day saw the GBP/USD fall to an early low of $1.27024 before striking a midday high of $1.28835. However, US economic indicators dragged the GBP to USD to sub-$1.2730 before finding late support.

UK Retail Sales Give the BoE Reason to Rein in Aggressive Policy Moves

It was a busy start to the European session, with UK retail sales figures for July in focus. The July numbers rounded off a big week for the Pound, leaving the Bank of England under pressure to return inflation to target. UK wage growth, softer but sticky inflation, and UK GDP numbers give the BoE the scope to push higher.

Trading Derivatives carries a high level of risk to your capital and you should only trade with money you can afford to lose. Trading Derivatives may not be suitable for all investors, so please ensure that you fully understand the risks involved, and seek independent advice if necessary. A Product Disclosure Statement (PDS) can be obtained either from this website or on request from our offices and should be considered before entering into a transaction with us. Raw Spread accounts offer spreads from 0.0 pips with a commission charge of USD $3.50 per 100k traded. Standard account offer spreads from 1 pips with no additional commission charges. Spreads on CFD indices start at 0.4 points. The information on this site is not directed at residents in any country or jurisdiction where such distribution or use would be contrary to local law or regulation.


However, retail sales fell by more than expected this morning.

Retail sales fell by 1.2% in July versus a 0.6% increase in June, with core retail sales down 1.4% (June: +0.7%). Year-over-year, retail sales were down 3.2% (June: -1.6%), with core retail sales falling by 3.4% (June: -1.6%).

Economists forecast retail sales to fall by 0.5% in July and core retail sales to decline by 0.7%. Year-over-year, economists expected retail and core retail sales to decrease by 2.1% and 2.2%, respectively.

According to the Office for National Statistics,

  • Food store retail sales tumbled by 2.6% in July. While supermarkets attributed the fall to wet weather conditions, retailers also noted the impact of increased living costs and food prices on sales volumes.
  • Non-food store sales declined by 1.7%, weighed by wet weather conditions.
  • Automotive fuel sales increased by 0.7%, with non-store retail sales rising by 2.8%.
  • Wet weather conditions and promotions fueled online shopping, which surged by 27.4% in July, up from 26.0% in June.

The larger-than-expected decline in retail sales should ease pressure on the Bank of England to aggressively tame inflation. Higher interest rates and the inflation environment have curbed spending, which should ease demand-driven consumer price inflation pressures. However, inflation and wage growth will leave further BoE rate hikes on the table.

GBP to USD sensitivity to the retail sales figures was evident. The GBP/USD rose to a post-stat high of $1.27508 before falling to a low of $1.27254.

GBP to USD slides in response to UK retail sales slump.

GBPUSD 180823 Hourly ChartWhile the UK economic calendar is busier, no Bank of England Monetary Policy Committee Members are on the calendar to speak today. The lack of scheduled speeches will leave BoE commentary with the media to draw interest.

A Day of Reflection and Fed Chatter for the Dollar

There are no US economic indicators for investors to respond to this afternoon. With no economic indicators to consider, FOMC member commentary would need consideration.

The GBP to USD has remained relatively range-bound compared with its peers, with monetary policy bets limiting any material moves. Recent economic indicators from the UK and the US have fueled expectations of more BoE and Fed monetary policy moves to return inflation to target.

Significantly, the latest round of UK economic indicators had also narrowed the economic divergence with the US, which supported the GBP to USD recovery from sub-$1.05 in September, before the latest UK retail sales figures. Today’s retail sales figures should give the dollar the upper hand.

During the US session, FOMC member commentary must align with sentiment toward Fed monetary policy to avoid a GBP to USD rebound. Dovish chatter could see investors rein back hawkish Fed bets while the markets expect the BoE to push forward.

GBP to USD Price Action

Weekly Chart sends mixed signals.

GBPUSD 180823 Weekly Chart

Daily Chart

The Daily Chart showed the GBP to USD sat below the $1.2785 – $1.2862 resistance band. Looking at the EMAs, the GBP to USD fell through the 50-day EMA while holding above the 200-day EMA, sending bearish near-term but bullish longer-term price signals.

Looking at the 14-Daily RSI, 46.98 reflects bearish sentiment. The RSI signals a fall to sub-$1.2650 to bring the $1.2520 – $1.2440 support band into view. However, a GBP to USD move through the 50-day EMA would give the bulls a run at the $1.2785 – $1.2862 resistance band.

GBP to USD Daily Chart sends bearish near-term price signals.

GBPUSD 180823 Daily Chart

4-Hourly Chart

Looking at the 4-Hourly Chart, the GBP to USD hovers below the $1.2785 – $1.2862 resistance band. However, the GBP to USD remains above the 50-day EMA while sitting below the 200-day EMA, sending bullish near-term but bearish longer-term price signals.

The 14-4H RSI reading of 51.18 reflects moderately bullish sentiment, with buying pressure outweighing selling pressure. Significantly, the RSI aligns with the 50-day EMA, signaling a move through the 200-day EMA to target the $1.2785 – $1.2862 resistance band. However, a fall through the 50-day EMA would leave sub-$1.2650 and the $1.2520 – $1.2440 support band in play.

4-Hourly Chart sends mixed price signals.
GBPUSD 180823 4 Hourly Chart
US Indices’ Rally is Cracking: S&P 500, Nasdaq Price Action

US Indices’ Rally is Cracking: S&P 500, Nasdaq Price Action

The upward pressure in the S&P 500 and the Nasdaq 100 index is finally fading — at least for now.

Extreme optimism stretched bullish positioning, and poor seasonality appears to be casting a shadow on the rally in US indices, as highlighted in the previous update. See “US Indices Rally Beginning to Crack? S&P 500, Nasdaq Price Setups,” published August 3. This coupled with higher-for-longer US interest rates and the associated rise in yields/real yields is leading to a reassessment of the potential risk-adjusted returns for the asset class.

S&P 500 240-Minute Chart

image1.png

As last week, equities thrived in an environment of near-zero interest rates and negative real rates. However, the rising cost of capital and positive real rates imply that the hurdle for equities to outperform other asset classes is now higher, especially with valuations above historical averages. See “Is Nasdaq Following Gold’s Footsteps? NDX, XAU/USD Price Setups,” published August 14.

Furthermore, momentum on higher-timeframe charts suggests the rally this year is corrective, rather than the start of a new trend in both, the Nasdaq 100 and the S&P 500 index. For more discussion, see “S&P 500, Nasdaq 100 Forecast: Overly Optimistic Sentiment Poses a Minor Setback Risk,” published July 23.

image2.png

Nasdaq 100: Cracks below support

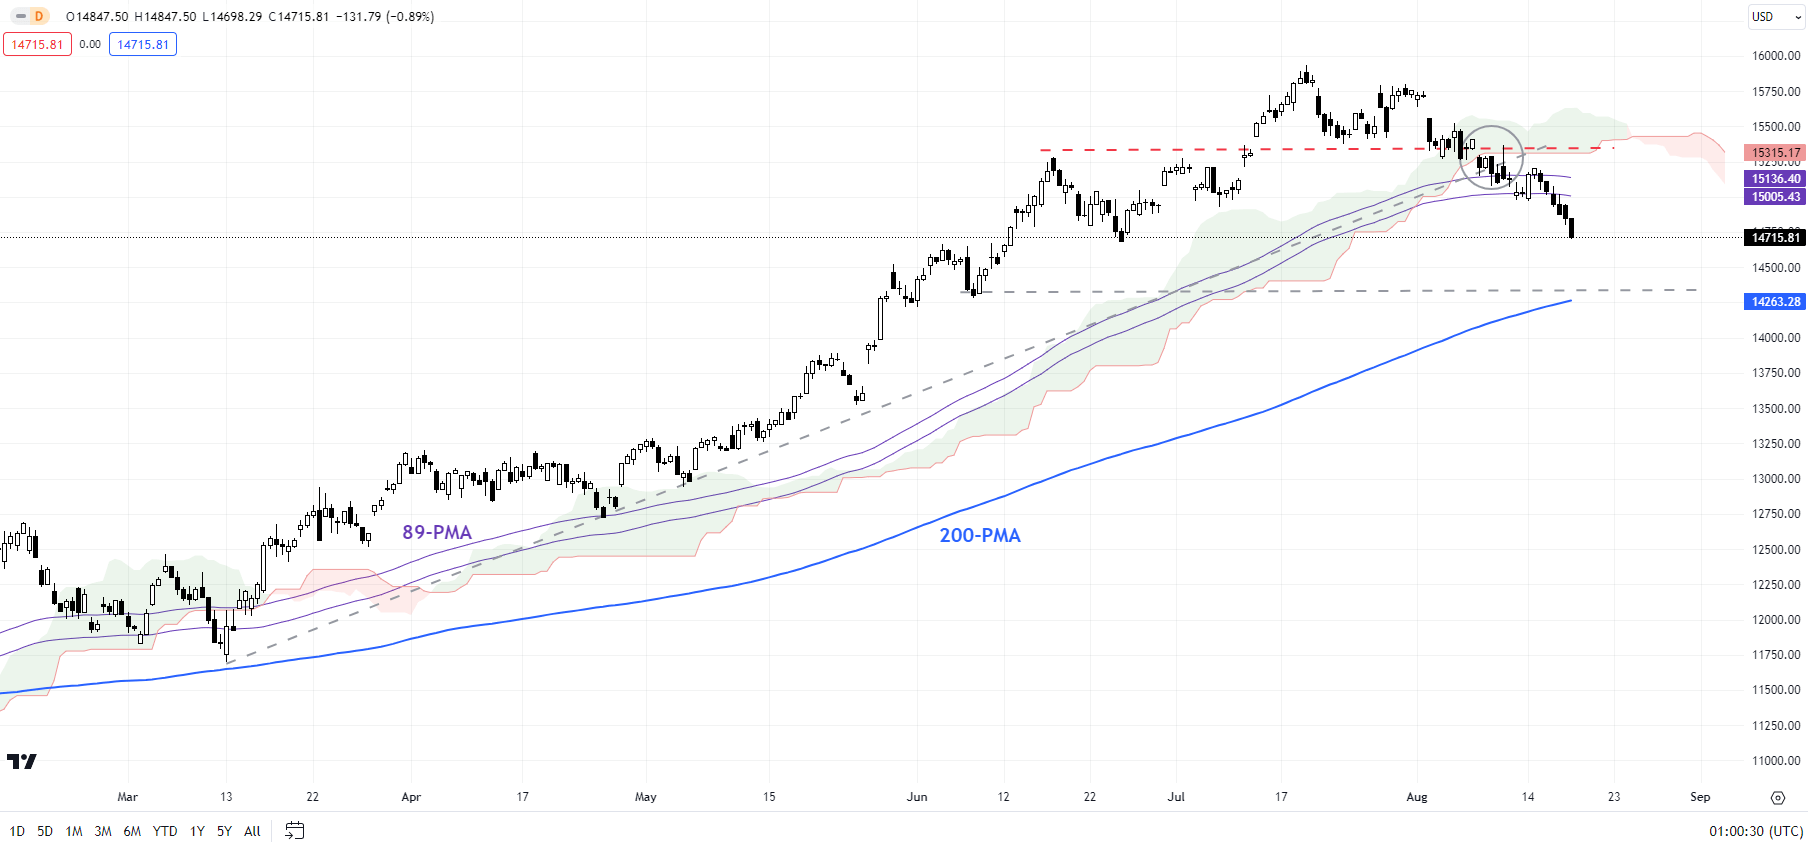
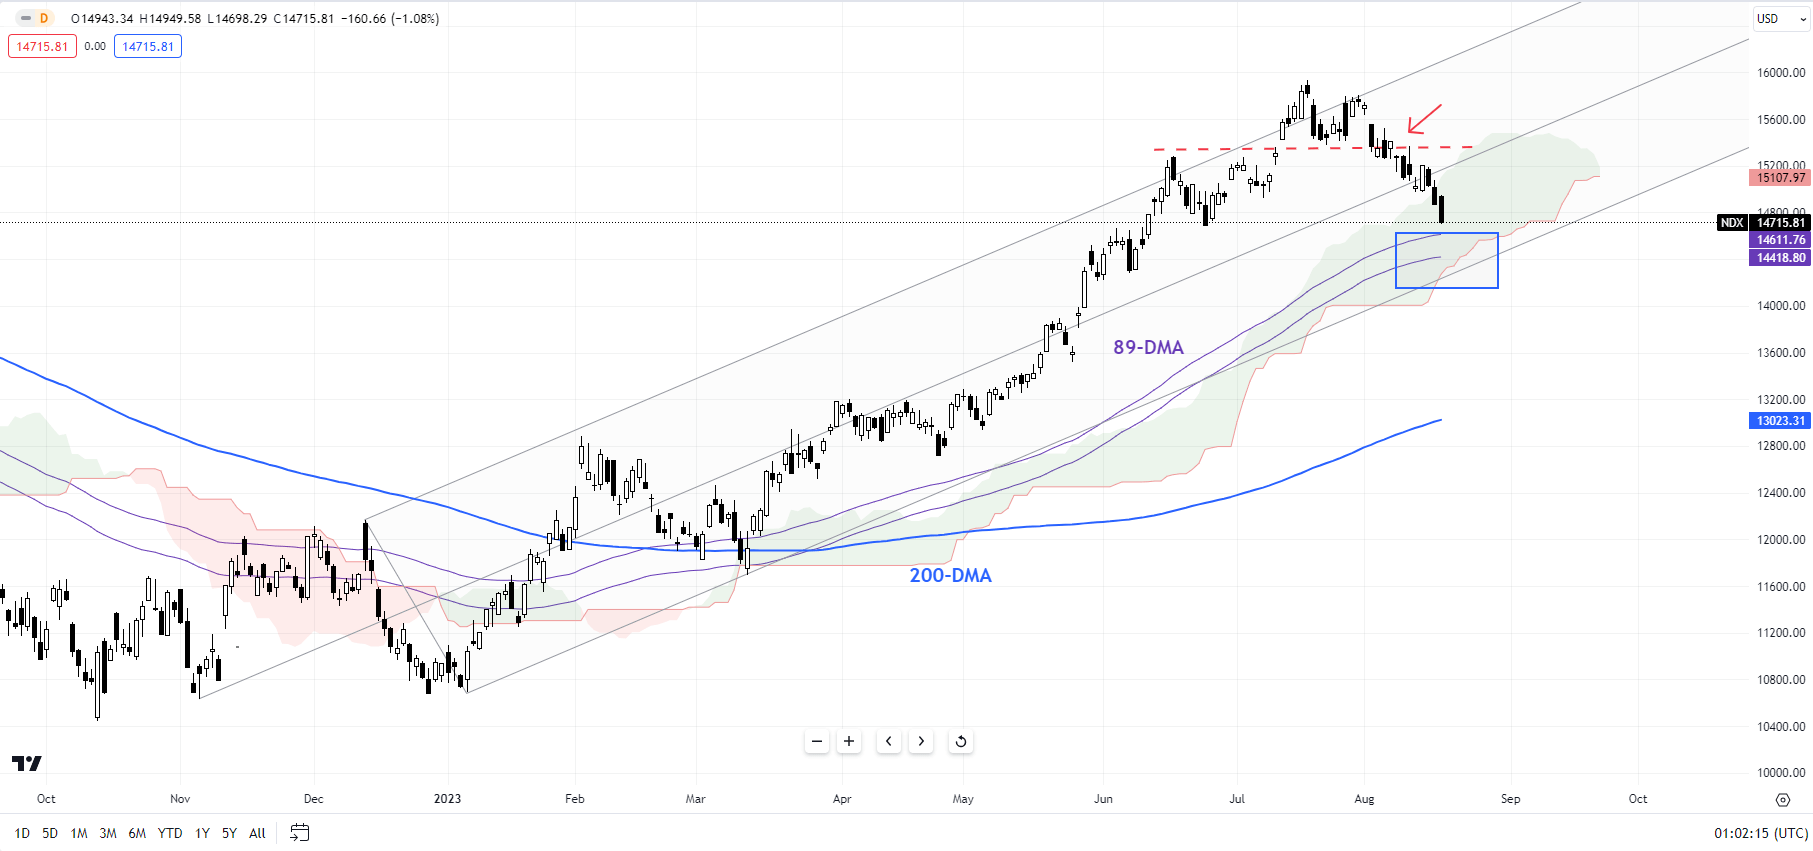
The Nasdaq 100 index’s drop last week below minor support at 15285-15385 and the subsequent break below the 89-period moving average on the 240-minute charts – for the first time since the rally began earlier this year — has confirmed that the bullish pressure has eased for now. The index looks to test the 200-period moving average (now at about 14275).

Nasdaq 100 Daily Chart

image3.png

From a big-picture perspective, as noted in a recent update, monthly charts have been feeble compared with the 50% rally since October (see the monthly chart). See “S&P 500, Nasdaq 100 Forecast: Overly Optimistic Sentiment Poses a Minor Setback Risk,” published July 23. The strength in upward momentum on the daily and weekly charts perhaps masks the anemic conditions on the monthly charts. For more discussion on the bigger picture, see “Is Nasdaq Following Gold’s Footsteps? NDX, XAU/USD Price Setups,” published August 14.

S&P 500 240-Minute Chart

image4.png

S&P 500: Breaks below minor support

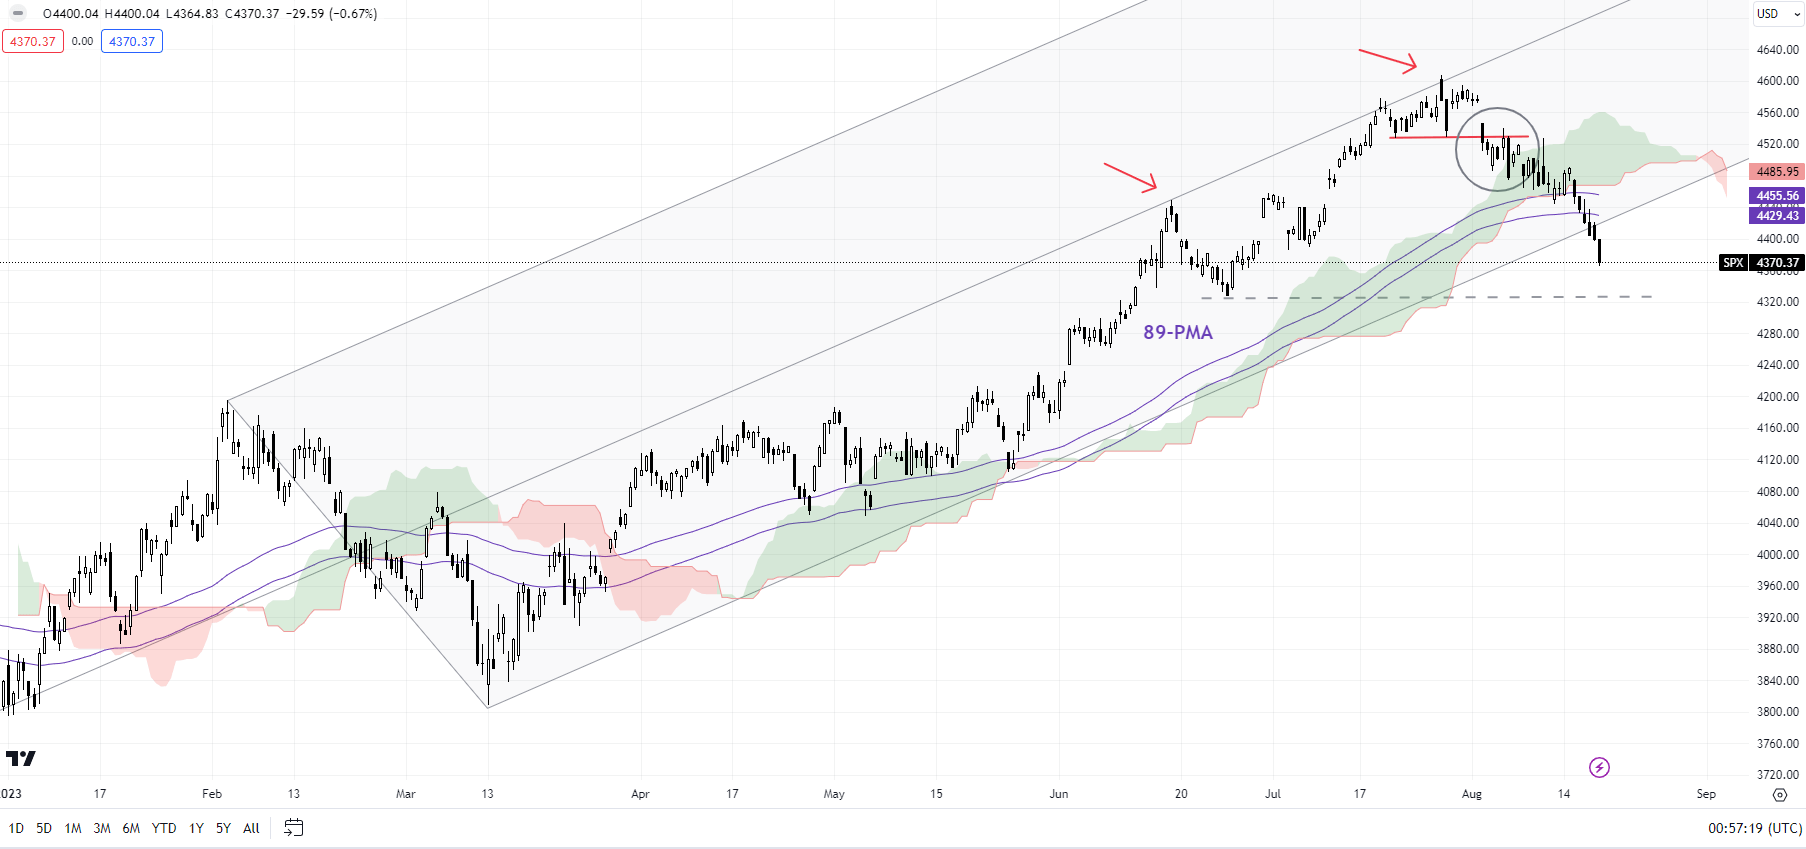
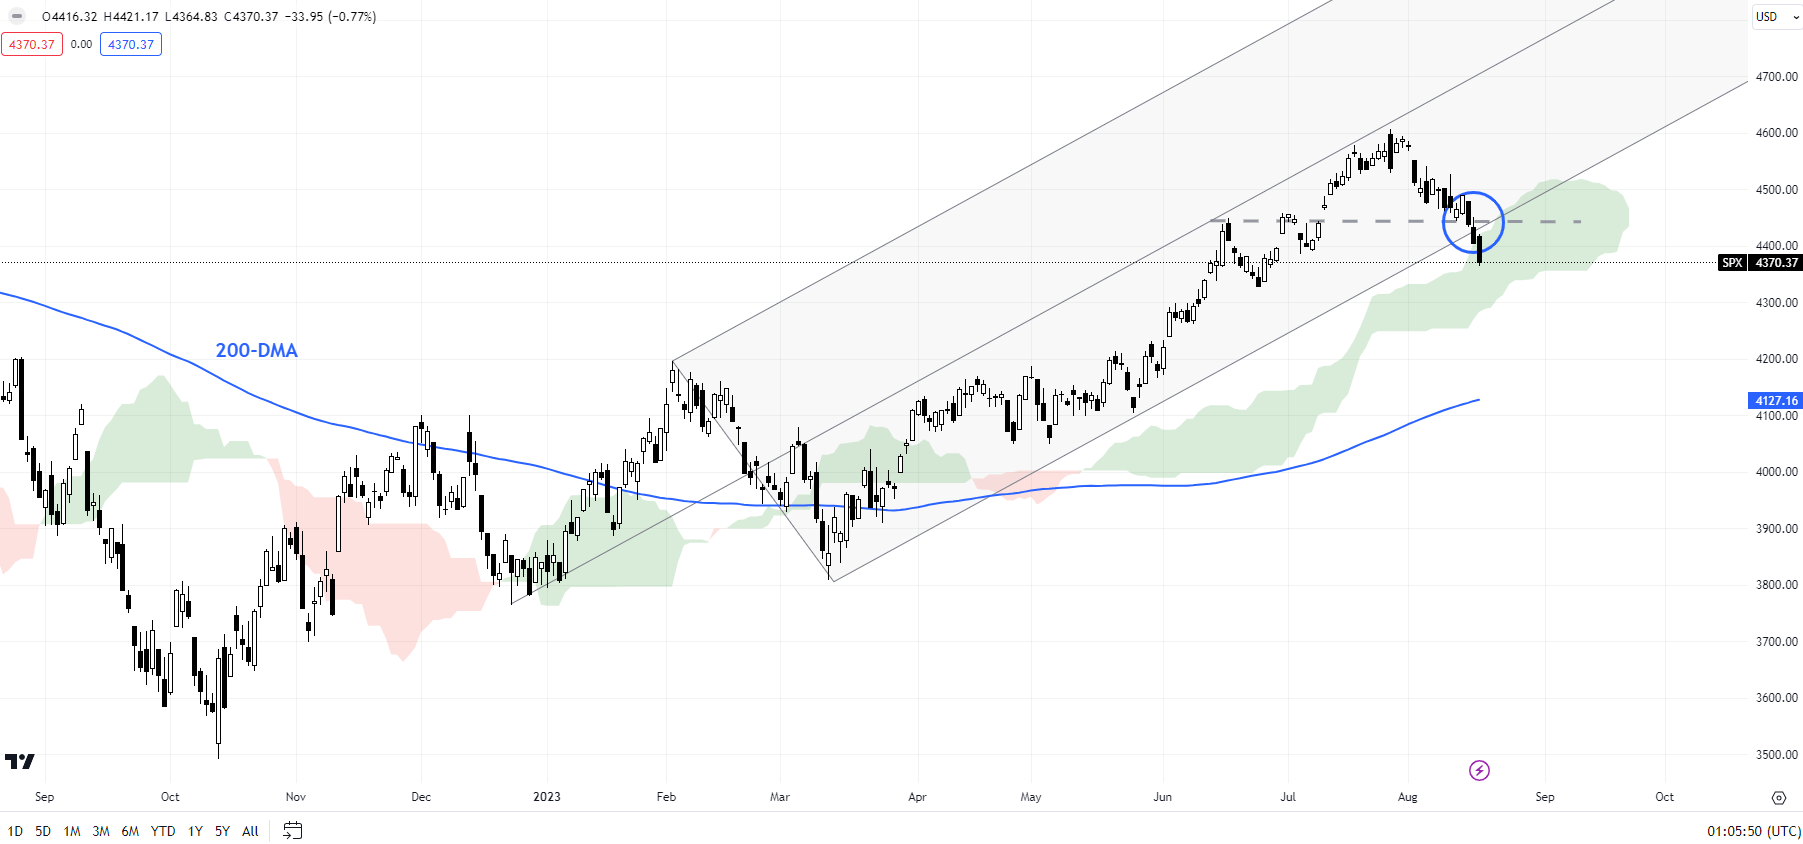
The S&P 500 index’s recent fall below minor support at the late-July low of 4550 has confirmed that the upward pressure has faded in the near term – a riskhighlighted in late July. This follows a failure to rise past the median line of a rising pitchfork channel from the end of 2022, around the April 2022 high of 4637.

S&P 500 Daily Chart

image5.png

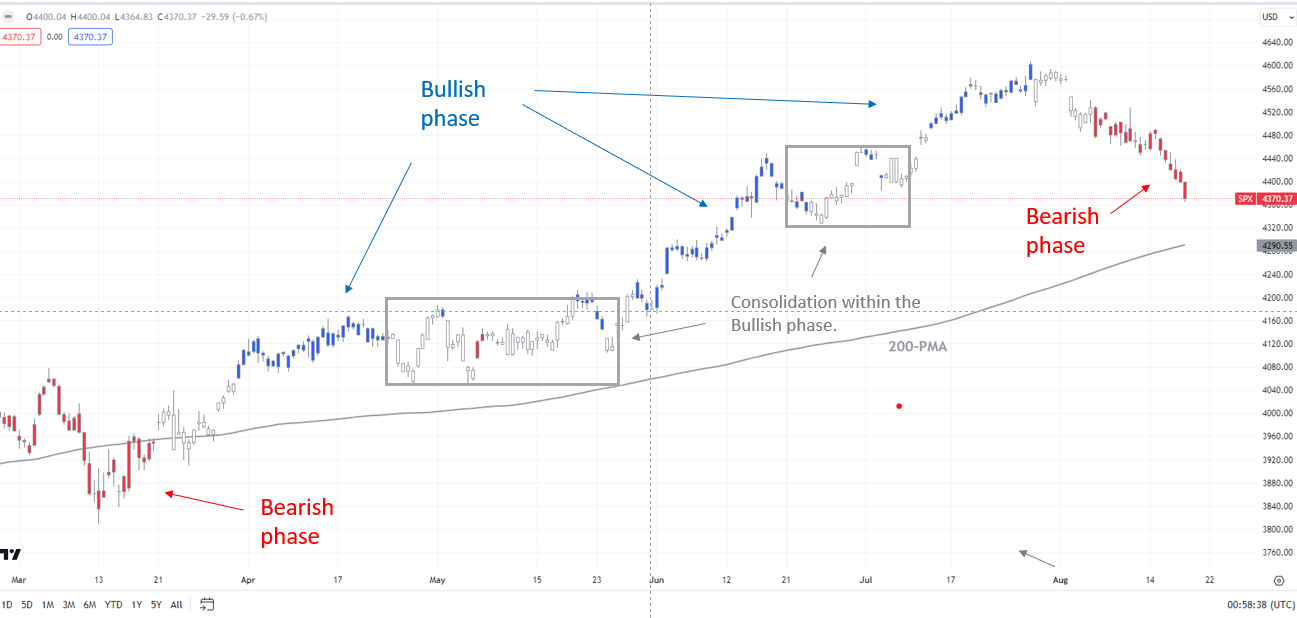
The short-term trend has changed to bearish as highlighted by the colour-coded 240-minute candlestick charts. The index looks set to fall toward a converged cushion on the lower edge of the Ichimoku cloud on the daily charts, roughly coinciding with the end-June low of 4325 and the 200-period moving average on the 240-minute charts.

Note: The above colour-coded chart(s) is(are) based on trending/momentum indicators to minimize subjective biases in trend identification. It is an attempt to segregate bullish Vs bearish phases, and consolidation within a trend Vs reversal of a trend. Blue candles represent a Bullish phase. Red candles represent a Bearish phase. Grey candles serve as Consolidation phases (within a Bullish or a Bearish phase), but sometimes they tend to form at the end of a trend. Candle colors are not predictive – they merely state what the current trend is. Indeed, the candle color can change in the next bar. False patterns can occur around the 200-period moving average, around a support/resistance, and/or in a sideways/choppy market. The author does not guarantee the accuracy of the information. Past performance is not indicative of future performance. Users of the information do so at their own risk.