Oil Prices Forecast: China’s Slowdown, US Rates Shape Bearish Outlook

Oil Prices Forecast: China’s Slowdown, US Rates Shape Bearish Outlook

Overview

Oil prices are trading lower, continuing their volatile down slide, driven by a series of concerns that have cast a shadow over the market. Over the past three sessions, prices have faced declines amidst apprehensions surrounding China’s economic growth slowdown and potential U.S. interest rate hikes. These factors have raised alarms about weakening fuel demand in the world’s two largest economies.

A combination of factors has intensified the bearish undertone in the oil markets. Notably, China’s economic troubles and the broader risk-off sentiment on Wall Street have taken their toll. Concurrently, the strength of the U.S. dollar has further exacerbated the downward pressure on oil prices.

Trading Derivatives carries a high level of risk to your capital and you should only trade with money you can afford to lose. Trading Derivatives may not be suitable for all investors, so please ensure that you fully understand the risks involved, and seek independent advice if necessary. A Product Disclosure Statement (PDS) can be obtained either from this website or on request from our offices and should be considered before entering into a transaction with us. Raw Spread accounts offer spreads from 0.0 pips with a commission charge of USD $3.50 per 100k traded. Standard account offer spreads from 1 pips with no additional commission charges. Spreads on CFD indices start at 0.4 points. The information on this site is not directed at residents in any country or jurisdiction where such distribution or use would be contrary to local law or regulation.

Market participants are closely monitoring several key elements that could sway the oil landscape. These include Chinese economic indicators, government policy maneuvers, and U.S. oil inventory data. The latter is especially significant, as American oil producers might capitalize on production cuts by the OPEC+ alliance by ramping up their output to capture a larger market share.

Troubles in China’s property sector have fueled concerns about the economy’s vitality. Missed payments on investment products by a prominent Chinese trust firm and a dip in home prices have exacerbated worries about the country’s deepening property crisis and its potential to stifle economic momentum. Even China’s central bank, which unexpectedly slashed key policy rates for the second time in three months, faces skepticism about its ability to reverse the economic decline.

Meanwhile, U.S. crude oil inventories have undergone fluctuations. Despite a fall last week due to increased refinery runs and surging exports, crude production hit its highest level since the pandemic-induced fuel consumption decline. Refinery crude runs surged to their highest levels since January 2020, showcasing the struggle to meet domestic and global demand. Additionally, a surge in U.S. oil exports has significantly contributed to the depletion of stockpiles.

The situation in the oil market remains intricate. The production surge, despite a recent drop in the rig count, points to the industry’s resilience. However, the uncertainty stemming from the U.S. Federal Reserve’s stance on interest rates adds another layer of complexity. Minutes from their July meeting suggest a willingness to prioritize the battle against inflation over pausing rate hikes, a decision that could have profound implications for economic growth and, by extension, oil demand.

As oil prices continue to grapple with a litany of challenges, including China’s economic slowdown, potential U.S. interest rate hikes, and broader economic uncertainties, the sentiment in the market remains bearish. These collective concerns cast a cloud over the outlook for oil, prompting caution among traders and investors alike.

Technical Analysis

4-Hour Crude OilThe Crude Oil market displays a bearish sentiment as the 4-hour price of 79.13 is below the 200-4H moving average at 77.90 and the 50-4H moving average at 82.27. The 14-4H RSI of 29.94 indicates an oversold condition, suggesting weaker momentum.

Main support ranges from 79.05 to 78.29, with a main resistance zone of 81.73 to 83.63. Presently, the market remains bearish, as the current price aligns below both moving averages and the RSI signifies oversold conditions. Support and resistance areas further affirm this assessment.

Dax Index: Fed Minutes Stir, As Asian Woes Weigh on DAX

Dax Index: Fed Minutes Stir, As Asian Woes Weigh on DAX

Wednesday’s Session Overview

It was a bullish Wednesday for the DAX. Partially reversing a 0.86% loss from Tuesday, the DAX gained 0.14% on Wednesday to end the day at 15,790.

Economic indicators from the euro area distracted investors from the gloomy mood across the Asian markets.

Trading Derivatives carries a high level of risk to your capital and you should only trade with money you can afford to lose. Trading Derivatives may not be suitable for all investors, so please ensure that you fully understand the risks involved, and seek independent advice if necessary. A Product Disclosure Statement (PDS) can be obtained either from this website or on request from our offices and should be considered before entering into a transaction with us. Raw Spread accounts offer spreads from 0.0 pips with a commission charge of USD $3.50 per 100k traded. Standard account offer spreads from 1 pips with no additional commission charges. Spreads on CFD indices start at 0.4 points. The information on this site is not directed at residents in any country or jurisdiction where such distribution or use would be contrary to local law or regulation.

The Eurozone economy expanded by 0.3% in the second quarter after stalling in the first quarter. Year-over-year, the economy grew by 0.6% versus 1.1% in the first quarter, confirming the first estimates.

Industrial production numbers for June provided relief, rising by 0.5% versus forecasts of a 0.1% decline. In May, industrial production increased by 0.2%.

Later in the day, US industrial production figures also beat forecasts. US industrial production increased by 1.0% in July, reversing a 0.8% decline from June. Economists forecast a 0.3% gain.

However, the stats weren’t good enough for the US markets, which reacted to the post-European closing bell FOMC meeting minutes.

On Wednesday, the NASDAQ Composite fell by 1.15%. It was also a bearish session for the Dow and the S&P 500, which saw losses of 0.52% and 0.76%, respectively.

Daily Chat sends mixed price signals.

Wednesday’s Market Movers

It was a mixed session for the auto sector. Mercedes-Benz Group and BMW bucked a bearish trend, gaining 0.22% and 0.55%. However, Porsche fell by 0.64%, with Continental AG and Volkswagen ending the day with losses of 0.54% and 0.55%, respectively. Demand concerns remained a drag on the broader auto sector.

It was also a mixed session for the banks. Commerzbank rose by 0.20%, while Deutsche Bank fell by 0.53%. Fitch warnings of a suite of US bank rating downgrades, including JPMorgan (JPM), continued to weigh on bank stocks.

The Day Ahead for the DAX

Today, the Eurozone economy remains in the spotlight this morning. Eurozone trade data for July will draw interest amidst the weak global demand environment and China’s economic woes.

Economists forecast the Eurozone trade balance to rise from a €0.3 billion deficit to a €18.3 billion surplus. The devil will be the details, with a fall in exports being a bearish price scenario.

However, another bearish Asian session will influence investor sentiment. The Asian markets continued to respond to worsening economic indicators from China. The overnight FOMC meeting minutes added to the bearish mood and will move the DAX.

The FOMC Meeting Minutes highlight a divided Committee on the need for further rate hikes. Significantly, the focus remained on inflation rather than the macroeconomic backdrop, leaving rate hikes and a hard landing on the table.

Late in the European session, US economic indicators will also move the dial. Philly Fed Manufacturing Index numbers and US jobless claims will also provide direction. A fall in jobless claims would question the theory of a softer US labor market and support hawkish Fed bets.

We expect the jobless claims to trump the Philly Fed Manufacturing data.

DAX Technical Indicators

Looking at the EMAs and the 4-hourly chart, the EMAs sent bearish signals. The DAX sat below the 50-day and 200-day EMAs, sending bearish near and longer-term price signals. Significantly, the 50-day EMA converged on the 200-day EMA. A bearish cross would give the bears a run at the 15,600 – 15,525 support band.

The 14-4H RSI sits at 42.52, reflecting bearish sentiment, with selling pressure overweighing buying pressure. Significantly, the RSI aligns with the EMAs, supporting a return to 15,700 to target the 15,600 – 15,525 support band.

DAX 4-Hourly Chart affirms bearish near-term price signals.
EUR/USD Prices Forecast: Euro Struggles Amid US Economic Strength, Hawkish Fed

EUR/USD Prices Forecast: Euro Struggles Amid US Economic Strength, Hawkish Fed

Overview

The Euro is facing downward pressure against the U.S. Dollar, as the robustness of the U.S. economy reinforces the likelihood of sustained higher interest rates. Despite prevailing expectations of the Federal Reserve maintaining interest rates in September, recent resilient economic indicators from the U.S. suggest that interest rates might stay elevated for an extended period.

Notably, U.S. single-family homebuilding surged in July, coupled with an unexpected rebound in factory production. This economic strength is carrying the weight of elevated interest rates, making it imperative for the Federal Open Market Committee (FOMC) to exercise patience and retain a restrictive monetary policy stance to counter the residual inflationary pressures.

Trading Derivatives carries a high level of risk to your capital and you should only trade with money you can afford to lose. Trading Derivatives may not be suitable for all investors, so please ensure that you fully understand the risks involved, and seek independent advice if necessary. A Product Disclosure Statement (PDS) can be obtained either from this website or on request from our offices and should be considered before entering into a transaction with us. Raw Spread accounts offer spreads from 0.0 pips with a commission charge of USD $3.50 per 100k traded. Standard account offer spreads from 1 pips with no additional commission charges. Spreads on CFD indices start at 0.4 points. The information on this site is not directed at residents in any country or jurisdiction where such distribution or use would be contrary to local law or regulation.

Fed’s Vigilance Amid Inflation Battle

In the context of the Fed’s recent actions, the central bank’s meeting minutes released on Wednesday emphasized that the battle against inflation is far from concluded, requiring ongoing vigilance unless economic conditions change significantly. These minutes correspond to the July meeting, during which the central bank enacted a quarter-point increase in interest rates. Given the persistence of inflation above the Committee’s target and the tight labor market, a consensus among most participants emerged regarding the existence of substantial upside risks to inflation. Consequently, the potential for further monetary tightening remains on the table.

Economy Resilient after 11 Fed Rate Hikes

Since March 2022, the Federal Reserve has executed rate hikes at all but one of its meetings, amounting to a total of 11 increases. While the June meeting this year maintained rates to gauge their impact on curbing economic growth and alleviating inflation, the recent housing data presents a mixed picture. New home construction in the U.S. escalated by 3.9% month-over-month to reach 1.45 million in July, surpassing consensus estimates. However, building permits experienced a meager 0.1% monthly gain, registering 1.44 million, and marking a 13% year-over-year decrease.

Euro Zone Trade Balance Climbs

Shifting to the Euro Zone, June 2023 saw the region’s exports to the global market for goods valued at €252.3 billion, a 0.3% upswing from June 2022. In contrast, imports from the rest of the world amounted to €229.3 billion, representing a substantial 17.7% decline from the previous year. Consequently, the Euro Zone achieved a remarkable trade surplus of €23 billion in June 2023, compared to a €27.1 billion deficit in June 2022. Meanwhile, intra-euro area trade contracted to €231.6 billion, a decline of 4.1% compared to June 2022, illustrating the evolving trade dynamics within the region.

Technical Analysis

4-Hour EUR/USDThe EUR/USD currently shows a price of 1.0867, slightly lower than the 4-hour moving average of 1.0948, indicating a potential short-term bearish sentiment. The RSI at 34.09 suggests bearish momentum, approaching the oversold threshold. Major support lies at 1.0844 to 1.0834, and resistance at 1.1042 to 1.1065.

The market’s proximity to the support zone implies cautious movement. Given the price below both moving averages and RSI in the bearish region, the sentiment leans towards bearish with support at 1.0844 to 1.0834 in sight.

Silver Prices Forecast: XAG/USD Holds Ground as Gold Tests 5-Month Low

Silver Prices Forecast: XAG/USD Holds Ground as Gold Tests 5-Month Low

Overview

Silver (XAG/USD) is showing resilience by maintaining this week’s multi-month low, indicating potential oversold conditions or that negative Federal Reserve news might be fully priced in. In contrast, gold prices are undergoing a testing phase, hovering near a 5-month low as the U.S. dollar and Treasury yields surge, driven by positive economic data. This development reinforces expectations of the Federal Reserve’s continuous policy tightening.

Fed’s Inflation Concerns

Following the July meeting, policymakers remain committed to addressing inflation concerns, acknowledging the risks associated with aggressive rate hikes. Despite 11 rate hikes since March 2022, inflation worries persist, potentially leading to further monetary tightening.

Trading Derivatives carries a high level of risk to your capital and you should only trade with money you can afford to lose. Trading Derivatives may not be suitable for all investors, so please ensure that you fully understand the risks involved, and seek independent advice if necessary. A Product Disclosure Statement (PDS) can be obtained either from this website or on request from our offices and should be considered before entering into a transaction with us. Raw Spread accounts offer spreads from 0.0 pips with a commission charge of USD $3.50 per 100k traded. Standard account offer spreads from 1 pips with no additional commission charges. Spreads on CFD indices start at 0.4 points. The information on this site is not directed at residents in any country or jurisdiction where such distribution or use would be contrary to local law or regulation.

10-Year Treasury Hits 10-Month High

As benchmark 10-year U.S. Treasury yields reach a 10-month high and the dollar rises to mid-June levels, gold is affected, though silver appears relatively unaffected today. Fed meeting minutes signaled more rate hikes, hinting at potential yield spikes. Spot silver (XAG/USD) remains relatively stable, albeit cautiously.

Silver Still Vulneable if Support Zone Fails

Amid rising yields and dollar strength, spot silver could face a decline towards $22.00 per ounce after breaking crucial support levels. U.S. yield and dollar index levels will likely influence market sentiment, possibly marking a significant turning point. Analysts anticipate silver price volatility, particularly driven by U.S. rate-related commentary.

Long-Term Direction Hinges Upon Timing of Fed Rate Cuts

Silver’s potential upside hinges on anticipated rate cuts in 2024. Despite robust U.S. economic data defying recession predictions, silver’s safe-haven appeal wanes, reflecting reduced investor interest during economic uncertainty.

Short-Term Outlook:  Set-up for Short-Covering Rally

In conclusion, while silver diverges from gold’s trajectory, it remains uncertain whether this signifies the beginning of a substantial short-covering rally. A significant rally isn’t expected given rising yields and a strengthening dollar, along with uncertainty surrounding the Fed’s upcoming rate decision in September.

The Federal Reserve’s cautious stance on inflation and ongoing rate hikes will shape the current silver and gold market landscape. Both metals face pressure from increasing yields, yet the possibility of rate cuts in 2024 could serve as a catalyst for price rebounds, making silver particularly attractive to long-term speculators.

Technical Analysis

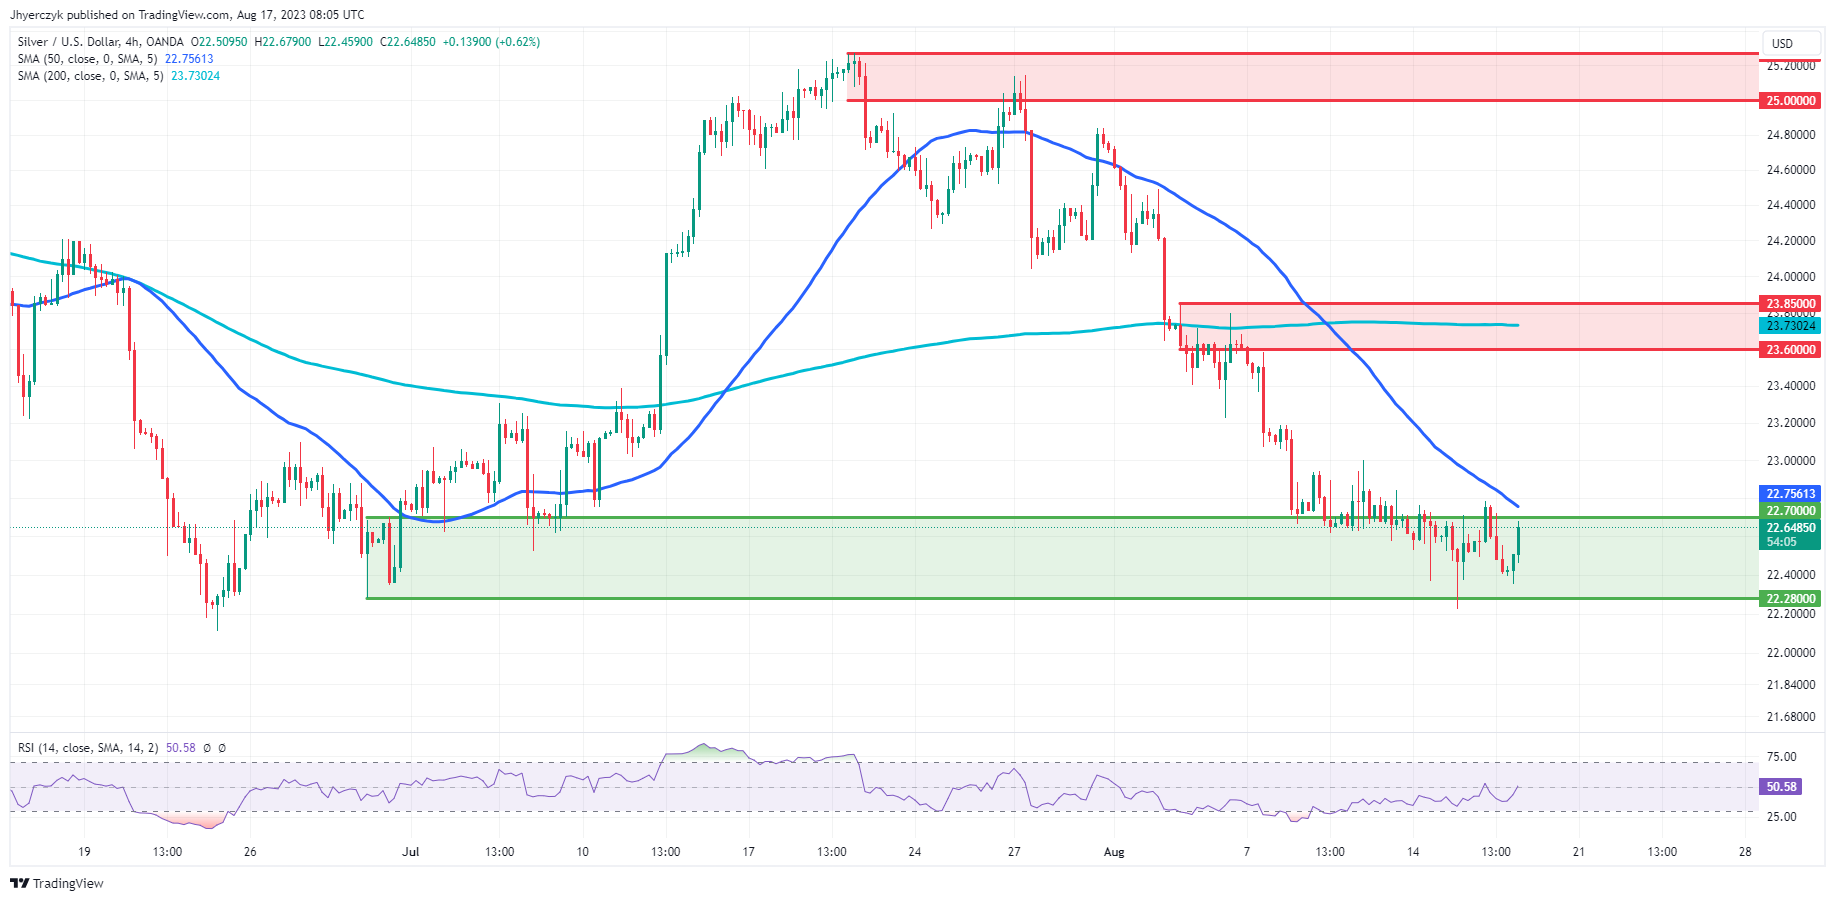
4-Hour Silver (XAG/USD)The current 4-hour price of Silver (XAG/USD) at 22.65 indicates a slight increase from the previous 4-hour close of 22.51. The market price is positioned just below the 200-4H moving average of 23.73, suggesting potential resistance. The 50-4H moving average at 22.76 is also nearby, indicating a close proximity to this key level. The 14-4H RSI reading of 50.60 falls within the neutral zone, implying a balanced momentum.

Silver’s current price aligns with the main support area of 22.70 to 22.28, suggesting a stabilizing effect. The main resistance area of 23.60 to 23.85 indicates potential hurdles for price advancement. Given the proximity to both moving averages and the neutral RSI, the market sentiment appears cautious. Overall, considering the support and resistance levels, the market sentiment remains neutral.

All eyes are on the 50-4H moving average at 22.76. This is a potential trigger point for an acceleration to the upside on the 4-hour chart.

Gold Prices Forecast: Yield Spikes, Fed’s Tightening Policy Driving Sellers

Gold Prices Forecast: Yield Spikes, Fed’s Tightening Policy Driving Sellers

Overview

Gold (XAU/USD) prices hit five-month lows as the U.S. dollar and Treasury yields surged on positive economic data, reinforcing expectations of the Federal Reserve’s ongoing policy tightening. Following the Fed’s July meeting, policymakers remained committed to combating inflation, acknowledging risks from aggressive rate hikes. Despite 11 rate hikes since March 2022, inflation concerns persist, potentially necessitating more monetary tightening.

Treasury Yields Influence Gold Movement

Benchmark 10-year U.S. Treasury yields reached a 10-month high, driving the dollar to mid-June levels and diverting investors from gold. Wednesday’s Fed meeting minutes indicated further rate hikes, suggesting potential spikes in yields. While the minutes fueled dollar and yield strength, spot gold exhibits signs of stability today, albeit cautiously.

Trading Derivatives carries a high level of risk to your capital and you should only trade with money you can afford to lose. Trading Derivatives may not be suitable for all investors, so please ensure that you fully understand the risks involved, and seek independent advice if necessary. A Product Disclosure Statement (PDS) can be obtained either from this website or on request from our offices and should be considered before entering into a transaction with us. Raw Spread accounts offer spreads from 0.0 pips with a commission charge of USD $3.50 per 100k traded. Standard account offer spreads from 1 pips with no additional commission charges. Spreads on CFD indices start at 0.4 points. The information on this site is not directed at residents in any country or jurisdiction where such distribution or use would be contrary to local law or regulation.

Gold (XAU/USD) Vulnerable to Steep Break

Amidst rising yields and dollar strength, spot gold might plunge if key support at $1893.07 fails. Market sentiment hinges on U.S. yield and dollar index levels, possibly marking a crucial turning point. Analysts anticipate gold price volatility, largely influenced by U.S. rate-related commentary.

Economic Factors Shape Gold Prospects

Potential upside for gold hinges on expected rate cuts in 2024. Despite robust U.S. economic data defying recession predictions, gold’s allure as a safe haven wanes, reflecting reduced investor interest during times of economic uncertainty.

Short-Term Outlook:  Yield Dependent

In conclusion, gold prices reaching five-month lows stem from a resurgent dollar and Treasury yields, fueled by optimistic economic data. The Federal Reserve’s cautious stance on inflation and ongoing rate hikes have shaped the current market landscape. While gold faces pressure from rising yields, the prospect of rate cuts in 2024 remains a potential catalyst for price rebound.

Technical Analysis

4-Hour Gold (XAU/USD)The current 4-hour price of Gold (XAU/USD) stands at 1896.08, slightly above the Main Support Area of 1893.07 to 1885.79. The price has a proximity to the 200-4H moving average of 1939.91, indicating potential resistance. The 50-4H moving average at 1915.84 also serves as a significant resistance. The 14-4H RSI at 34.28 suggests bearish momentum.

While the price is near the Main Support Area, the RSI hints at weakening strength. Given the proximity to the 200-4H and the 50-4H moving averages and the bearish RSI reading, the market sentiment leans toward a bearish outlook.

Australian Employment Report Shuts the Door on the RBA

Australian Employment Report Shuts the Door on the RBA

Australian Unemployment Rate Hits 3.7%

It was a busy morning after the FOMC meeting minutes. Australian employment figures for July were in focus this morning. After the softer-than-expected wage growth figures, the employment figures were significant, with weak numbers likely to shut the door on further RBA interest rate hikes.

Employment declined by 14.6k in July versus a 32.6k jump in June. Economists forecast a 15.0k increase. Full employment fell by 24.2K versus a rise of 39.3k in June. The unemployment rate inched up from 3.5% to 3.7% in July. Economists forecast the unemployment rate to increase to 3.6%.

According to the ABS,

  • The decline in employment followed an average monthly increase of circa 42,000 over the first half of 2023.
  • July includes the school holidays, which likely impacted the month-to-month changes.
  • Unemployment was 172,000 lower than before the pandemic despite unemployment rising by 36,000 in July.
  • Monthly hours worked increased by 0.2%, while employment declined by 0.1%. The ABS attributed the higher hours worked to fewer people working over the school holidays.
  • Underemployment remained unchanged, with the underemployment rate 2.4 percentage points lower than before the pandemic.

Australian employment remains a consideration for the RBA. Deteriorating labor market conditions ease pressure on wage growth and demand-driven inflation. Higher interest rates lead to a pullback in hiring and a decline in purchasing power, with the net effect of easing consumption and, ultimately, consumer price pressures.

The latest wage growth and employment numbers suggest the RBA policy moves are beginning to take effect. However, investors and the RBA need to consider the post-school holiday numbers to assess the lay of the land.

Aussie Dollar Reaction to the Australian Employment Numbers

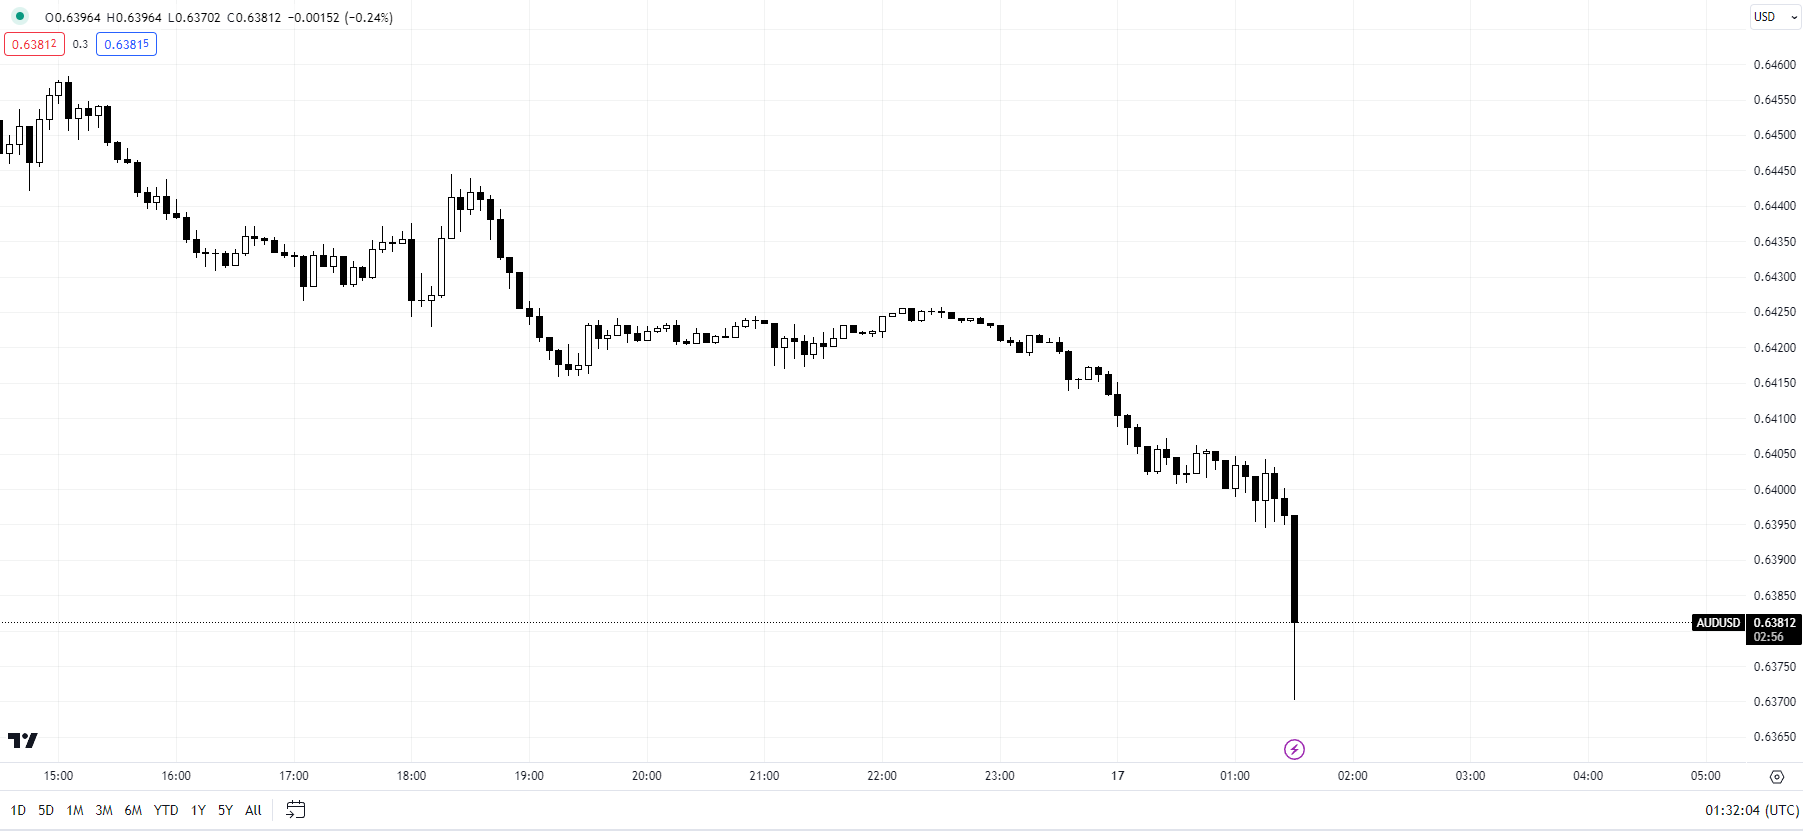
Before the employment report, the AUD/USD rose to an early high of $0.64285 before falling to a post-stat low of $0.63946.

However, in response to the employment report, the Aussie dollar fell from $0.63971 to a post-stat low of $0.63649.

This morning, the Australian dollar was down 0.70% to $0.63797.

AUD to USD slides on Australian employment numbers - FX Empire
170823 AUDUSD 30 Minute Chart

Post FOMC Jobless Claims Need Consideration

This afternoon, Philly Fed Manufacturing Index numbers and US jobless claims will also provide direction. A fall in jobless claims would question the theory of a softer US labor market and support hawkish Fed bets.

We expect the jobless claims to trump the Philly Fed Manufacturing data.

It is worth noting that the manufacturing numbers are unlikely to influence the Fed. The manufacturing sector accounts for less than 30% of the US economy and is unlikely to dictate sentiment toward Fed monetary policy. In contrast, tight labor market conditions support further Fed rate hikes to curb demand-driven inflation.

Hawkish Tilt in Fed Minutes, While Trade Data in Asia Weakened: Gold, USD/SGD, US Dollar

Hawkish Tilt in Fed Minutes, While Trade Data in Asia Weakened: Gold, USD/SGD, US Dollar

It was another down day in Wall Street, as statements from the Federal Open Market Committee (FOMC) minutes did not reflect the level of unity among policymakers to pause rates as what was initially expected. Particularly, the key takeaway that “most participants continued to see significant upside risks to inflation, which could require further tightening of monetary policy” was somewhat perceived to carry a hawkish tilt.

The Fed funds futures still showed firm expectations for a rate pause in September (88% probability) but doubts have surfaced for the November meeting. A 35% probability of a November hike is currently priced, up from the 28% a week ago. Given that the Fed reiterated its data-dependent stance in the minutes, it may still have to take a series of upside surprises in inflation to anchor down views of additional tightening, but for now, the minutes were tapped on as a catalyst for the risk rally to further unwind, alongside jitters in the Chinese space.

US Treasury yields largely held firm, with the two-year yields hovering at the 5% mark as a reflection for a high-for-longer rate outlook while the 10-year yields head for its October 2022 peak. The US dollar firmed, crossing its 200-day moving average (MA) for the first time since November 2022. That kept the pressure on gold prices overnight (-0.5%), which touches a new low since March this year. Its weekly relative strength index (RSI) has headed further below the 50 level, with further downside potentially leaving the US$1,850 level on watch next.

image1.pngSource: IG charts

Asia Open

Asian stocks look set for a negative open, with Nikkei -0.88%, ASX -0.90% and KOSPI -1.21% at the time of writing. Weak showing in trade data across the region continue to point to the prevailing headwinds in global demand, partly weighed by the low-for-longer growth conditions in China. Japan’s exports registered its first year-on-year decline (-0.3%) in 2.5 years and along with a lower-than-expected read in machinery orders for June (-5.8% versus -5.5% consensus), that may support the Bank of Japan (BoJ) on its more gradual path of policy normalisation.

Similarly, Singapore’s non-oil domestic exports (NODX) for July tumbled, with a larger 20.2% contraction year-on-year way underperforming the 14.4% contraction expected. Given the headwinds to China’s growth conditions with property sector risks likely to drag for longer, while spillover default risks has reached the shadow banking sector, there are rising doubts on the country’s 5% growth target for this year. The current bias is that the worst is yet to come for China, with a more subdued growth outlook across the export-dependent region likely to stay for the rest of the year.

A firmer US dollar overnight has pushed the USD/SGD to a new year-to-date high. The daily RSI in overbought territory may call for some cooling, but given that the pair has reclaimed its 200-day MA for the first time since November 2022, buyers still remain in greater control. The pair is heading past its 1.360 level of resistance this morning, where a 38.2% Fibonacci retracement level stands from its September 2022 peak to February 2023 bottom. Further upside may potentially pave the way to retest the 1.376 level next.

image2.pngOn the watchlist: US dollar back above its 200-day MA for first time since November 2022

The 4.2% gain in the US dollar over the past month has seen the index overcome several key resistance in the likes of a downward trendline in place since September 2022, along with its 200-day MA. Sustaining above the MA-line will be key ahead. For now, the US dollar is back at its 103.12 level, where it faced strong resistance from the previous Fed minutes release. Reclaiming the 103.12 level may potentially pave the way to retest the 105.00 level next, as its weekly RSI attempts to head above the key 50 level as a reflection of buyers in greater control.

image3.png

Australian Dollar Falls After Jobs Data Miss; How Much More Downside for AUD/USD?

Australian Dollar Falls After Jobs Data Miss; How Much More Downside for AUD/USD?

The Australian dollar dropped against than the US dollar after the Australian economy created fewer-than-expected jobs last month.

The Australian economy created 14.6k jobs in July, compared with forecasts of 15k, well below 32.6k in June. The unemployment rate rose marginally to 3.7% compared with expectations of 3.6%, Vs 3.5% in June.

AUD/USD 5-minute Chart

image1.png

The Australian jobs market has been strong with the unemployment rate hovering around five-decade lows. Today’s data could be an early sign that the jobs market could be cooling, lowering the bar for further tightening. The Reserve Bank of Australia (RBA) Governor Philip Lowe said Friday that the worst is over for inflation, though some further tightening might be needed. Markets are now showing a high chance that the cash rate will stay at 4.1% for a third month in September, but a small chance of another rate hike in November and stable rates thereafter for a year.

In contrast, minutes of the June FOMC meeting showed most participants saw fighting inflation as their top priority, echoing San Francisco Fed President Mary Daly’s remarks last week there is more work to be done by policymakers. A resilient US economy – further reinforced by this week’s stronger-than-expected US retail sales and industrial output – and a tight labour market has pushed up expectations for a November Fed rate hike. Higher for longer US rates, the outperformance of the US economy, and neutral speculative USD positioning point to continued support for the greenback.

AUD/USD Daily Chart

image2.png

Furthermore, underwhelming China macro data have added to AUD woes. Data published earlier in the week showed retail sales, industrial output, and fixed asset investment came in below expectations, reflecting the trend in recent months – the China Economic Surprise Index is just off mid-2020 (Covid levels). China is Australia’s largest export destination.

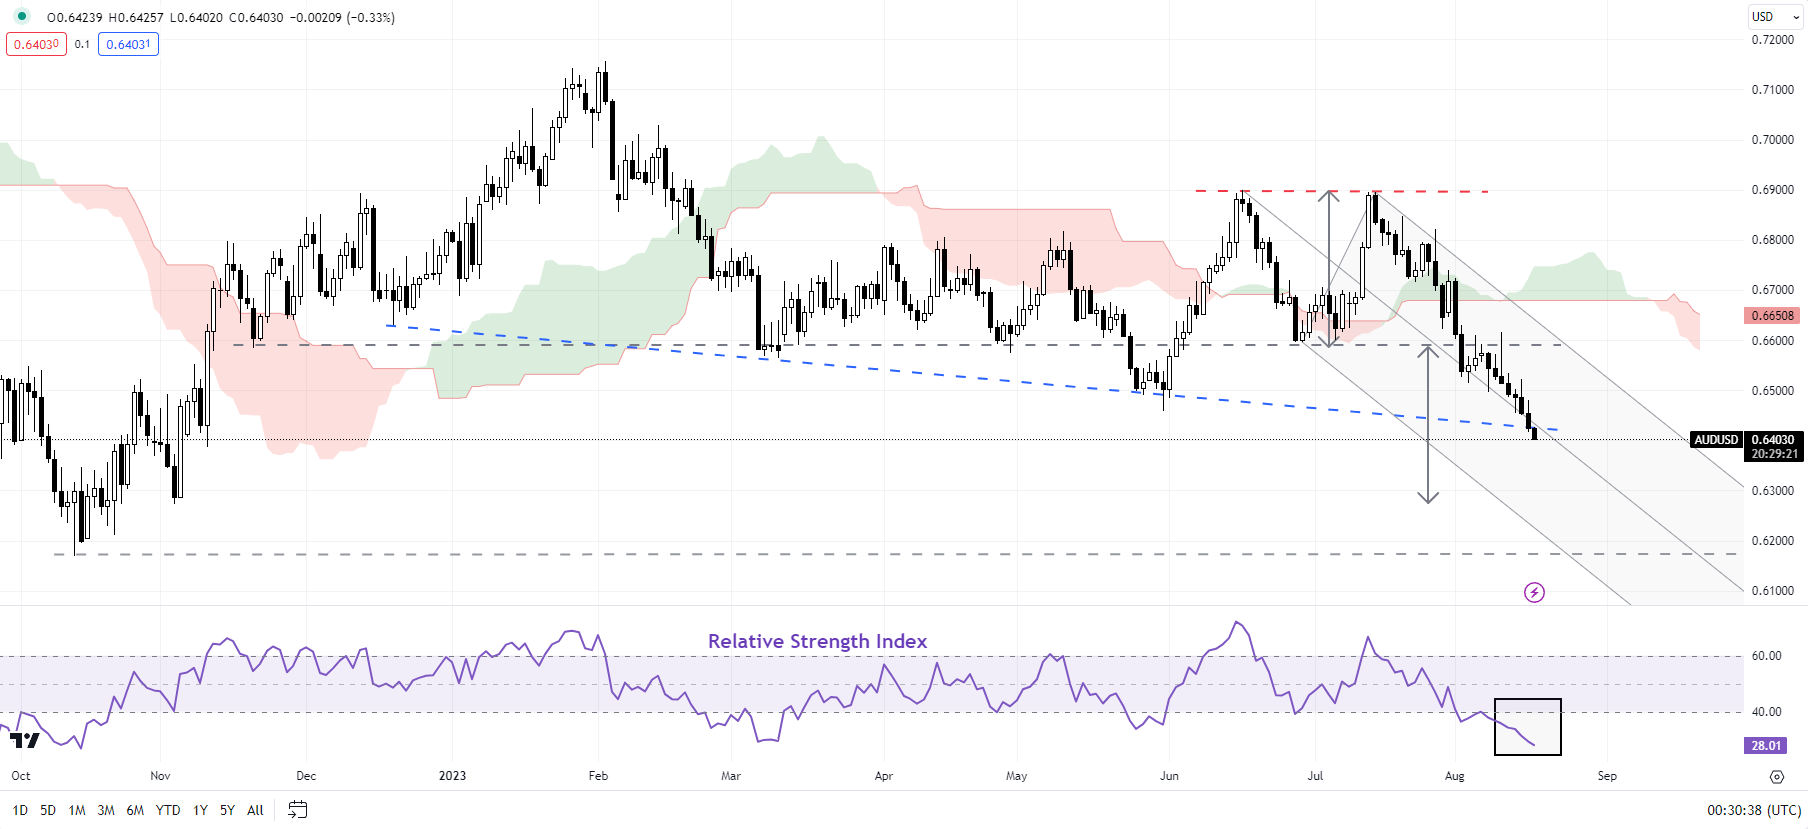
On technical charts, AUD/USD’s fall below the June low of 0.6600 has triggered a double top pattern (the June and July highs), pointing to a drop toward 0.6300. For now, though, the pair looks deeply oversold on the daily charts as it tests a vital cushion on a downtrend line from early 2023 (see the daily chart).

Euro Vulnerable Against a Runaway US Dollar with Treasury Yields Jumping

Euro Vulnerable Against a Runaway US Dollar with Treasury Yields Jumping

EUR/USD MACRO VIEW

The Euro capitulation could be mostly attributed to a roaring US Dollar strengthening across the board of late.

Overnight the Federal Open Market Committee (FOMC) meeting minutes showed a more hawkish board than the market had pencilled in.

The messaging from several Fed speakers over the past week has been a consistent mantra of keeping monetary policy tight for a long period. The minutes revealed that another hike might be in the offing if conditions warrant it.

The 1- and 2-year part of the interest rate market scaled back rate cut prospects by around 10 – 15 basis points this week.

Perhaps more importantly, further along the Treasury yield curve, there has been a parallel shift higher, underpinning the ‘big dollar’.

The benchmark 10-year bond is trading near 4.29%, a whisker away from the 4.33% seen in October last year, which was the highest return on that note since 2007.

The latest data on Treasury holdings for June revealed that China has been a consistent seller this year. The only month that they have been a buyer of US Government bonds was in March when the Yuan rallied significantly.

This week, the Yuan has been weakening and it’s possible that China has again been selling US debt in order to sell USD and buy Yuan..

The market perception of the situation in the world’s second-largest economy has deteriorated this week despite the People’s Bank of China (PBOC) cutting its 1-year medium-term lending facility rate to 2.50% from 2.65%.

Country Garden and Sino Ocean, two very large property developers, have defaulted on several offshore and onshore bonds this month.

The concept of contagion entered the markets’ lexicon after Zhongrong International Trust Co., a major player in China’s trust sector, missed several obligations to its clients over the past week.

If this scenario continues to play out, EUR/USD could see further downside. Click on the banner above to learn more about how to trade EUR/USD.

EUR/USD DAILY TECHNICAL ANALYSIS SNAPSHOT

EUR/USD remains below a descending trend line as it appears set for its fifth straight day of declines.

If it was to rally and approach that trend line, there could be resistance at the 21- and 34-day simple moving averages (SMA).

Potential resistance might also be offered in the 1.1065 – 1.1095 area where several historical breakpoints reside along with a recent high and just ahead of the psychological level at 1.1100.

Further up, resistance could be at the breakpoint from the March 2022 high at 1.1185 or the recent peak at 1.1275, which coincides with two historical breakpoints.

Above those levels, resistance might be at the Fibonacci Extension of the move from 1.1095 to 1.0635 at 1.1380. Just above there are some more breakpoints in the 1.1385 – 95 area.

To learn more about Fibonacci technical analysis, click on the banner below.

Support could also be near the 78.6% Fibonacci Retracement levels at 1.0770 which is just below the 200-day SMA.

Ahead of that level, some prior lows and the breakpoint in the 10830- 1.0835 area may provide support.

image1.png


How to Trade After a News Release

How to Trade After a News Release

Traders need to learn how to navigate volatile markets by implementing a solid trading plan and adopting sound risk management. This article provides effective tools for traders looking to trade post release.

Other articles in this series:

Post-release trading strategies

1. Trend following strategy

This strategy involves the use of multiple time frames, as well as, well-defined levels of support and resistance that come into play after a news release.

Traders can adopt this strategy when the current market price is approaching a well-defined level of support or resistance but isn’t quite there yet. The volatility after the news release has the potential to push the market toward the trendline. If price respects the trendline, traders can look to trade in the direction of the trend and trade the potential bounce.

The following 4 points are of assistance for this type of trade:

  1. Determine trend direction on a daily chart
  2. Draw support and resistance lines
  3. Select a forex time frame anywhere from 1 – 4 hours
  4. Buy near support in uptrend and sell near resistance in downtrend

Keep in mind that news releases have the potential to break through longstanding levels of support and resistance which underscores the importance of using tight stops when pursuing this strategy.

Post-release trend following strategy

2. Dual spike breakout strategy

This strategy involves waiting for market volatility to reveal a range before trading a break of that range and makes use of a five-minute chart. For illustrative purposes this section incorporates the US Non-Farm Payroll (NFP) release as this often has the greatest potential to move the market.

After the NFP release, wait 15-minutes for three five-minute candles to close. Take note of the highest price and the lowest price of the three closed candles. Next, place an entry order to go long at the highest price and an entry to go short at the lowest price. Once an order is triggered, targets can be set at twice the distance of the high/low channel while stops can be set above resistance for short trades and below support for long trades.

The disadvantage of this strategy is that volatility can push price above or below the short-term range, triggering an entry order, and then immediately reversing to hit a stop loss.

This strategy can be applied in the following way:

  1. Customize the chart settings to show 5- minute charts
  2. Take note of the highs and lows of the first three candles
  3. Set entry orders when price breaks above or below the range
  4. Set stops and limits
  5. Delete the unfilled order

Dual spike forex news trading strategy

3. News Reversal Strategy

The market can trade in one direction immediately after a major news release only to reverse and trade in the opposite direction.

The news reversal strategy looks to trade the news after the release and focuses on a sudden, sustained reversal in direction after a strong initial move in price.

The reversal could be the result of algorithms or, the market as a whole, feeling that there was an overreaction in price – prompting trades in the opposite direction.

The downside of this strategy is that no reversal takes place and the price continues trading in the direction on the initial spike.

How to implement the news reversal strategy:

  1. Initial spike in price: News with great market moving potential generally lead to a spike in price as the news is released.
  2. Look out for a reversal: Traders can wait 10-15 minutes for the reversal to bring price back to where it was before the release.
  3. Entry: Enter as price breaks above/below pre-release levels.
  4. Set multiple target levels: Traders should consider setting multiple target levels. As one is triggered, traders can take profit on half of the position and adjusting the stop on the remaining position to breakeven.

News reversal trading strategy

Trading forex after the release: Conclusion

Trading the news after the release can be a more conservative way to approach news trading. This is due to the emotions from the news release subsiding allowing a trader time to plan a technical set up for their trade. Regardless of your trading approach to news trading, risk management and utilizing small amounts or no leverage is critical to maintaining capital in your account to make the next trade.

Boost your forex trading knowledge

  • Download our free currency forecasts to stay abreast with the DailyFX expert view on forex market movements.
  • If you’re just starting out on your forex trading journey, download our free New to Forex trading guide to get to grips with the basics.

Trading after the news FAQ section

What type of news is most likely to move the market?

US economic data is so influential within global currency maekets that it is generally seen as the most important news. Additionally, it is important to note that not all news releases lead to increased volatility. Rather, there are a limited number of major news releases that have previously produced the greatest potential to move the market and some of these include:

  • US non-farm payrolls
  • US GDP
  • Us Federal Funds Rate announcement
  • ECB refinancing rate
  • Australian employment change