AU: Jump in quick home resales blamed on rising mortgage stress by analysts, real estate agents

AU: Jump in quick home resales blamed on rising mortgage stress by analysts, real estate agents

“Or a lot of the time as well we’ve had investors that have said, ‘Yeah, we want to retire,’ or, ‘We need to get rid of it because it’s costing too much for us to keep the property now.'”

CoreLogic data prepared exclusively for ABC News shows the percentage of properties being sold after being owned for fewer than two years is at a nine-year high.

In April, 8.3 per cent of properties that were sold had previously changed hands within the past two years, a steep increase since a pandemic low in mid-2021.

Almost 14 per cent of homes sold across Australia in April had previously changed hands within the three years prior.

Hobart had the highest portion of properties resold within three years, at almost 16 per cent, followed by Brisbane (15.2 per cent) and the ACT (13.9 per cent).

Brisbane and Hobart were also the stand-outs for properties resold within two years, with almost one in 10 properties in the Queensland capital changing hands within 24 months of their last sale.

Ms Jones says most of her clients are still doing OK out of their sales, at least before considering transaction costs and taxes.

“A lot of the time we are finding that people are still making profits on their properties,” she says.

CoreLogic’s head of Australian research, Eliza Owen, says a quick turnover of properties generally spikes during booms, as investors flip homes for a fast profit.

CoreLogic’s head of Australian research Eliza Owen has crunched the numbers on how many homes are beingresold within a few years of their previous purchase.(ABC News: John Gunn)

“Historically, it is unusual for properties to be selling if they’ve only been held for a short period of time when capital growth conditions are weak,” she observes.

“The last time we saw a strong instance of short-term resales was when you had really low interest rates, consistent capital growth and basically a booming property market.

“In many instances, what was happening was that investors would purchase a property, hold it until the interest-only term was up and then resell it, in most instances for a profit.”

Is It Time to Bet on an Inflation Overshoot?

Is It Time to Bet on an Inflation Overshoot?

Our main story today is a skeptical note following [ECB head] Christine Lagarde’s press conference [on July 27]. What became clear to us is that the ECB is still reliant on its forecasting model to determine whether it is on a trajectory to reach the 2% inflation target. This is not a technical issue, but rather it is critical for the assessment of what to expect. Since this model is biased in favor of forecasting the target, we conclude that the potential for a policy error is growing.

The big problem with data dependence is that it does not tell you what you need to know. You may know that inflation is coming down, but you don’t know whether or not it is coming down to 2%. Lagarde told us yesterday that the ECB was using the forecast, or projection as they call it these days, to make that determination. That alone tells us that the ECB will from now on tread more cautiously, because the forecast is hard-wired to predict outcomes in the vicinity of the inflation-target. In particular, it makes the assumption that the sheer announcement of an inflation target anchors people’s expectations. We know this is not true, but it forms an essential element without which the framework would not work.

The problem with this policy rule is that it would give you the same answer regardless of whether your target is 2% or 3%.

It is interesting that central banks have never subjected their forecast performance to outside evaluation. The ECB’s model has been giving wrong forecasts for the last ten years. It is not the forecast error that is the problem, but the forecast bias. The model is biased in favor of the actual target. If your benchmark is biased in favor of the target, then it is biased in favor of a lower interest rate. The reason we are focused so heavily on discussions of the model here at Eurointelligence is because it is the main source of policy errors.

If this happened in finance or in political polling, these models would have been kicked out a long time ago, along with the staff that produce them. That is not happening in central banks, whose economists are attached to what they like to call their workhorse models.

In its update of its World Economic Outlook, the IMF also warned about the asymmetry of inflation. So did several economists like Olivier Blanchard, Kenneth Rogoff. Some of them may be open to the idea of a higher inflation target.

We conclude therefore that the risk of a permanent inflation overshoot at the ECB is high.

Structural Inflation

Is It Time to Bet on an Inflation Overshoot?

Swiss National Bank posts $15 billion loss during second quarter

Swiss National Bank posts $15 billion loss during second quarter

The SNB lost 8.08 billion francs on its foreign currency positions of 742 billion francs, as bond prices fell as investors feared more interest rate hikes by the US Federal Reserve, European Central Bank and others.

ZURICH: The Swiss National Bank posted a second quarter loss of 13.20 billion Swiss francs ($15.14 billion), it said on Monday, as interest rate hikes by other central banks dented the value of its massive bond holdings.

The Swiss central bank also lost 3.14 billion francs on its gold holdings in the three months to the end of June, as the lower gold price cut the value of the 1,040 tonnes of the precious metal it holds.

Euro area annual inflation down to 5.3%

Euro area annual inflation down to 5.3%

Euro area annual inflation is expected to be 5.3% in July 2023, down from 5.5% in June according to a flash estimate from Eurostat, the statistical office of the European Union. Looking at the main components of euro area inflation, food, alcohol & tobacco is expected to have the highest annual rate in July (10.8%, compared with 11.6% in June), followed by services (5.6%, compared with 5.4% in June), non-energy industrial goods (5.0%, compared with 5.5% in June) and energy (-6.1%, compared with -5.6% in June).

GDP up by 0.3% in the euro area and stable in the EU

GDP up by 0.3% in the euro area and stable in the EU

In the second quarter of 2023, seasonally adjusted GDP increased by 0.3% in the euro area and was stable in the EU, compared with the previous quarter, according to a preliminary flash estimate published by Eurostat, the statistical office of the European Union. In the first quarter of 2023, GDP had remained stable in the euro area and had increased by 0.2% in the EU. These preliminary GDP flash estimates are based on data sources that are incomplete and subject to further revisions.Compared with the same quarter of the previous year, seasonally adjusted GDP increased by 0.6% in the euro area and by 0.5% in the EU

Australian Dollar Blipped Up on China Data. Will AUD/USD Continue to Recover?

Australian Dollar Blipped Up on China Data. Will AUD/USD Continue to Recover?

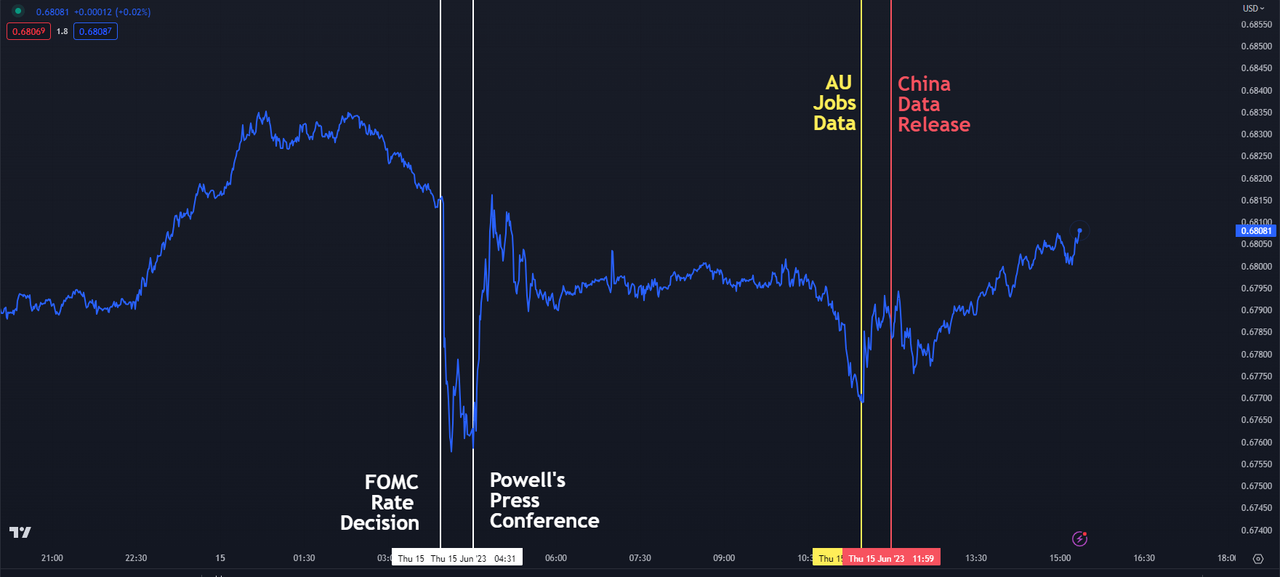
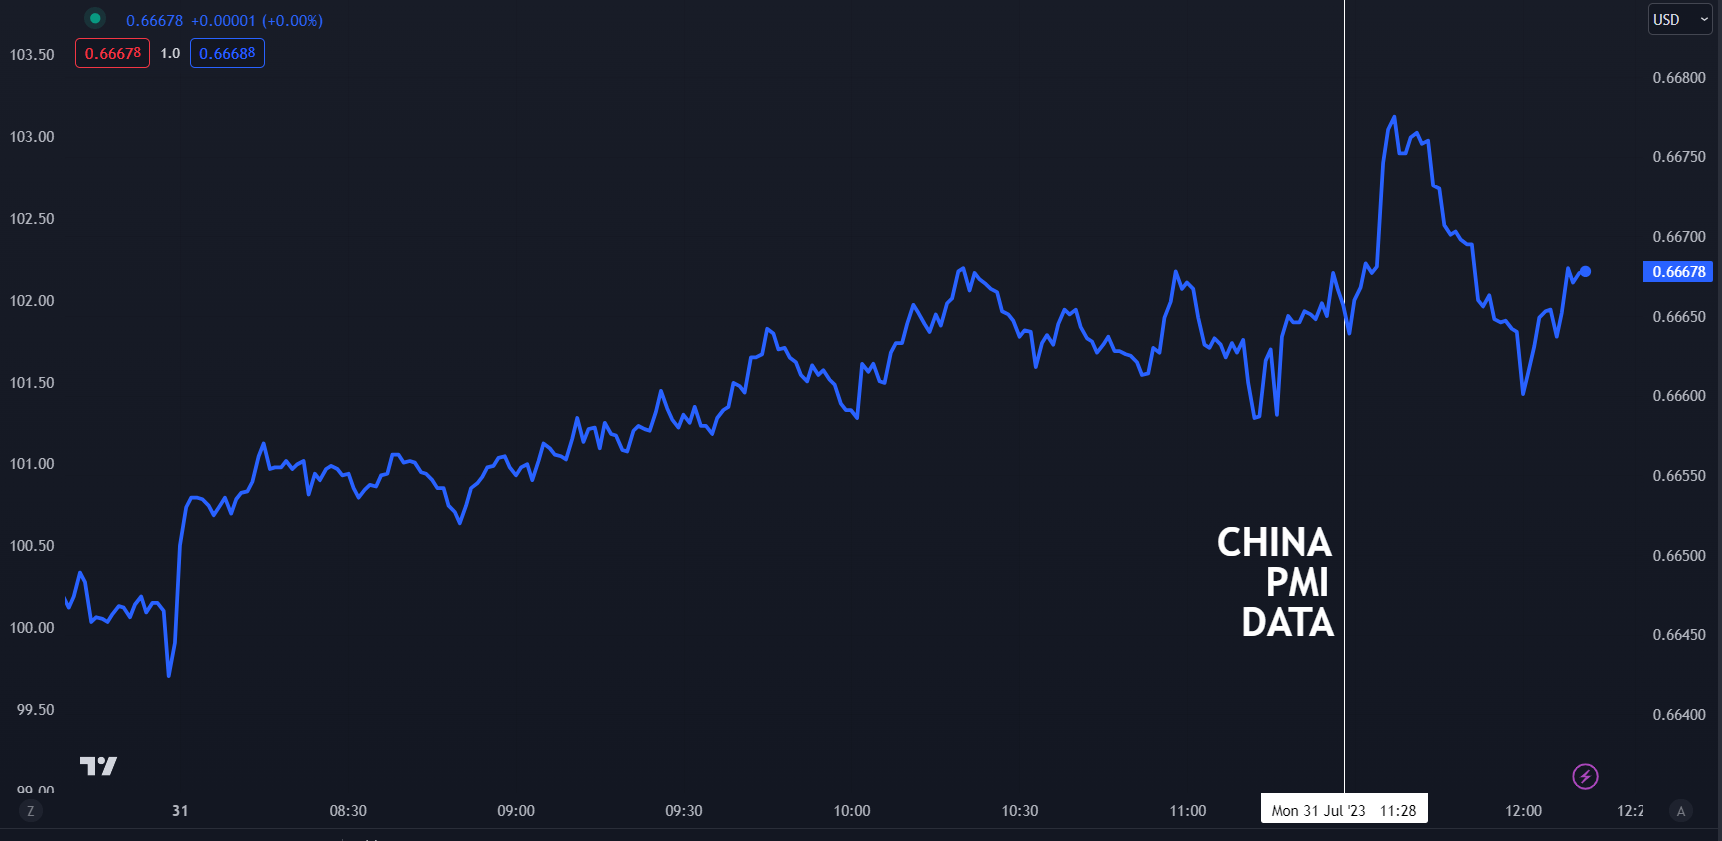
The Australian Dollar initially jumped after Chinese manufacturing PMI beat forecasts before settling back to near where it started.

The data appears to have provided some optimism that the world’s second-largest economy might be able to reignite growth as it re-emerges out of the pandemic era.

Chinese manufacturing PMI for May printed at 49.3 against the 48.9 anticipated and the non-manufacturing came in at 51.5, rather than the 53.0 forecast. This combined to give a composite PMI read of 51.1 against 52.3 previously.

The market tends to place more emphasis on manufacturing PMI due to the wider implications for economic activity.

The China PMI indices are the result of a survey of 3,000 manufacturers across China, mostly large firms. It is a diffusion index, so a reading over 50 is viewed as a positive of the economic outlook for the Middle Kingdom.

Earlier today, the Peoples Bank of China (PBOC) set the Yuan reference rate at 7.1305 below market estimates of 7.1532.

Hong Kong’s Hang Seng (HSI) and mainland China’s CSI 300 indices made a 2-month high after the data on the back of a solid rally last week.

While the data boosted the prospects for Australian exporters, a focus for Aussie Dollar traders this week will be Tuesday’s Reserve Bank of Australia’s (RBA) monetary policy meeting. There is degree of uncertainty about whether or not they will tighten rates or not.

A Bloomberg survey of economist is only marginally in favour of a 25 basis point hike but the interest rate futures market see only a very minimal chance of a lift in the cash rate.

AUD/USD PRICE REACTION – 1-MINUTE CHART

image1.png

AUD/USD TECHNICAL ANALYSIS

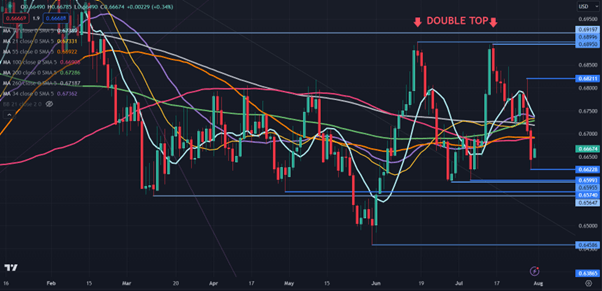
Although AUD/USD collapsed last week it remains in the five-month trading range of 0.6459 – 0.6900.

The medium-term bearishness unfolded after a Double Top was formed as mentioned here at the time.

The selloff on Friday saw the price move below all-period daily Simple Moving Averages (SMA). This may indicate that more bearish momentum might evolve.

It is unusual for all these SMAs to lie in the tight band that they currently are between 0.6690 and 0.6740. Bulls would find more comfort if this band were overcome.

Resistance could be at the recent high near 0.6820 ahead of the prior peaks in the 0.6900 – 0.6920 zone ahead of possible resistance in the 0.7010 – 0.7030 area.

On the downside, support might be near the recent low of 0.6622 ahead of the previous lows of 0.6600, 0.6595, 0.6574 and 0.6565.


All eyes on China with subdued PMI and more stimulus measures: US dollar, Hang Seng Tech Index, AUD/USD

All eyes on China with subdued PMI and more stimulus measures: US dollar, Hang Seng Tech Index, AUD/USD

Market Recap

Another downside surprise in US core Personal Consumption Expenditures (PCE) price index paves the way for Wall Street to resume its rally last Friday (DJIA +0.50%; S&P 500 +0.99%; Nasdaq +1.90%) as promising inflation progress reaffirmed market expectations for a Fed rate pause.

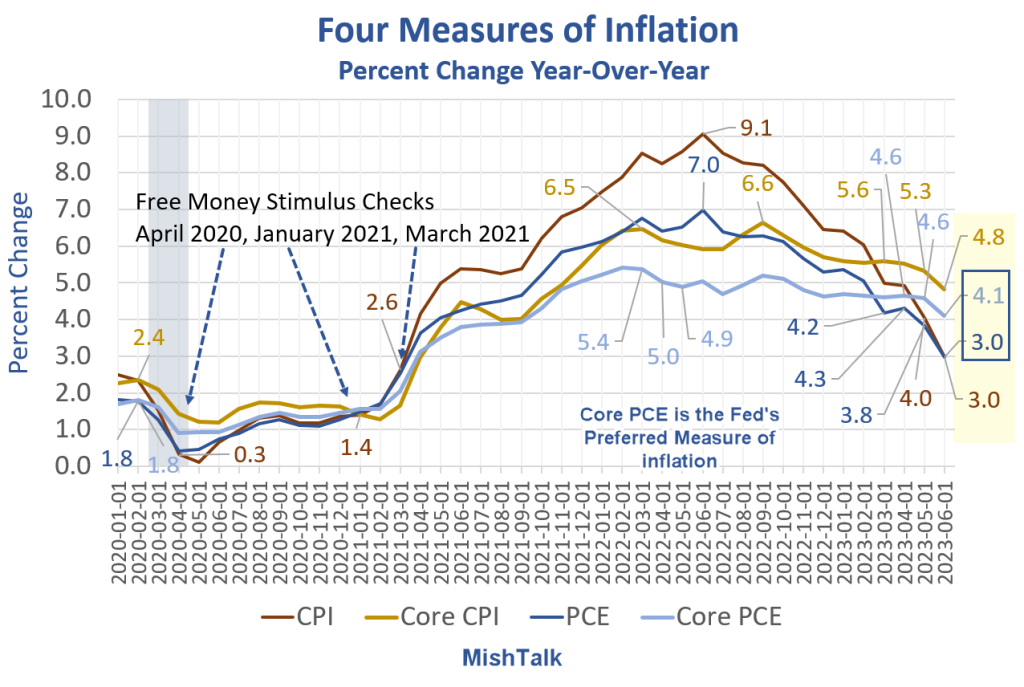
The core PCE index for June registered a 4.1% year-on-year increase (versus 4.2% expected), which is its second consecutive month of below-consensus read. Another closely-watched Fed’s inflation indicator, the 2Q employment cost index, also showed progress with a 1% read versus the 1.1% consensus. Overall, the confluence of moderating inflation and resilient US economic conditions continues to be supportive of soft-landing hopes.

The US 10-year Treasury yields ticked 5 basis-point (bp) lower after touching its key 4% level in an earlier session. One on the radar may be the US dollar, which has displayed some resilience last Friday despite the lower-than-expected inflation readings. Thus far, the US dollar has defended its 100.50 level but much may still await, given that the lower-highs-lower-lows has put a downward trend in place. The relative strength index (RSI) is also back at its key 50 level, which could draw some sellers given that the dollar index has not been able to sustain above the 50 level since mid-June this year. The 100.50 level may remain as immediate support for some defending ahead.
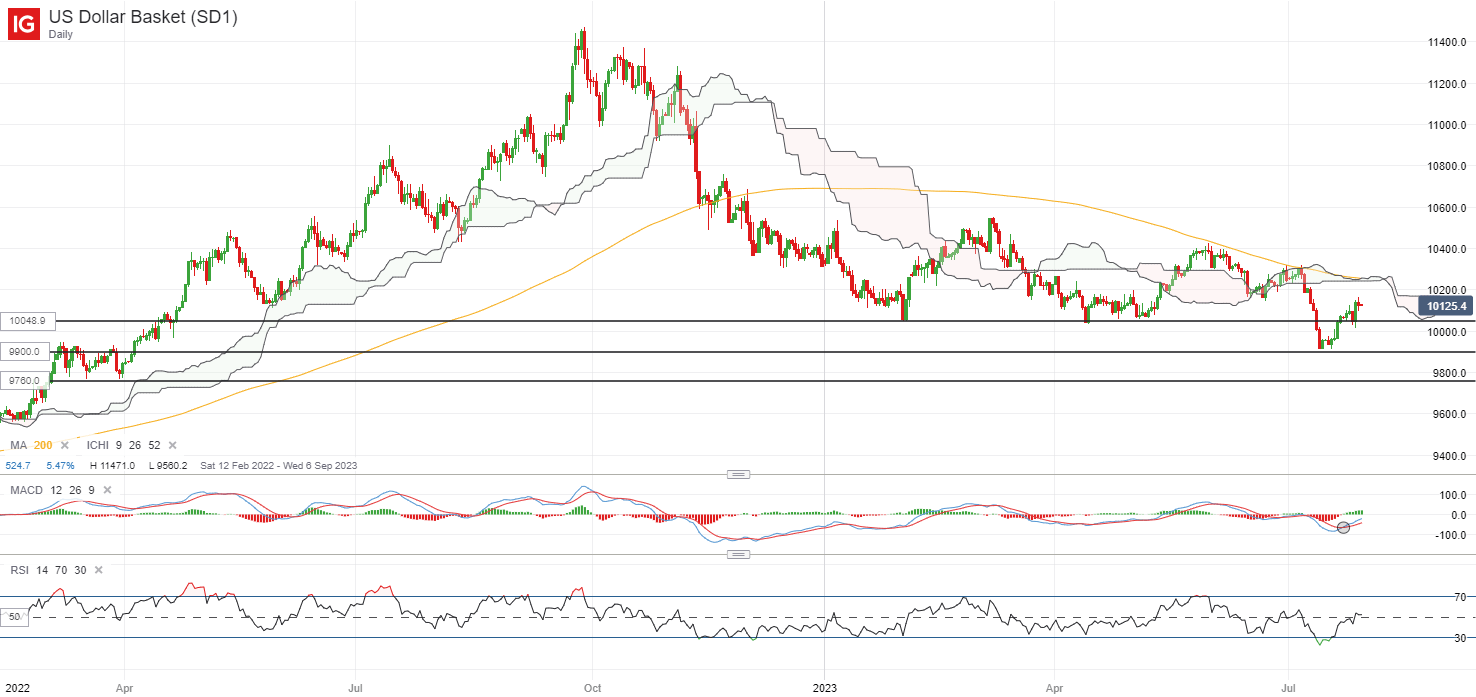
image1.png

Asia Open

Asian stocks look set for a positive open, with Nikkei +1.80%, ASX +0.24% and KOSPI +0.88% at the time of writing. Japanese 10-year bond yields continue to head higher to touch the 0.6% mark this morning, following the slight change to the Bank of Japan (BoJ)’s tone around its yield curve control (YCC) policy last week. While market participants seem to take comfort with the policy flexibility involved with the recent tone change, the higher risk-free rate has failed to dent the appetite in Japanese equities.

China’s Purchasing Managers’ Index (PMI) releases today came with another round of subdued read, with its manufacturing PMI at 49.3, a tick higher than the 49.2 consensus but nevertheless, still marked its fourth straight month of contraction. Reopening momentum for its non-manufacturing sector has tapered off quickly as well, with the non-manufacturing PMI coming in below expectations for the fourth straight month (51.5 versus 52.9 consensus).

The weak readings will further justify recent efforts by authorities to lift China’s growth picture, as market participants tread on some cautious optimism this morning, with the look-ahead to the upcoming new measures to boost consumption later today.

The Hang Seng Tech Index has displayed a minor inverse head-and-shoulder pattern lately, with a retest of the neckline last Friday met with a strong bullish move. Further upside may place the 4,812 level on watch next for a retest, where its previous reopening tailwind forms a peak back in January this year. Buyers have been taking some control lately, with its RSI defending the 50 level, along with a bullish crossover formed between its 50-day and 100-day moving average (MA). On the downside, the neckline at the 4,276 level may serve as immediate support.
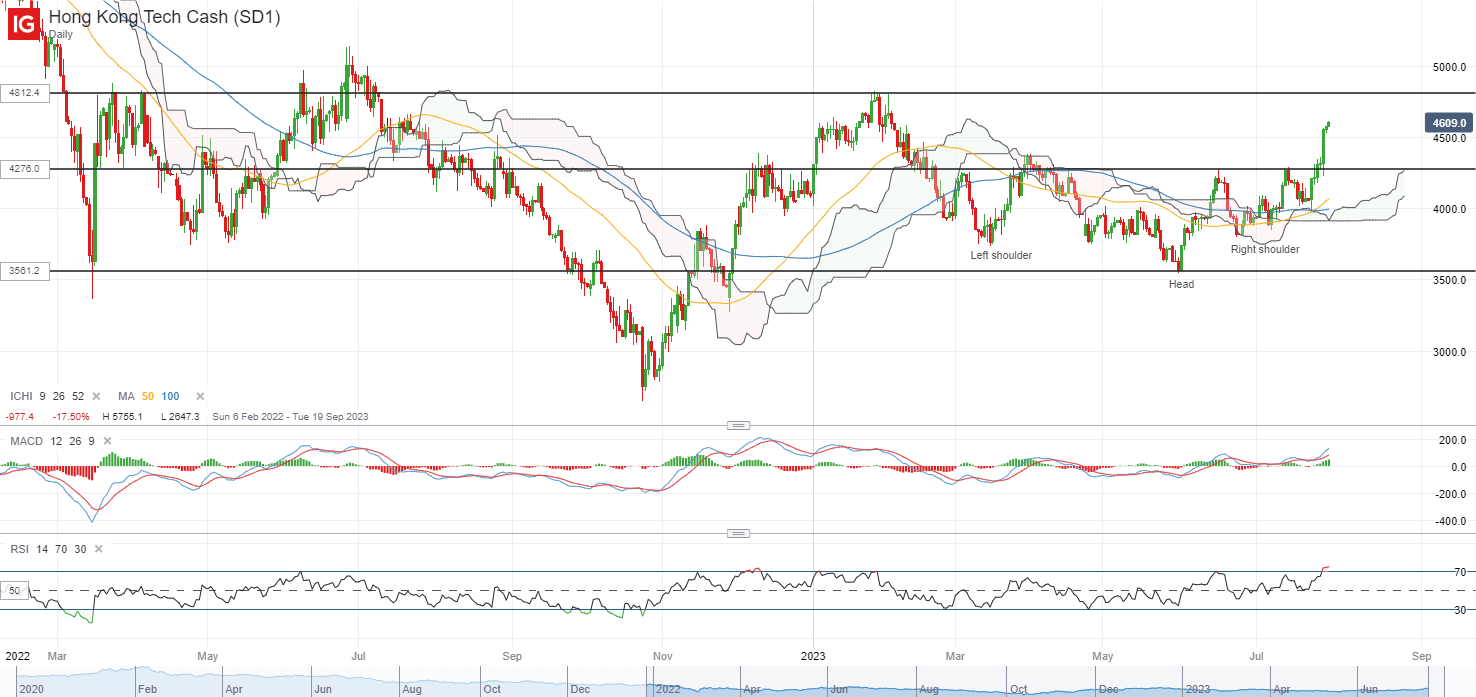
image2.png

On the watchlist: AUD/USD on watch ahead of China’s stimulus, Reserve Bank of Australia (RBA) meeting

The AUD/USD has fallen by 3.7% over the past two weeks, as divergence in growth conditions between the US and Australia has been a key headwind for the pair, along with some firming in the US dollar lately. Thus far, past two interactions with the 0.690 level have not been met with a successful breakout, leaving a minor double-top pattern in place with the neckline support at the 0.659 level. On the upside, any positive reaction to the upcoming China’s stimulus announcement could leave the 0.678 level on watch for a retest, but greater conviction for the bulls may still have to come from a move above the key 0.690 level.

Given the downside surprise last week in Australia’s inflation (6% year on year versus 6.2% expected) and retail sales (-0.8% versus 0.0% expected), further wait-and-see are being priced for the upcoming RBA meeting. But with market rate expectations still pricing for a higher terminal rate at 4.35% (versus current 4.1%), guidance from the central bank will likely be the key focus.
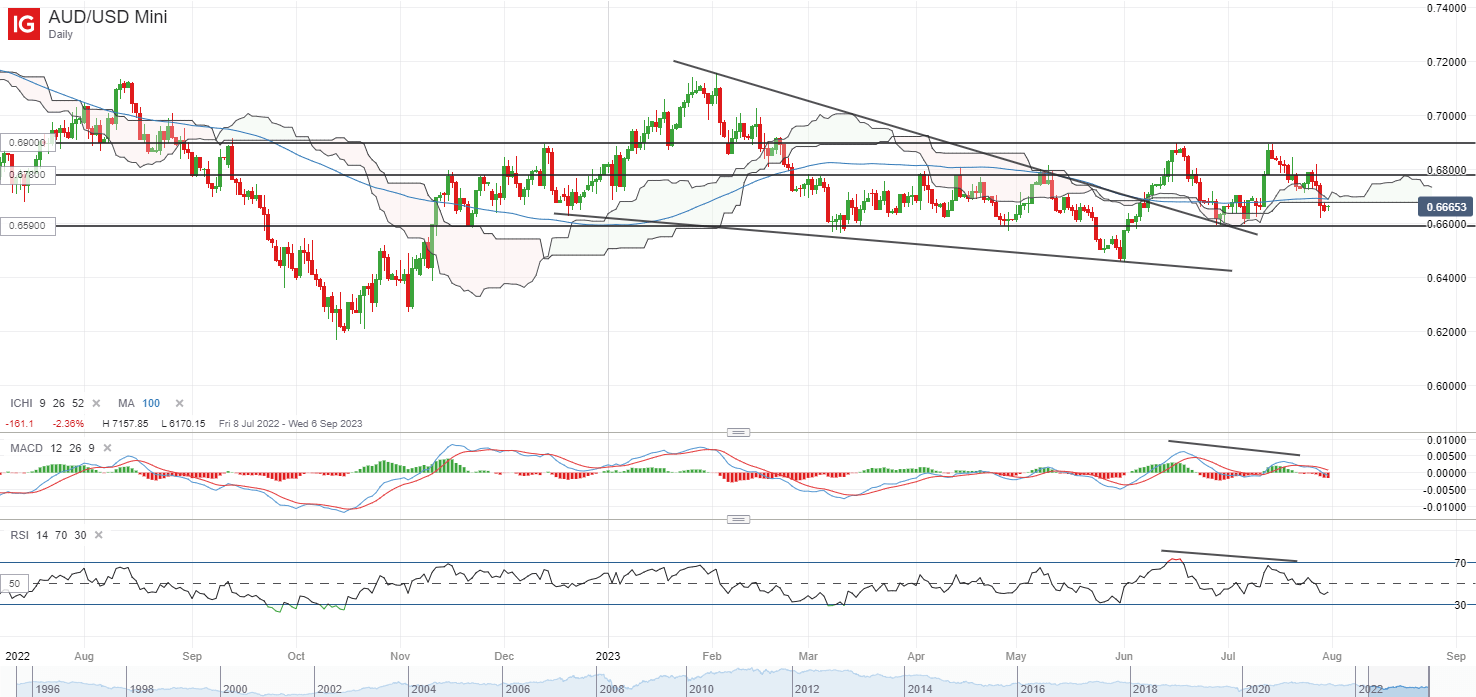

image3.png


US Dollar Gains as Yields in JGB and Treasury Markets Rise. Where to for USD?

US Dollar Gains as Yields in JGB and Treasury Markets Rise. Where to for USD?

The US Dollar has found strength to start the week against most major currency pairs except for the Aussie and Kiwi Dollars after some firm Chinese PMI data.

image1.png

The market tends to place more emphasis on manufacturing PMI due to the wider implications for economic activity. Some economists had been anticipating a print below 49.0.

A rosier outlook for China led to some growth-linked parts of the region getting a boost. Korea’s KOSDAQ and the Hang Seng China Enterprise indices led the way, adding over 2% today. The broader Hang Seng Index (HSI) made a 3-month high.

Gold dipped lower toward US$ 1,950 on the stronger USD and crude oil also eased. The WTI futures contract is a touch above US$ 80 bbl while the Brent contract is near US$ 84.40 bbl at the time of going to print.

On Sunday, Minneapolis Federal Reserve President Neel Kashkari appeared on US television and seemed to slightly step back from his previously strongly hawkish perspective.

He said that inflation was heading in the right direction but that the labour market might have to pay the cost of bringing price pressures down. Treasury yields are up a couple of basis points across most of the curve.

The 10-year Japanese Government Bond (JGB) traded at its highest yield since 2014 above 0.60%.

The move comes hot on the heels of Friday’s Bank of Japan adjustment to yield curve control (YCC). The Bank announced an unscheduled bond-buying program today of 300 billion Yen in the 5-to-10-year part of the yield curve.

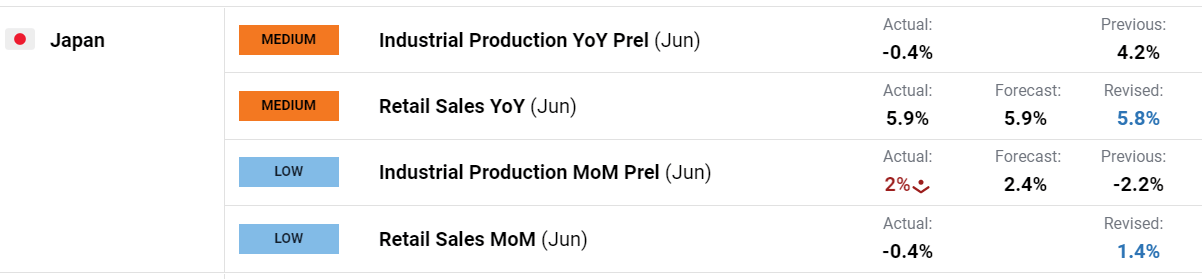
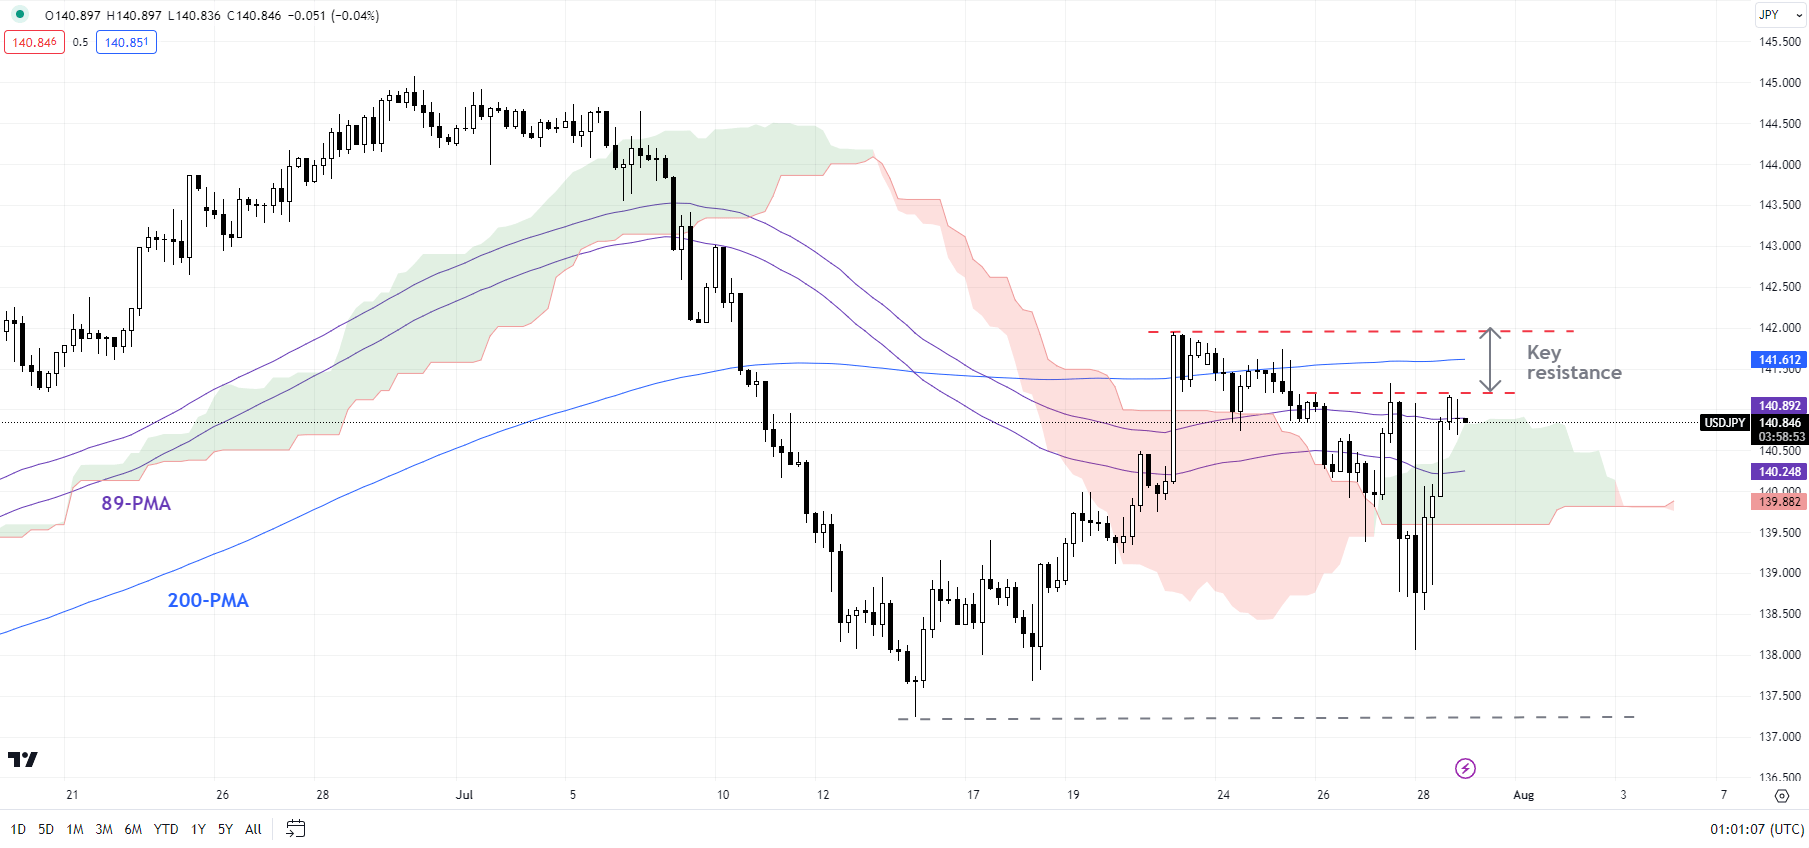
The Japanese Yen has been the biggest underperformer today with USD/JPY once again heading toward 142.00. There was mixed data out of Japan with retails sales beating forecasts while industrial production was underwhelming.

image2.png

Euro-wide GDP and CPI data will be released today. Tomorrow will see the Reserve Bank of Australia (RBA) make a decision on monetary policy ahead of the Bank of England on Thursday.

DXY (USD) INDEX TECHNICAL ANALYSIS

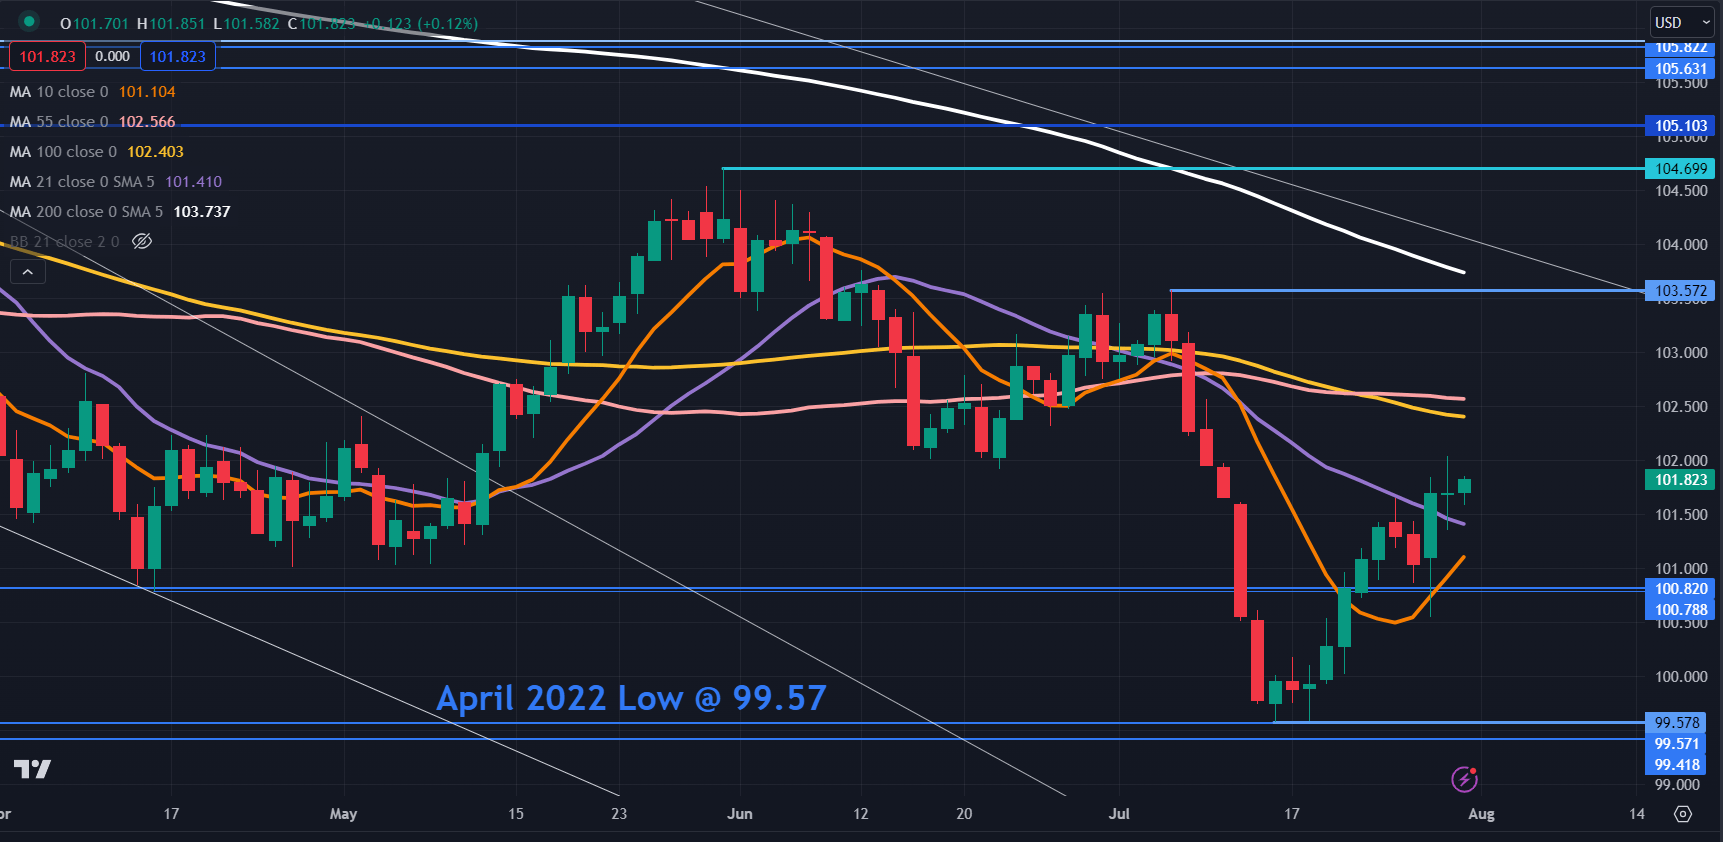
The DXY (USD) index steadied again today after making a 2-week high last Friday.

It remains above the 10- and 21-day simple moving averages (SMA) and that may indicate short-term bullish momentum could further evolve.

The next level of resistance might be at the 55- and 100-day SMAs in the 102.40 – 102.60 area. The 103.60 – 103.70 zone may also offer resistance with a prior peak and the 200-day SMA in that area.

Support could be at the breakpoint zone near 100.80 or below at the 15-month low of 99.58 which was just above the April 2022 low of 99.57.

image3.png


Japanese Yen After YCC Tweak; Has the Trend Changed in USD/JPY, AUD/JPY, EUR/JPY?

Japanese Yen After YCC Tweak; Has the Trend Changed in USD/JPY, AUD/JPY, EUR/JPY?

At its meeting on Friday, the BOJ maintained the band around the JGB 10-year yield of +- 0.5% with the yield target of around 0%. However, the Japanese central bank adjusted the rate at which it offers the fixed-rate purchase operations for consecutive days, from 0.5% to 1.0%, effectively signaling its willingness to allow the JGB 10-year yield to rise temporarily above the 0.5% upper bound. For more discussion see “Japanese Yen Drops as BOJ Keeps Policy Unchanged: What’s Next for USD/JPY?”, published July 28.

With BOJ committed to keep broader policy settings unhanged until it achieves 2% inflation target in a stable and sustained manner, the sharp rebound in USD/JPY suggests the YCC tweak is probably not viewed as a monetary tightening signal but managing the yield curve framework sustainably amid an environment of rising global yields.

USD/JPY Daily Chart

image1.png

USD/JPY: Testing the top end of the recent range

On technical charts, USD/JPY is holding above vital converged cushion at the mid-July low of 137.25, roughly coinciding with the lower edge of the Ichimoku cloud on the daily charts. While this support remains intact, the early-July slide can be viewed as consolidation within the interim uptrend (since the start of the year) at best.

USD/JPY 240-minute Chart

image2.png

On the 4-hourly chart, USD/JPY is so far holding above a crucial barrier at 141.50-142.00, including the 200-period moving average and the July 21 high of 142.00. USD/JPY needs to clear this resistance for the seven-month-long uptrend to remain intact.

AUD/JPY 240-Minute Chart

image3.png

AUD/JPY: Rebounds from key support

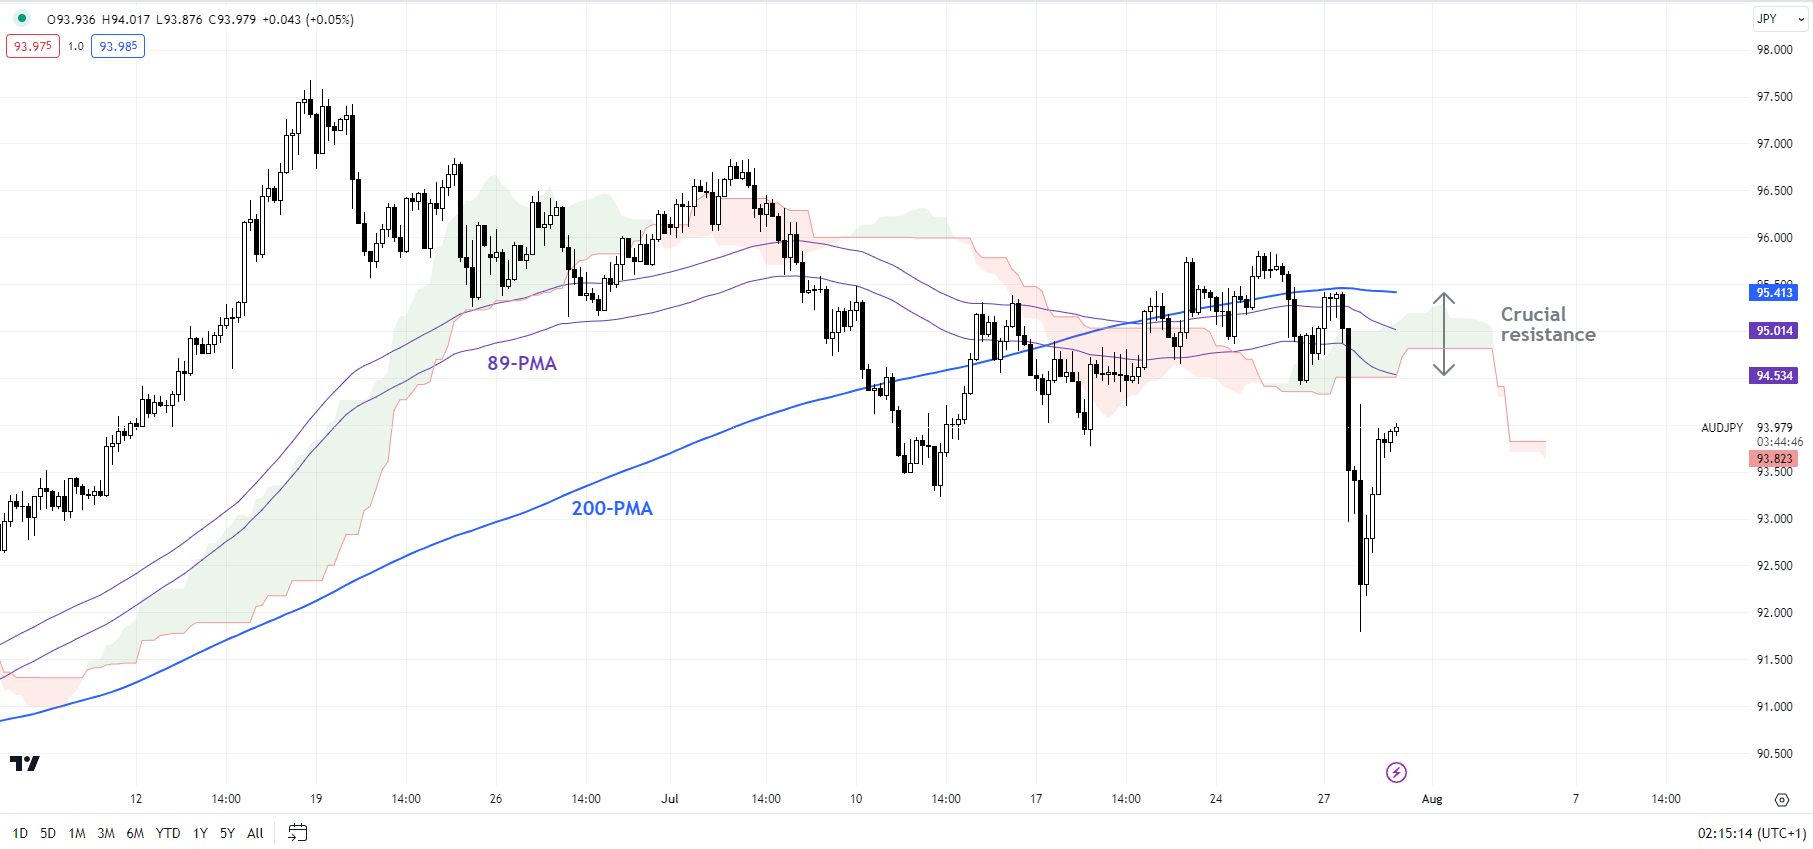
The lower-top-lower-bottom sequence since late June indicates that the near-term bias for AUD/JPY is down. For the immediate downtrend to reverse, AUD/JPY needs to rise above the stiff ceiling at 95.50-96.00, including the 200-period moving average on the 4-hour chart, and the last week’s high of 96.00. Until then, the rebound from Friday looks corrective at best.

EUR/JPY 240-Minute Chart

image4.png

EUR/JPY: Watch resistance

EUR/JPY has now run into a tough barrier at 156.00-157.00, including the last week’s high of 156.25 and the upper edge of the Ichimoku cloud on the 240-minute charts. A rise above the resistance area would reaffirm the near-term trend to range, prevailing since late June.