Japanese Yen Drops as BOJ Keeps Policy Unchanged: What’s Next for USD/JPY?

Japanese Yen Drops as BOJ Keeps Policy Unchanged: What’s Next for USD/JPY?

The Japanese yen dropped against the US dollar after the Bank of Japan’s (BOJ) kept its ultra-loose policy settings and maintained the cap on the JGB 10-year yield but said it would guide yield curve control more flexibly to respond to upside and downside risks.

The BOJ maintained the band around the JGB 10-year yield band of +- 0.5% with the yield target of around 0%. Earlier Friday, the Nikkei reported BOJ will discuss tweaking its yield curve control policy at today’s board meeting by letting long-term interest rates rise beyond its cap of 0.5% by a certain degree. The proposed change would keep the rate ceiling but allow for moderate rises beyond that level.

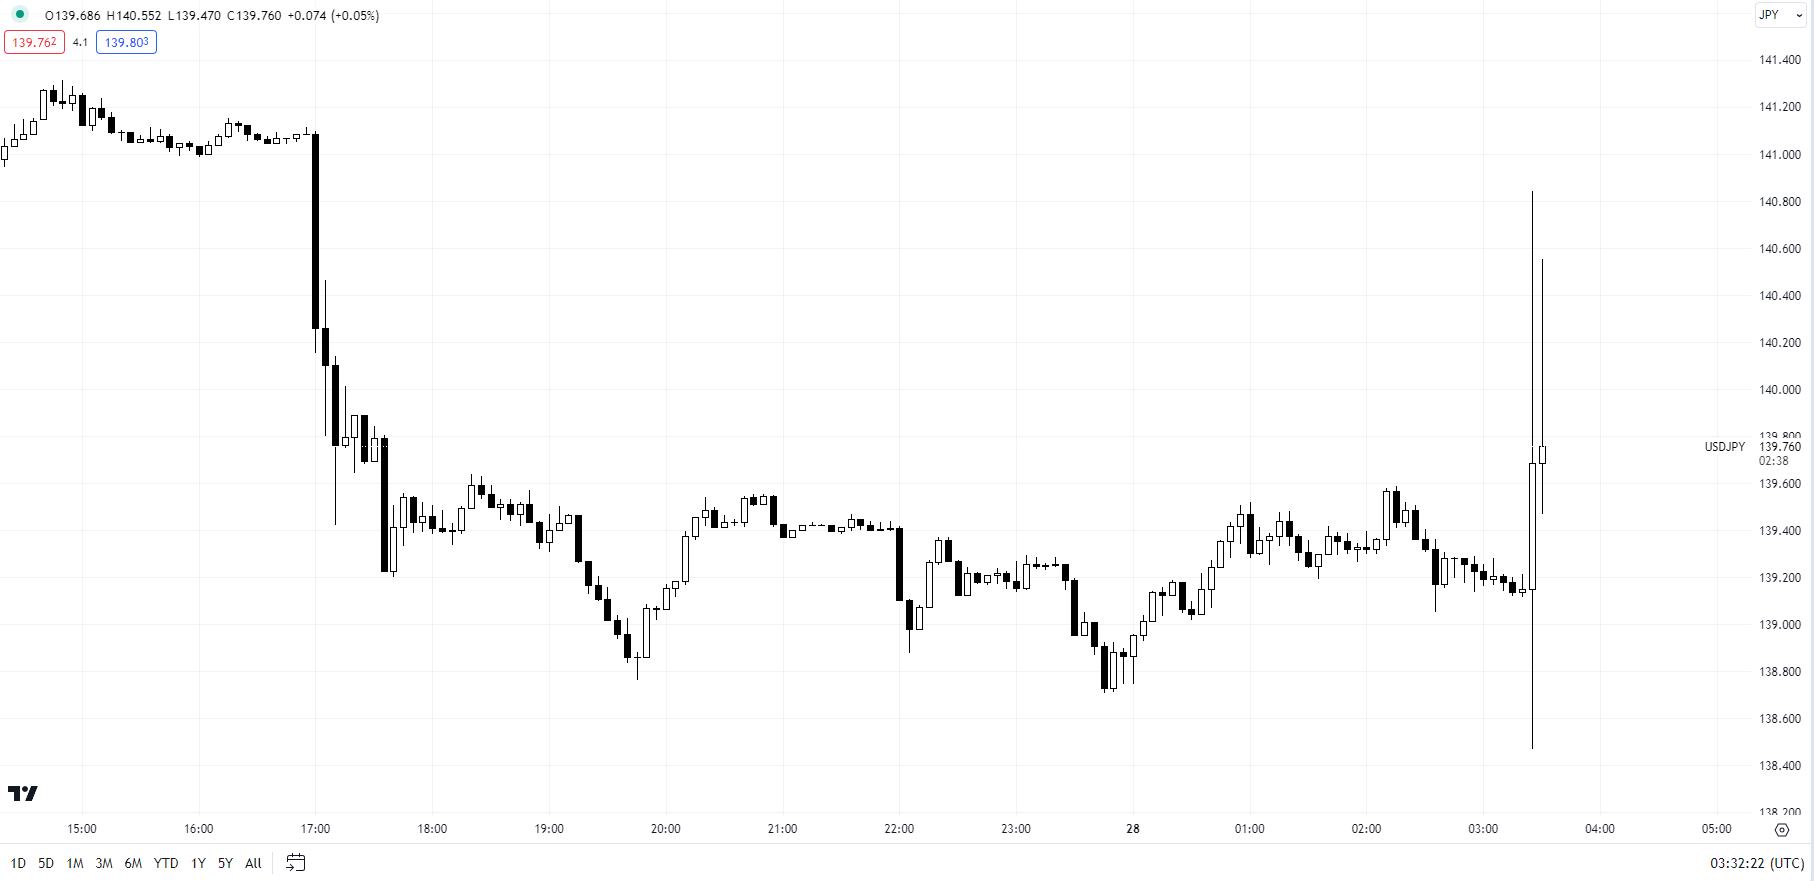
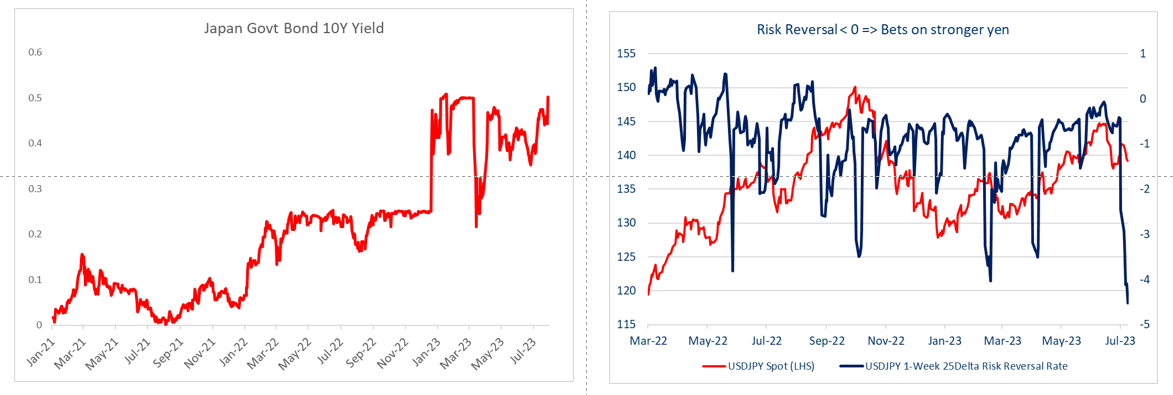
As a result, before the BOJ rate decision announcement, USD/JPY fell sharply, one-week 25-delta risk reversals slipped further in favour of JPY calls, and the Japan 10-year government bond yield hit jumped above BOJ’s cap of 0.5% in reaction to the report. Post the policy announcement, USD/JPY has reversed its earlier loss.

USD/JPY 5-Minute Chart

image1.png

The Japanese central bank was widely expected to keep its policy settings unchanged at today’s meeting as policymakers wait for more evidence of sustained price pressures. The key focus on fresh quarterly projections and discussions regarding phasing out the controversial yield curve control (YCC) policy after BOJ summary of opinions at the June policy meeting quoted one board member saying the central bank should debate tweaking YCC to improve market function and mitigate its “high cost”.

JGB 10-Year Yield and USD/JPY Risk Reversals Before BOJ Policy Decision

image2.png

BOJ Governor Kazuo Ueda has said the central bank expects inflation to slow below 2% toward the middle of the current fiscal year, but the country’s corporate price-setting behaviour was showing changes that could push up inflation more than expected.

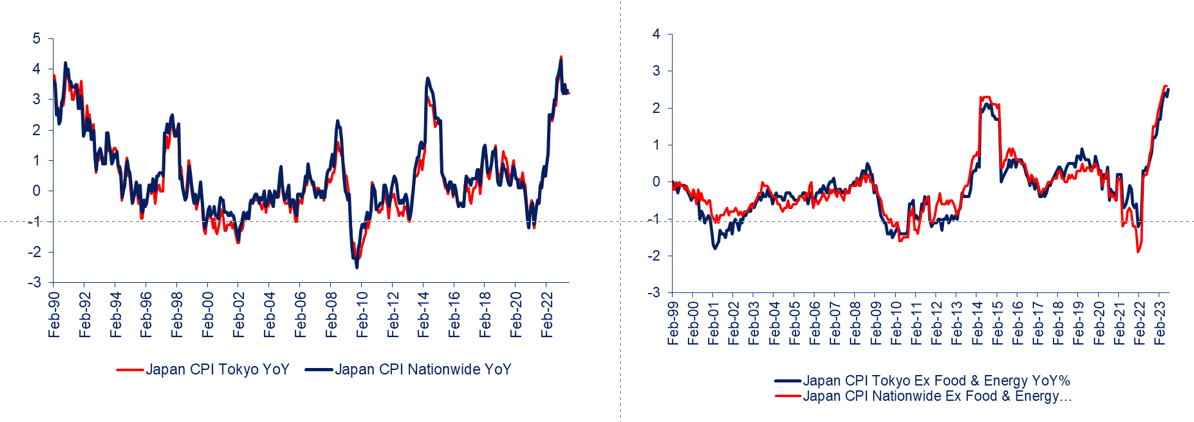
Data released early Friday showed Tokyo’s core inflation hit 3.0% on-year in July Vs 2.9% forecast. Nationwide core CPI rose 3.3% in June from 3.2% in May. The so-called core-core inflation gauge (which excludes both food and energy) slowed to 4.2% on-year from 4.3% in May.

Japan Inflation

image3.png

Going forward, the still-wide interest rate differentials between Japan and the rest of the world could continue to weigh on the yen. However, the prospect of the BOJ nearing the end of the ultra-easy policy is likely to keep the downside in JPY supported.

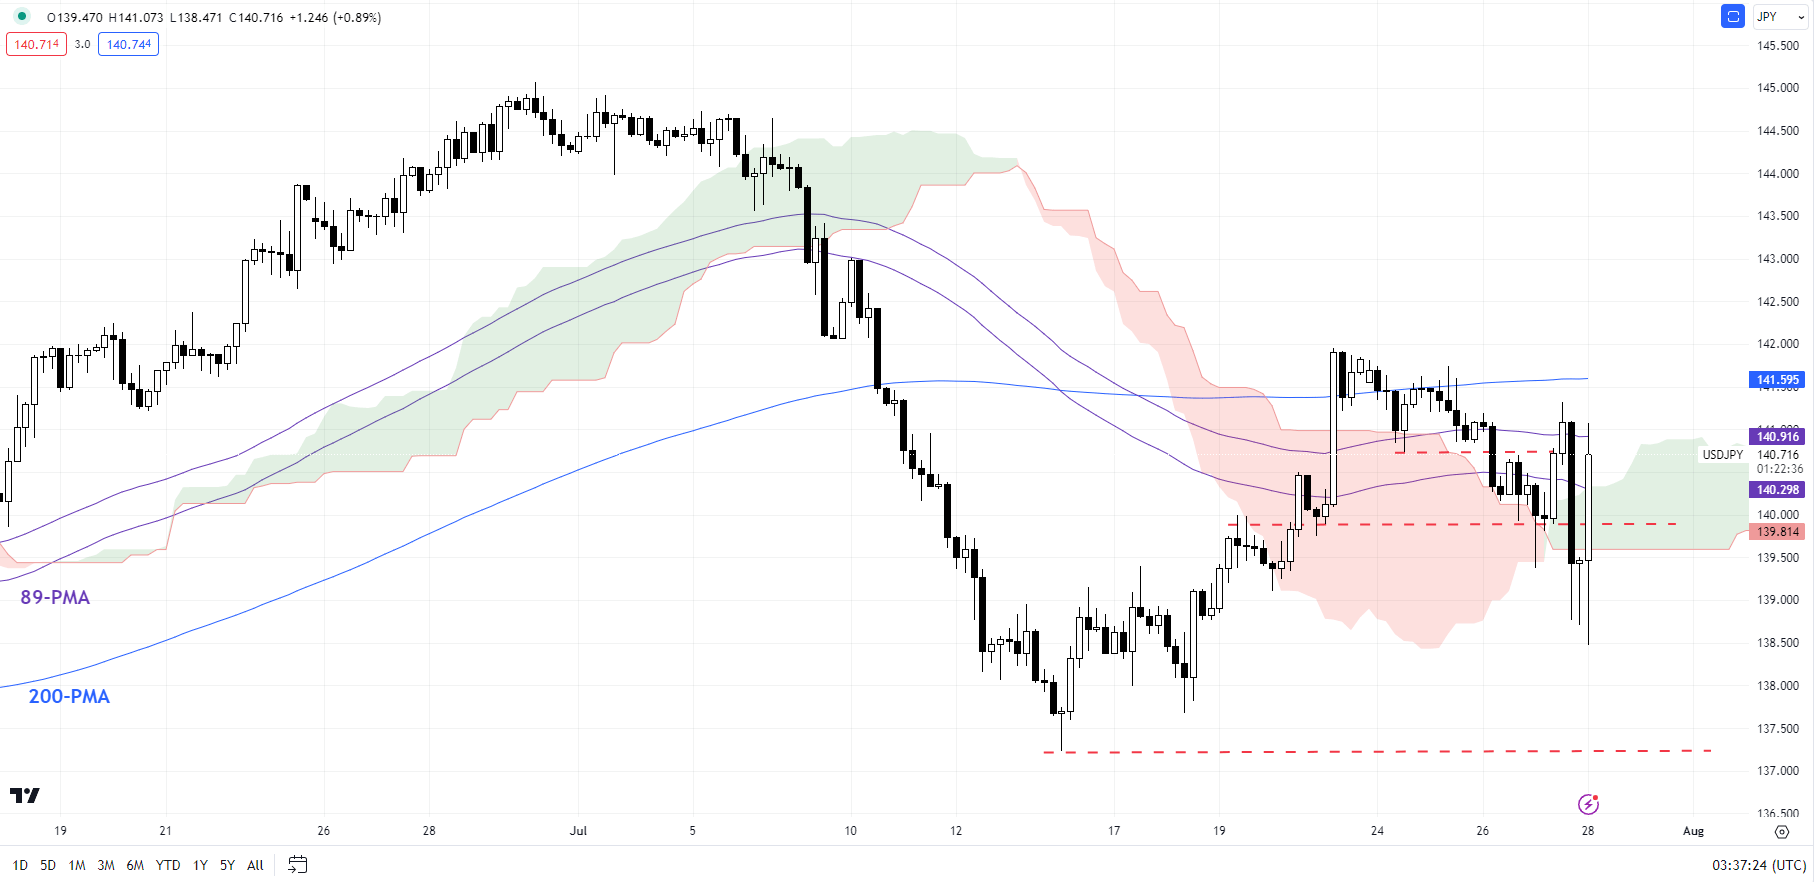
USD/JPY 240-Minute Chart

image4.png

On technical charts, USD/JPY would need to clear Thursday’s high of 141.30 at the very least for the immediate downward pressure to fade. That’s because the fall below the mid-July low of 140.00 has raised the odds that USD/JPY’s rally since the middle of the month is reversing.

This follows Wednesday’s fall below the Monday’s low of 140.75, raising the chances of a false move higher last week. For more on this, see “US Dollar Scenarios Ahead of Fed Rate Decision: EUR/USD, GBP/USD, USD/JPY Price Setups,” published July 26, and “US Dollar Slips After Fed Rate Hike: What Has Changed for EUR/USD, GBP/USD, USD/JPY?”, published July 27. USD/JPY risks a drop toward the July 14 low of 137.25.

Japanese Yen Drops as BOJ Keeps Policy Unchanged: What’s Next for USD/JPY?

US Dollar in the Crosshairs as BoJ Tilts Post ECB and Fed Decisions. Lower USD/JPY?

The US Dollar steadied against most currencies today except for the Japanese Yen. The Bank of Japan (BoJ) cajoled the market toward higher yields in the backend of the Japanese Government Bond (JGB) market.

DailyFX Strategist Tetsuya Kimata, based in Tokyo, made these observations.

“I think the BOJ has shown a dovish stance even though the Bank adjusted Yield Curve Control (YCC). In their inflation forecast, they revised the 2023 CPI forecast to 2.5% from 1.8%.

They also revised down their 2024 forecast to 1.9% from 2.0% but kept its 2025 forecast to 1.6%. This would indicate that the BOJ would like to continue monetary easing. The market has reacted with JPY appreciation and a sharp drop in NKY.

I think this market reaction would be temporal.”

A deeper dive into the BoJ announcement can be read here. Their decision comes on top of the Fed and the ECB tightening policy in the last 2 days.

While the Yen has been the biggest currency gainer today, the Aussie Dollar has been undermined by PPI and retail sales missing estimates.

In general, markets are recalibrating going into the weekend after an action-packed week.

Monetary policy is now at a crossroads with the Fed making it clear that future decisions will be data dependent. The previously well telegraphed rate decisions are now consigned to history.

Going forward, major central bank meetings appear likely to be anticipated with a high degree of uncertainty.

Gold is oscillating around US$ 1,950 an ounce while the WTI futures contract is under US$ 80 bbl and the Brent contract is a touch below US$ 84 bbl at the time of going to print.

Looking ahead, after a stack of European CPI data, Canada will see GDP figures for May.

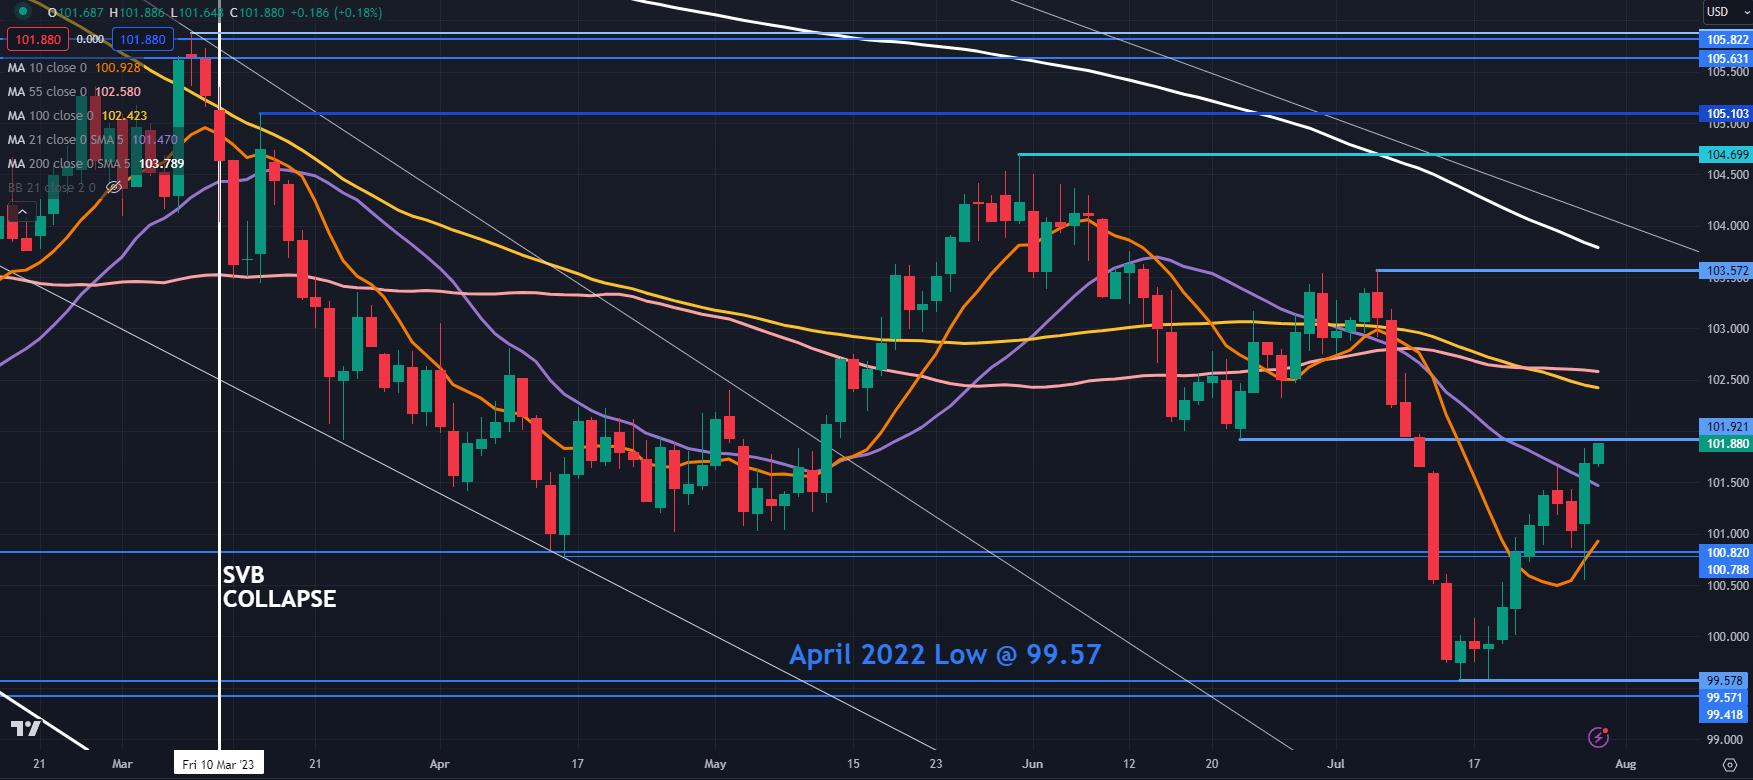
DXY (USD) INDEX TECHNICAL ANALYSIS

The DXY (USD) index made a 2-week high today after a wild range on Thursday.

It has cleared the 10- and 21-day simple moving averages (SMA) and that may indicate short-term bullish momentum could be unfolding.

Near-term resistance might be at the breakpoint of 101.92 ahead of the 55- and 100-day SMAs in the 102.40 – 102.60 area.

Support could be at the breakpoint zone near 100.80 or below at the 15-month low of 99.58 which was just above the April 2022 low of 99.57.

image1.png


The Mystery of Bearish Engulfings: Do they Reliably Predict Forex Price Reversals?

The Mystery of Bearish Engulfings: Do they Reliably Predict Forex Price Reversals?

A Bearish Engulfing (BE) is a candlestick pattern that can be identified when looking at virtually any financial trading instrument. All you need is an opening, high, low and closing price. As implied by the name, technicalists will often use these as signals that an upward-trending market might be readying to reverse. But as you might have heard past performance is not always indicative of future results.

This is not a report about the intricacies of Bearish Engulfings: which you may learn more about here. Rather, the purpose of this educational content is to test their effectiveness using price and price alone. This will come from the foreign exchange market (forex). At the end of the article, I will go over the key takeaways and some of the limitations of this study. In the meantime, let us set some ground rules.

Identifying Bearish Engulfings – EUR/USD, GBP/USD, USD/JPY, AUD/USD, USD/CAD

Almost 37,000 candles were analyzed between EUR/USD, GBP/USD, USD/JPY, AUD/USD and USD/CAD using daily data since 1995 from TradingView. One of the reasons why I chose the foreign exchange market is because of its unparalleled liquidity, especially amongst the major pairs. This helps produce smoother price action compared to other markets, such as stocks and cryptocurrencies.

How did I identify Bearish Engulfings? It was based on a set of rules I coded to search over each candle to recognize if it was valid. For this study, I focused on a near-term horizon, which translates to 20 days before and after an engulfing. In total, there are too many rules to go over. Instead, let us look at some of the most important ones:

Bearish Engulfing Detection Rules

  1. The Bearish Engulfing body must meet a minimum size requirement, it cannot be too small
  2. The body of the candle before the BE (the pre-candle) cannot be too small relative to the BE body
  3. Rather than the pre-candle low, the BE must close under the pre-candle open
  4. Before the BE, there must be the appearance of an uptrend (no downtrends or flat price action)
  5. The pre-candle close must also be a 20-day high close, with some cautious room for error

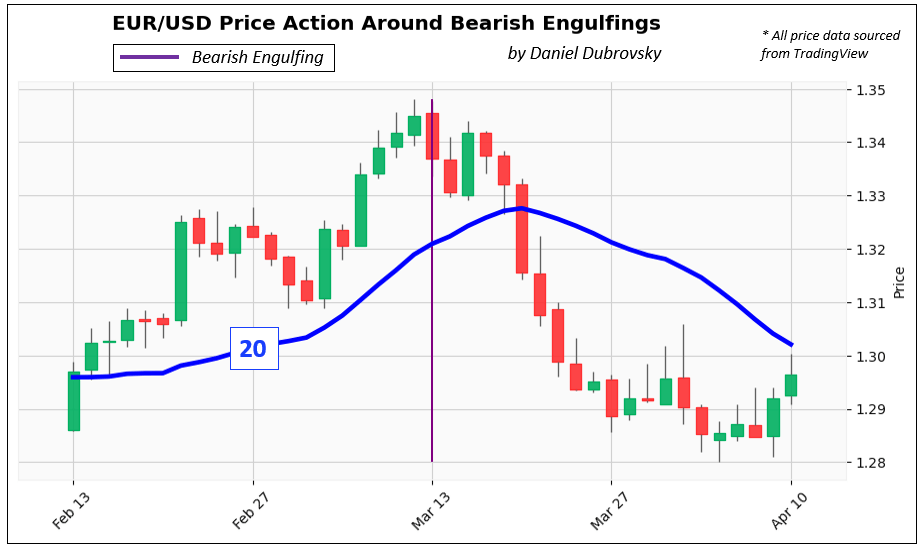
Limitations to these rules and subjectivity will be discussed at the end of this report. In the meantime, the chart below is an example of a detected EUR/USD Bearish Engulfing pulled on March 13th, 2005. This serves as an example of a clean one. Notice how the price was trending higher before the BE and the pre-candle close was a 20-day high close. After the BE, the price turned lower as one would expect.

In total, the code detected slightly over 200 Bearish Engulfings from a possible almost 37,000 candles. Of course, not all of them were as clean as the one below. If you would like to watch how some of the other cases appeared, I highly encourage you to check out this link to a Twitter thread I made that displays some of the Bearish Engulfings in each pair.
Identifying Bearish Engulfings – EUR/USD

37,000 Candles, Over 200 Bearish Engulfings, How Do the Trends Look Like?

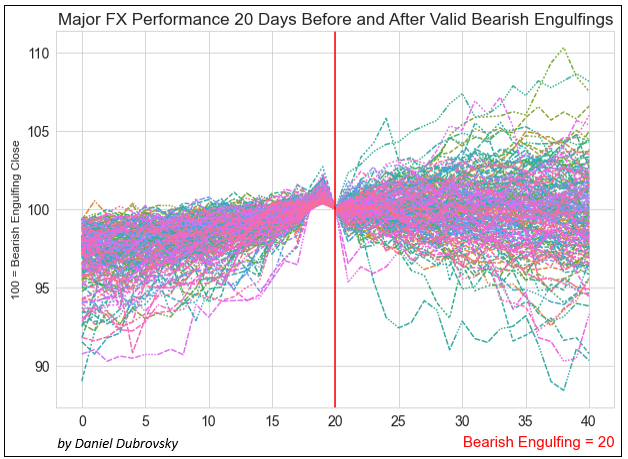
Below is a chart that plots each Bearish Engulfing trend 20 days before and after its appearance. To make sure that every trend was in the same scale range, each BE (close) was indexed to 100 as a starting point.

In the period leading into the BE, you can see how the trends were rising with a consistent pattern and range. Then, the day before the BE was always the peak. This is what creates the dip into the BE, which represents the close under the pre-candle.

What happens after the Bearish Engulfing? The trends continue for 20 days and with each passing period, spread out in a cone or triangle-like fashion. The right side also exhibits a larger dispersion of prices (variance) than the left, with a wide range of peaks and troughs. At first glance, this speaks to randomness and pours cold water on the idea of Bearish Engulfings as consistent reversal signals. But we need to take a closer look.
37,000 Candles, Over 200 Bearish Engulfings, How Do the Trends Look Like?

How Does the Average Bearish Engulfing Trend Look Like?

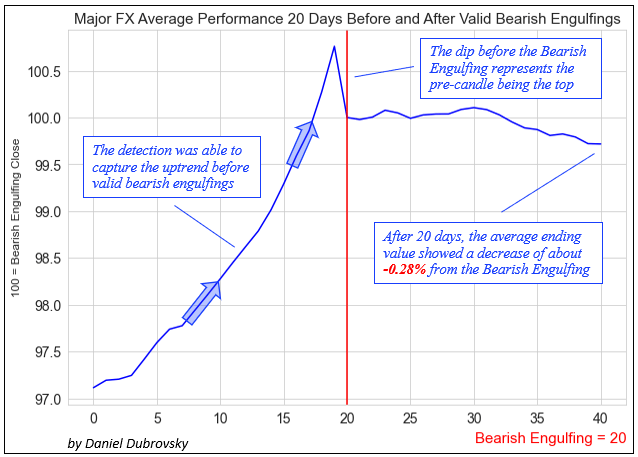
That is where the next chart comes in, which is the average Bearish Engulfing trend. This visualization confirms that the code was able to consistently capture the uptrend before the BE. Just like with the previous chart, you can see the top right before the BE before the price fell to 100, representing the dip into the engulfing. After the engulfing, prices continued lower, finishing -0.28% on average 20 days after the BE. So, it appears that there is a slight downward bias in the post-BE trend. I would argue that this is not the most important takeaway from this analysis.
How Does the Average Bearish Engulfing Trend Look Like?

Bearish Engulfings: Reversal or Topping Signal?

The last chart overlays the average Bearish Engulfing series, with the percentage of trends that closed below the pre-candle for each day. For example: after 5 days, 71% of trends remained below the pre-candle close. After 10 days, this number shrank to 66%, then rose to 68% on the 15th day and finally ending at 65% on the 20th day. In other words, on average, about two-thirds (2/3) of trends remained below the top after one month.

Here is a fun fact: after 20 days, the ending price observations created a statistically significant normal distribution. This means we can alternatively use a Cumulative Distribution Function (CDF) to calculate the probability of a series in this sample finishing below the top. And just like with the results mentioned earlier, that clocks in at roughly 65% as well.
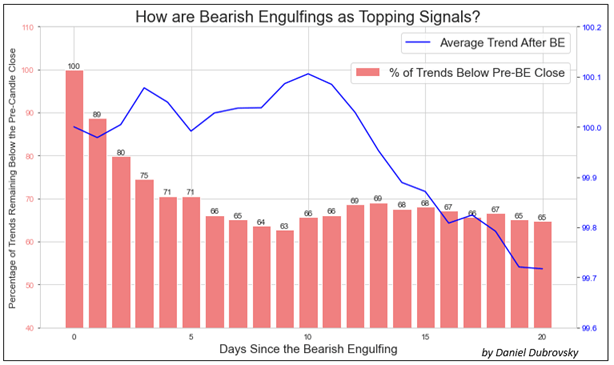
Bearish Engulfings: Reversal or Topping Signal?

What’s the Verdict on Bearish Engulfings?

After analyzing almost 37,000 candles between EUR/USD, GBP/USD, USD/JPY, AUD/USD and USD/CAD, identifying at least 200 Bearish Engulfings, it seems that this candlestick pattern functions better as a topping signal than a reversal one. While the average trend finished almost -0.3% after 20 days, 2/3 of them remained below the top. In other words, if we can identify valid Bearish Engulfings in this market, it might be worth paying attention to. But, let us go over some study limitations.

Study Limitations

While Bearish Engulfings can be observed universally between markets, understand that a specific subset of the forex market was analyzed for this study, and it might be the most relevant to the pairs studied. Furthermore, this is based on a sample of a little over 200 Bearish Engulfings. More might be needed to enhance the validity of this study, (or even disprove it).

As much as I tried to keep this study as objective as possible, there is some inherent subjectiveness in technical analysis. For example, while most people can universally agree on the dimensions of a Bearish Engulfing and how they appear, the background in which they form is more fluid. In this sample, I considered if the BE closed under the pre-candle open and not the pre-candle low. Some may debate that the latter is more proper.

Another important factor is the timeframe. This was conducted on daily data, but you could theoretically analyze different layers of time horizons. That also includes the duration you measure before and after the engulfing. This study was focused on near-term price action, but you could also analyze broader trends, such as 40 days before and after the Bearish Engulfing.


AUD/USD Price Forecast: Double Top Breaks Aussie Dollar

AUD/USD Price Forecast: Double Top Breaks Aussie Dollar

AUSTRALIAN DOLLAR FUNDAMENTAL BACKDROP

The Australian dollar continues its depreciation against the US dollar this Friday morning as fundamental divergence between the two regions supplement the move. Yesterday’s robust US GDP & durable goods orders figures bolstered the greenback while this mornings miss on Australian retail sales data (see economic calendar below) extended the AUD selloff.

Later today, the US core PCE price index release will be at the center of everyone’s mind being the Fed’s preferred measure of inflation. With estimates expected to fall, this may negate any hawkishness from yesterday’s data as well as reducing stagflation concerns. Michigan consumer sentiment rounds off the trading week and may provide some assistance for the USD should actual data fall in line with forecasts.

AUD/USD ECONOMIC CALENDAR (GMT +02:00)

image1.png

Source: DailyFX economic calendar

Money markets still expect another interest rate hike from the Reserve Bank of Australia (RBA) possibly in late 2023/mid 2024 but if Australian economic data maintains its current trajectory, there is room for a dovish repricing that may weigh negatively on the pro-growth currency.


image2.png

TECHNICAL ANALYSIS

AUD/USD DAILY CHART

image3.png

Daily AUD/USD price action supports my prior analysis of a 0.6700 retest which has since played out dipping below both the 50-day (yellow) and 200-day (blue) moving averages respectively. Bears now look to set their sights on the 0.6596 swing low/0.6600 psychological handle coinciding with the double top (blue) neckline.

Key resistance levels:

  • 0.6772
  • 200-day MA
  • 0.6700/50-day MA

Key support levels:

  • 0.6596
  • 0.6565
  • 0.6500

IG CLIENT SENTIMENT DATA: BEARISH

IGCS shows retail traders are currently net LONG on AUD/USD, with 76% of traders currently holding long positions. At DailyFX we typically take a contrarian view to crowd sentiment resulting in a short-term downside disposition.

International Trade Price Indexes, Australia, June 2023

International Trade Price Indexes, Australia, June 2023

Export price index

The main contributors to the fall were:

  • Coal, coke and briquettes (-20.6%), driven by lower demand for both thermal and metallurgical coal due to the rapid easing of global supply constraints amid falling demand,
  • Gas, natural and manufactured (-20.9%), driven by price falls in oil-linked contract and high European inventories placing further downward pressure on spot prices,
  • Metalliferous ores and metal scrap (-6.2%), due to a decrease in iron ore demand from China, as growth in their manufacturing and construction slowed, and
  • Crude fertilisers and minerals (-5.8%), driven by a fall in lithium prices, with long term contracts reflecting the cessation of subsidies on electric vehicles by the Chinese government in early 2023.

The main offsetting contributors were:

  • Gold, non-monetary (+6.4%), driven by stronger demand for the safe haven asset amidst ongoing geopolitical and economic uncertainty,
  • Sugars and Honey (+19.1%), driven by adverse weather conditions impacting production in major sugar producing nations, creating a surge in demand for Australian sugar, and
  • Meat and meat preparations (+3.8%), driven by a small uptick in demand from the lows of March quarter, alongside a depreciating Australian Dollar.

Export Price Index, all groups, quarterly movement (%)

Bar chart with 17 bars.
The chart has 1 X axis displaying Quarter.
The chart has 1 Y axis displaying Percentage change (%). Data ranges from -8.5 to 14.6.
End of interactive chart.

Through the year, the Export Price Index fell 11.2%. The main contributors were:

  • Coal, coke and briquettes (-35.2%), and
  • Metalliferous ores and metal scrap (-9.7%).

Import price index

The main contributors to the fall were:

  • Petroleum, petroleum products and related materials (-7.0%), driven by global recession fears leading to a demand side contraction for oil,
  • Fertiliser (excluding crude fertilisers) (-16.4%), driven by falling prices for natural gas and ammonia, which are key inputs to production, and
  • Chemical materials and products (-8.2%) driven by falling global insecticide and herbicide prices, as supply chains normalise and input costs moderate.

The main offsetting contributors were:

  • Specialised machinery (+5.6%), driven by annual price reviews reflecting strong inflationary pressures and increased input costs through 2022. This was further supported by a depreciating Australian dollar, and
  • Gold, non-monetary (+7.2%), driven by stronger demand for the safe haven asset amidst ongoing geopolitical and global economic uncertainty.

Import Price Index, all groups, quarterly movement (%)

Bar chart with 17 bars.
The chart has 1 X axis displaying Quarter.
The chart has 1 Y axis displaying Percentage change (%). Data ranges from -4.2 to 5.8.
End of interactive chart.

Through the year, the Import Price Index fell 0.3%. The main contributor was:

  • Petroleum, petroleum products and related materials (-27.3%).
AUD/JPY prints swing high ahead of BOJ: Asian Open Date – 27th July 2023

AUD/JPY prints swing high ahead of BOJ: Asian Open Date – 27th July 2023

Market Summary:

  • The Fed unanimously voted to hike their interest rate by the expected 25bp to 5.5%, but left the door open to further hikes with its ‘data-dependant approach’
  • Jerome Powell’s speech was deemed slightly less hawkish than anticipated judging from the market reaction,
  • Powell highlighted the importance of the June CPI report when he said “we will be looking to see if the signal from June CPI [of lower inflation] is replicated”, which keeps another hie on the tabe if it doesn’t decelerate quickly enough
  • Fed Funds continue to favour a hold in September with a 78% probability
  • A softer than expected set of inflation numbers from Australia sent AUD pairs broadly lower and the ASX above 7400, on renewed bets that the RBA will be able to hold rates again at their August meeting
  • Japan’s services price index was also softer than expected at 1.2% y/y (1.4% forecast, 1.7% prior), underscoring expectations for the BOJ to stand pat again on Friday
  • Business and consumer loans were also below expectations across the eurozone in further signs of a weak economy ahead of today’s ECB meeting

20230727moversCI

Events in focus (AEDT):

  • 11:30 – Australian trade balance data:
  • 11:30 – China’s industrial profits YTD: We’re not expecting this ship to suddenly turn around given the prior read was -18.8% y/y, but a slower contraction alongside this week’s news of incoming stimulus could soften the blow of the recent slew of underperformance of the economy
  • 22:15 – ECB interest rate decision: A 25bp hike is almost a given, but I doubt the ECB will provide a strong indication for their September decision, but we know it is not as certain as it was with some important members stating it was likely down to incoming data (which so far has nt been favourable for a hike)
  • 22:30 – US data dump: Durables, GDP,
  • 22:45 – ECB press conference
  • 00:15 – ECB President Lagarde speaks

Technically Speaking:

  • The US dollar index retraced lower for a second day, although found support just above the April low
  • USD/JPY retraced lower for a third day
  • AUD/USD formed a 2-bar reversal day (dark cloud cover) but it closed above the 200-day EMA after finding support just above the 200-day EMA. We may see a slight bullish follow through today but, overall, its next directional move seems ambiguous due to weaker USD and softer AU CPI
  • The Dow Jones Industrial (DJI) closed higher for a 13th consecutive day, a bullish sequence only seen once before in 1987 (yes, year of that big crash)
  • The Nikkei 225 is trying to turn higher in line with our bullish bias, since its doji (higher low) on Friday, and has held above Friday’s high since. A break above 32,900 assumes bullish continuation.
  • Hang Seng
  • The China A50’s 3-day rally has stalled just below 13,000, with the 13,088 high also a level to provide potential resistance. From here we’d like to see a pullback and evidence of a higher low above 12,666 to help improve the potential reward to risk for a long setup and move towards 13,500.
  • Gold rose for a second day and appears set for another crack at the highs around 1985. Any incoming weak data from the US can hopefully help makes its way to 2000.

ASX 200 at a glance:

  • The ASX 200 closed at a 5-month high during its most bullish day in nine
  • It finally closed above 7400 (but only just), and flat SPI 200 futures suggests there could be some noise around that level as the breakout currently lacks some conviction
  • 62.5% of ASX 200 stocks advanced, 29.5% declined, 8% were unchanged
  • As before, we’d prefer to remain nimble and seek only intraday setups


AUD/JPY daily chart:

It was the most bearish day in two weeks for AUD/JPY, as the Aussie was allowed to fall sufficiently against the yen thanks to softer CPI figures whilst the weaker US dollar helped support AUD/USD. Given the depth of yesterday’s candle, I suspect we’re heading towards another leg lower on the daily chart to at least July high / February low. Furthermore, the rally from the July low to the Monday’s high came in three waves, suggests it cannot be an impulsive move higher and that the market remains within a correction lower from the June high.

From here, bears could consider fading into moves towards Monday’s low ad target the lows around 93.50, with a break above Tuesdays high invalidating the bearish bias on the daily chart.

20230727audjpyFX


China: Further easing moves likely

China: Further easing moves likely

China is likely to continue prioritizing domestic factors in its monetary policy as the new central bank governor takes office, treating solid economic growth as a buffer against any lingering uncertainties resulting from United States’ monetary tightening, experts said on Wednesday.
There may be further easing moves, including a potential cut in the reserve requirement ratio, in the next month at the earliest as the Chinese economy needs more stimulus to bolster demand and stabilize market expectations, they said. The RRR refers to the proportion of money that banks must hold as reserves.
They commented after Pan Gongsheng, Party secretary of the People’s Bank of China, the nation’s central bank, was appointed on Tuesday as the central bank governor, succeeding Yi Gang.
Experts said one of the top tasks facing Pan as the central bank governor would be striking a delicate balance between strengthening monetary policy support for economic recovery and avoiding widening China-US monetary policy divergence, which could weaken the renminbi in the short term.
“China’s monetary policy mainly serves domestic economic targets. If the task of stabilizing economic growth needs the support of monetary policy, then measures like RRR cuts or interest rate cuts will be considered,” said Guan Tao, global chief economist of BOC International.
Guan said it remains highly uncertain when the US Federal Reserve will end interest rate hikes, and there may be another interest rate hike after July.
Against such a backdrop, further easing moves by China’s central bank could put pressure on the renminbi in the short term, but the currency would gradually stabilize as the nation’s economy gains a firmer footing, Guan said.
He said that the “fundamental determinant” of the renminbi exchange rate is the condition of domestic economic recovery.
According to market tracker Wind Info, the onshore renminbi had strengthened by 0.38 percent this week to 7.1515 against the dollar as of Wednesday evening after a high-level meeting released stronger-than-expected growth stabilization policy signals.
A meeting of the Political Bureau of the Communist Party of China Central Committee on Monday called for efforts to leverage the role of aggregate and structural monetary policy tools while keeping the renminbi exchange rate stable on a reasonable and balanced basis.
Ming Ming, chief economist of CITIC Securities, said the central bank is likely to implement an RRR cut to replenish the supply of liquidity in August as it is expected to prioritize boosting economic recovery and moderately ease monetary policy.
Meanwhile, tools to stabilize the renminbi exchange rate, such as the foreign exchange deposit RRR, may be used in due course, Ming said, adding that the country’s efforts to vitalize the capital market and adjust housing market policies will also help stabilize the renminbi.
Japan, Australia reaffirm cooperation in energy, emission cut areas

Japan, Australia reaffirm cooperation in energy, emission cut areas

TOKYO (Kyodo) — Japan and Australia reaffirmed their cooperation in energy security on Wednesday as concerns grow over a stable natural gas supply to the resource-poor Asian country following Canberra’s tightening of greenhouse gas emission controls.

Japan’s Economy, Trade and Industry Minister Yasutoshi Nishimura and Australian Climate Change and Energy Minister Chris Bowen held talks in Tokyo as energy security has become as critical as ever following Russia’s war with Ukraine, especially for countries such as Japan that rely heavily on energy imports.

“We are expecting that continuous development of reliable investment environment in the Australian liquefied natural gas and coal industries will also lead to deepening of bilateral cooperation in the clean energy field in the future,” Nishimura said at the outset of the meeting, which was open to the media.

The Australian energy minister said earlier in the day that the country will remain a “reliable energy supplier” for Japan, after Nishimura last month expressed concern over Canberra’s new rules restricting carbon emissions.

“We are committed to working with Japan, one of our most important partners,” Bowen said in his speech in Tokyo.

His remarks came after a new Australian law came into force on July 1, requiring new LNG facilities to be carbon neutral, while facilities already in operation need to lower their carbon emissions by 4.9 percent a year until 2030 and more after that year.

Japan imports more than 40 percent of its LNG from Australia.

While assuring that Australia remains committed to its energy exports to Japan, Bowen also said his country will endorse renewable energy solutions as a way to reduce carbon emissions.

Both countries plan to achieve net-zero emissions by 2050.

It will have “an extremely significant impact on Japan’s LNG business in Australia,” Nishimura said in a press conference last month, referring to the ongoing Barossa gas project off Australia’s Northern Territory, in which Japan has invested.

European Central Bank (ECB) Preview: 25bps and Done or More Hikes in the Offing?

European Central Bank (ECB) Preview: 25bps and Done or More Hikes in the Offing?

Central Banks take center stage this week with the Federal Reserve kicking things off with eyes now turning to the European Central Bank (ECB) and President Christine Lagarde. It’s been an interesting ride for the ECB in 2023 with positive signs at the beginning of year now finally starting to wane as the rate hike cycle appears to be bearing fruit.

Over the past week or so we have seen signs that the Euro Area is feeling the effects of the ECB hiking cycle as economic data continues to deteriorate. The poor data off late has reignited a debate about whether the ECB is hiking into a recession with some ECB policymakers for the first time in 2023 adopting a more neutral to dovish stance on the path moving forward. No matter the outcome of this week’s meeting, robust discussions and debates around the policy path moving forward are likely to dominate ECB proceedings for the foreseeable future.

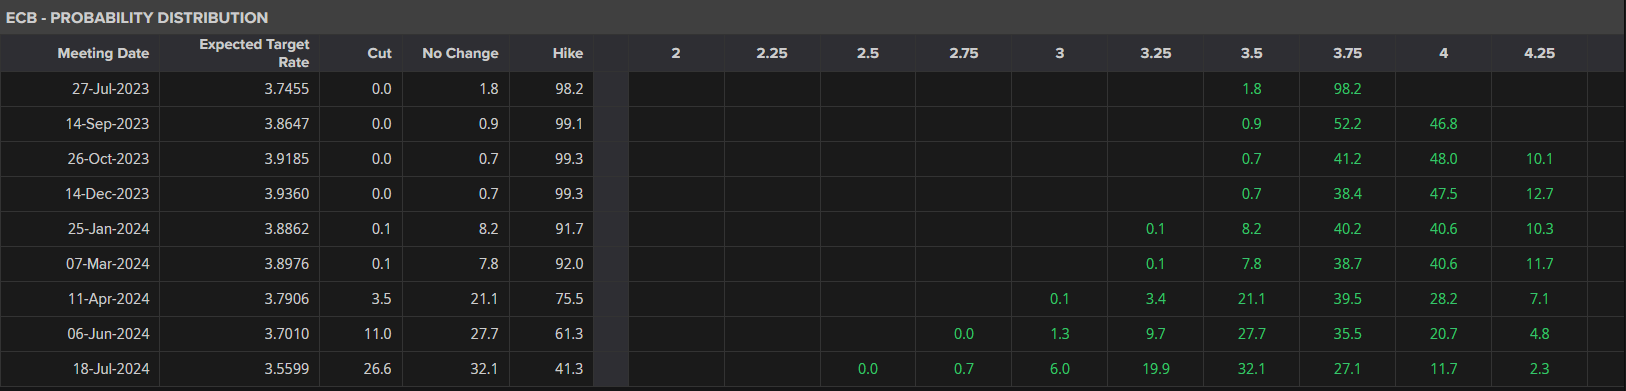
Looking at the rate hike probability distribution for the ECB below and markets are pricing in another 20bps (after the July meeting) of hikes by December 2023 before rate cuts in 2024, something which may factor into ECB President Lagarde’s comments on Thursday. The Euro is overvalued at the moment something which has been weighing on exports from the Euro Area.

image1.png

THE INFLATION, DISINFLATION STORY

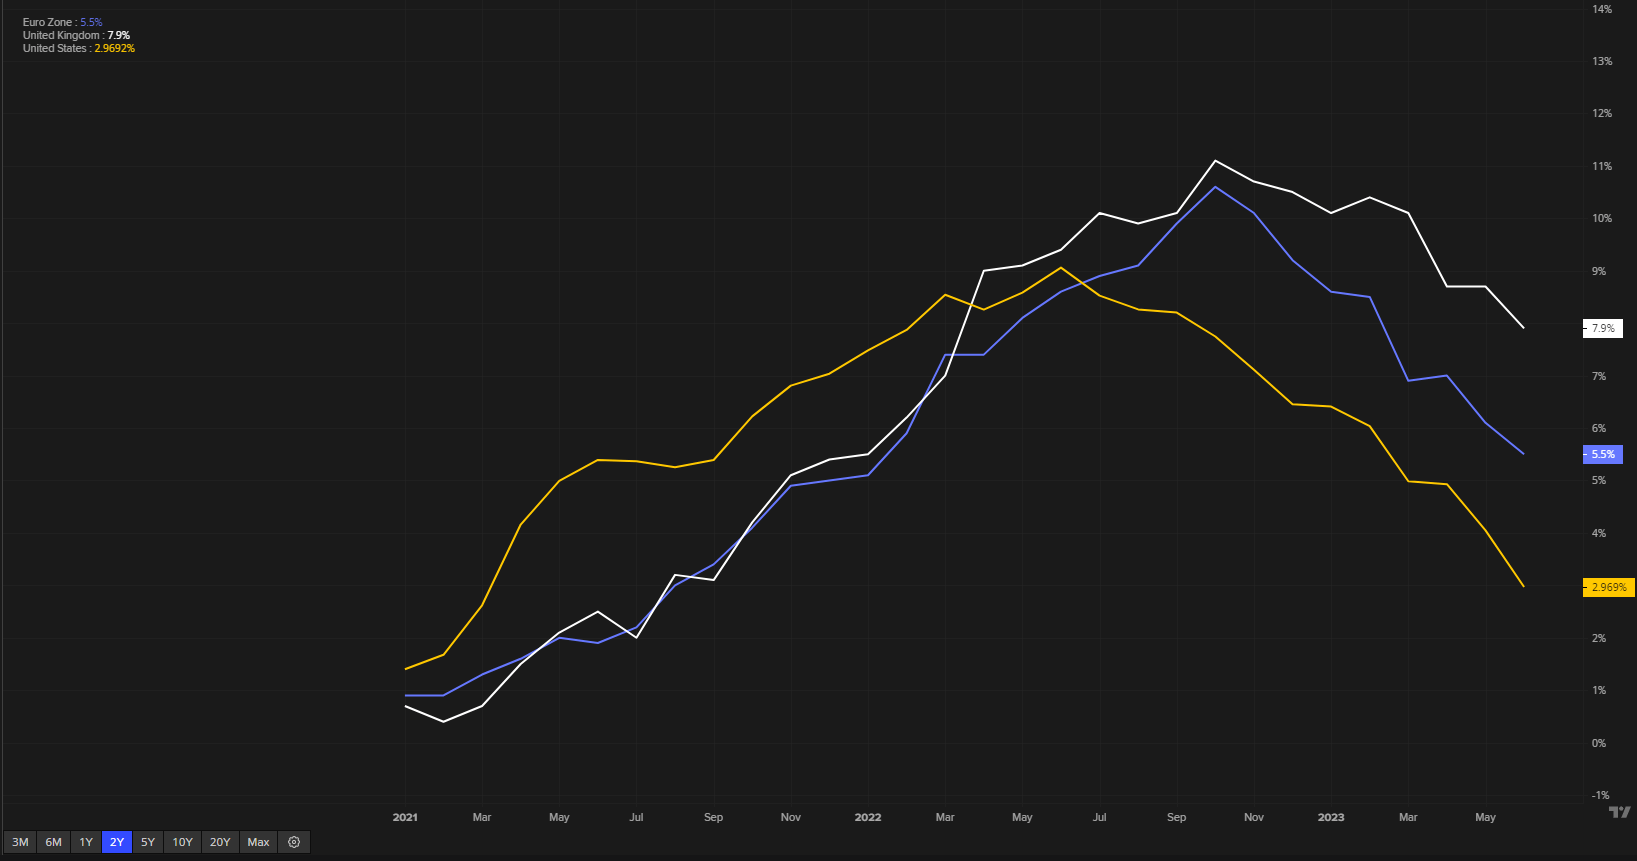
On the inflation front the Euro Area appears to be the front runner in combatting inflation with significant progress of late in comparison to the UK and the US. There is still work to do however with European Central Bank (ECB) President Lagarde leading the charge in getting inflation back under the Central Banks target. There have been signs that inflation could fall quicker than the ECB expect but that would likely occur toward the back end of Q3 heading into Q4 as the Summer season is likely to keep demand elevated for now and thus inflation as well.

Inflation in the UK, US and Euro Area

image2.png

The minutes of the previous ECB meeting hinted at robust discussions on the policy path moving forward with such discussion and debates likely to intensify as the ECB approaches its end goal. We are already seeing a change with certain policymakers hinting at a shift to data-dependency rather than any hawkish rhetoric or commitment to further hikes.

EURO AREA GROWTH CONCERNS

Monday this week started on a slightly sour note as Euro PMI data came in worse than expected while Tuesday morning brought another poor print in the form of German Ifo data. This has rekindled fears around a recession in the second half of the year and may give the European Central Bank (ECB) some food for thought as they plan the monetary policy path moving forward.

The IMF released updated forecasts yesterday as well upgrading Global Growth forecasts for 2023 to 3% from a previous 2.8%. However German GDP was revised down to a 0.3% contraction from a previous estimate of 0.1% as the Euro Area begins to feel the full effects of rate hikes over the past 12 months. The opportunity for further hawkish rhetoric does appear to be fading along with the Euro Areas growth prospects for 2023 with recent data around loans also painting a concerning picture. A pause in hikes after the July meeting is likely to depend on the data with a continued fall in inflationary pressures the desired result for the ECB and a sign that a pause may be in order.

POSSIBBLE SCENARIOS AND IMPACT

25bps Rate Hike with Dovish Tilt: a 25bps hike seems a certainty at this stage with the staff projections and overall rhetoric likely to have more sway. Whether the economic projections change following the recent spate of poor data remains to be seen. A dovish message from the ECB would come in the form of no commitment to a rate hike in September with a switch to data dependency, something we have heard from select ECB members of late.

25bps Rate Hike with Hawkish Tilt: a 25bps hike followed by continued concerns around core and service inflation prices with no real mention of data dependency as a guide moving forward could be viewed as hawkish on the part of the ECB. Such a move could provide the Euro with another jolt in the arm which should result in gains against major counterparts.

image3.png

TECHNICAL OUTLOOK

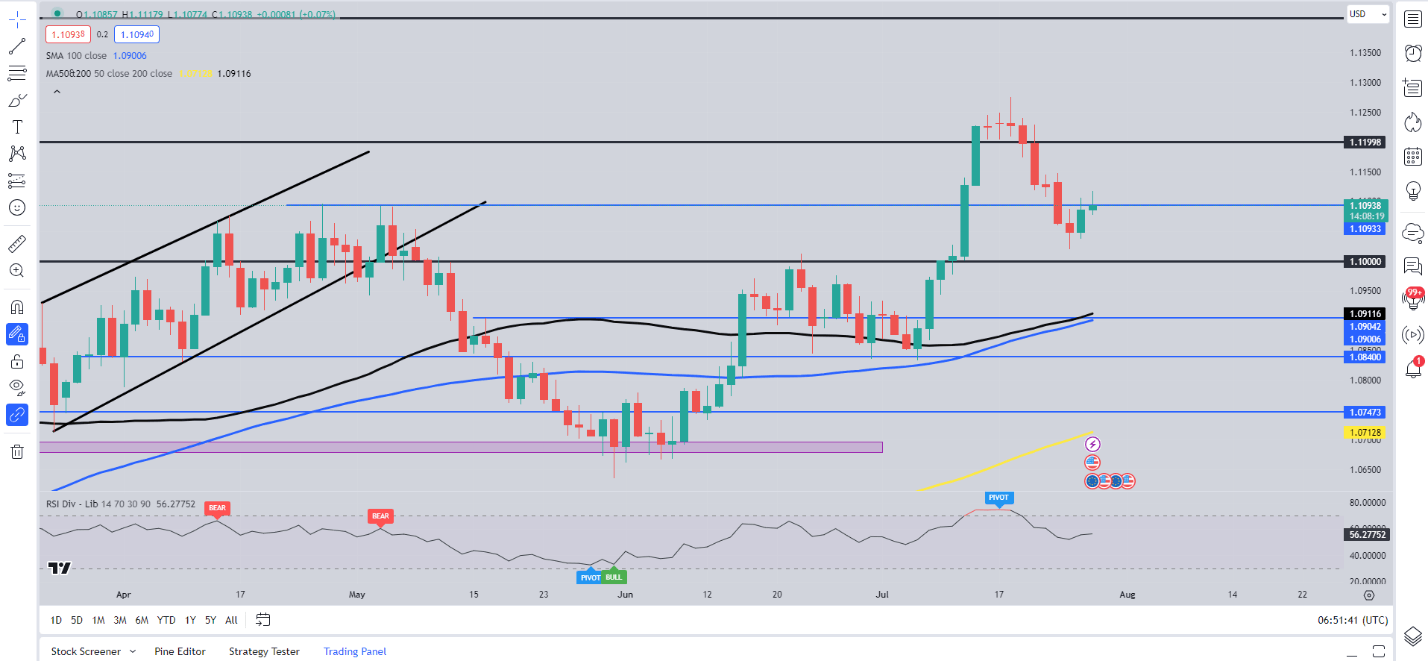
EURUSD from a technical perspective remain caught within a 250-pip range between the 1.1250 and 1.1000 handles at the moment with a bullish engulfing candle close yesterday hinting at the potential for a deeper retracement. Looking at the MAs and it may be something to keep an eye on as the 100-day MA looks ready to cross above the 200-day MA in what would be a golden cross pattern, further evidence that the overall bullish momentum remains in play.

A break below the 1.1000 mark could see the 100 and 200-day MAs tested serving as support and could cap further downside. The 1.0840 handle will remain key if we are to see some form of bullish continuation.

Support Areas

  • 1.1000 (Psychological Level)
  • 1.0900 (100-200-day MAs)
  • 1.0840 (July Swing Low)

Resistance Areas

  • 1.1150
  • 1.1250 (YTD Highs)
  • 1.1400

EUR/USD Daily Chart

image4.png

4 Effective Trading Indicators Every Trader Should Know

4 Effective Trading Indicators Every Trader Should Know

Using Forex Indicators to Read Charts for Different Market Environments

There are many fundamental factors when determining the value of a currency relative to another currency. Many traders opt to look at the charts as a simplified way to identify trading opportunities – using forex indicators to do so.

When looking at the charts, you’ll notice two common market environments. The two environments are either ranging markets with a strong level of support and resistance, or floor and ceiling that price isn’t breaking through or a trending market where price is steadily moving higher or lower.

Using technical analysis allows you as a trader to identify range bound or trending environments and then find higher probability entries or exits based on their readings. Reading the indicators is as simple as putting them on the chart.

Trading with Moving Averages

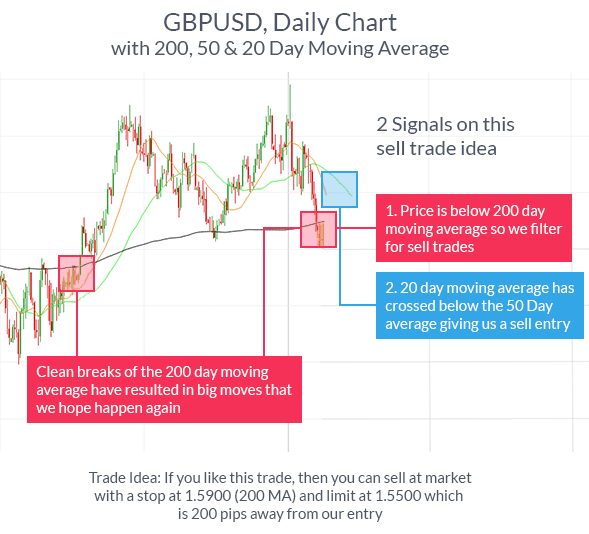
One of the best forex indicators for any strategy is moving average. Moving averages make it easier for traders to locate trading opportunities in the direction of the overall trend. When the market is trending up, you can use the moving average or multiple moving averages to identify the trend and the right time to buy or sell.

The moving average is a plotted line that simply measures the average price of a currency pair over a specific period of time, like the last 200 days or year of price action to understand the overall direction.

Learn Forex: GBPUSD Daily Chart – Moving Average

GBPUSD daily chart showing the use of Moving Averages as a forex indicator to measure the average price of a currency over time.

You’ll notice a trade idea was generated above only with adding a few moving averages to the chart. Identifying trade opportunities with moving averages allows you see and trade off of momentum by entering when the currency pair moves in the direction of the moving average, and exiting when it begins to move opposite.

Trading with RSI

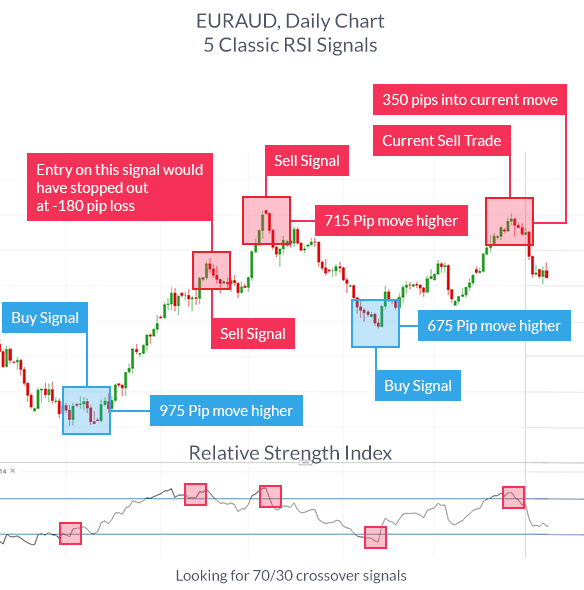
The Relative Strength Index or RSI is an oscillator that is simple and helpful in its application. Oscillators like the RSI help you determine when a currency is overbought or oversold, so a reversal is likely. For those who like to ‘buy low and sell high’, the RSI may be the right indicator for you.

EURAUD daily chart plotted with RSI indicator to identify better exit or entry prices for forex trading.

The RSI can be used equally well in trending or ranging markets to locate better entry and exit prices. When markets have no clear direction and are ranging, you can take either buy or sell signals like you see above. When markets are trending, it becomes more obvious which direction to trade (one benefit of trend trading) and you only want to enter in the direction of the trend when the indicator is recovering from extremes.

Because the RSI is an oscillator, it is plotted with values between 0 and 100. The value of 100 is considered overbought and a reversal to the downside is likely whereas the value of 0 is considered oversold and a reversal to the upside is commonplace. If an uptrend has been discovered, you would want to identify the RSI reversing from readings below 30 or oversold before entering back in the direction of the trend.

Trading with Stochastics

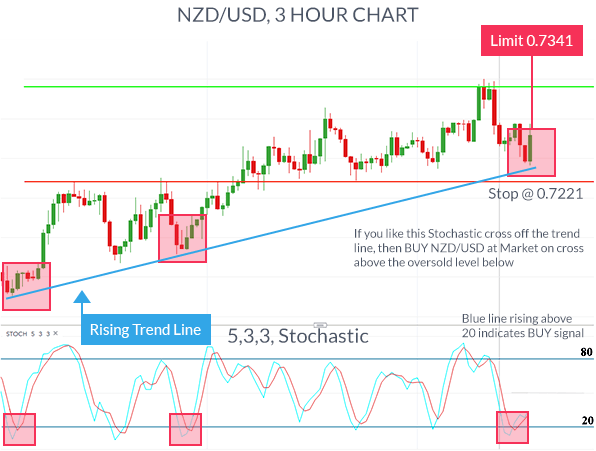
Slow stochastics are an oscillator like the RSI that can help you locate overbought or oversold environments, likely making a reversal in price. The unique aspect of trading with the stochastic indicator is the two lines, %K and %D line to signal our entry.

Because the oscillator has the same overbought or oversold readings, you simply look for the %K line to cross above the %D line through the 20 level to identify a solid buy signal in the direction of the trend.

NZDUSD 3 hour chart showing the use of the stochastic indicator to inform of a forex trading strategy.

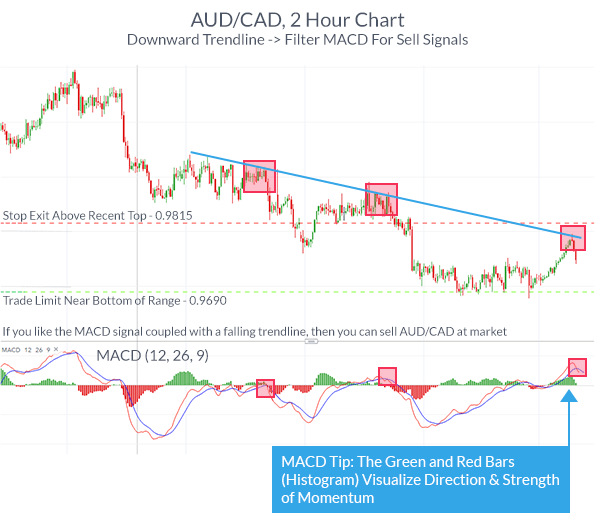
Trading with the Moving Average Convergence & Divergence (MACD)

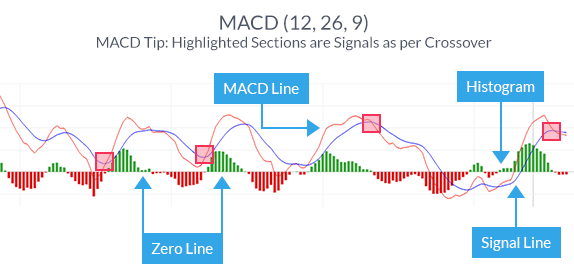
Sometimes known as the king of oscillators, the MACD can be used well in trending or ranging markets due to its use of moving averages provide a visual display of changes in momentum.

After you’ve identified the market environment as either ranging or trading, there are two things you want to look for to derive signals from this indictor. First, you want to recognize the lines in relation to the zero line which identify an upward or downward bias of the currency pair. Second, you want to identify a crossover or cross under of the MACD line (Red) to the Signal line (Blue) for a buy or sell trade, respectively.

Graph showing a MACD line that identifies the upward or downward bias of a currency pair.

Like all indicators, the MACD is best coupled with an identified trend or range-bound market. Once you’ve identified the trend, it is best to take crossovers of the MACD line in the direction of the trend. When you’ve entered the trade, you can set stops below the recent price extreme before the crossover, and set a trade limit at twice the amount you’re risking.

AUDCAD 2 hour chart where the MACD indicator is being used to inform traders of a forex trading strategy.

Learn More about Forex Trading with our Free Guides