US Dollar 5-day Winning Streak at Risk, Will Prices Hold at February Lows?

US Dollar 5-day Winning Streak at Risk, Will Prices Hold at February Lows?

The US Dollar completed its fifth consecutive daily winning streak at the end of Monday. That marked the best winning period for the currency since late May. If the DXY Dollar Index can sustain a sixth push higher, that would mean the longest winning streak since May 2022. But, as Tuesday’s Asia-Pacific trading session concludes, the currency is off to a rough start.

That said, things are looking a little bit rosy for the US Dollar. As I mentioned last week, the currency’s bearish breakout was losing steam. As expected, prices followed through higher. After a seemingly false breakout, the DXY is back above the former 100.82 – 101.02 support zone. That is bringing the focus to a more neutral setting after a string of losses since March.

Immediate resistance appears to be the 20-day Moving Average (MA) above. Just beyond this is 101.92, where support was found in mid-June. This price could hold as new resistance. Above that is the 50-day MA. Keep in mind that a bearish Death Cross between these two lines remains in play, offering a near-term bearish bias.

In the event of sustained losses downward, the currency will find itself facing the 100.82 – 101.02 support zone once more. That said, and as we have seen last week, a bearish breakout may not necessarily spell trouble for the currency. New support was established at 99.57. A deeper and stronger pullback that extends losses from last year would place the focus on the March 31st, 2022 low at 97.68.

image1.png


Nasdaq 100, Nikkei 225 and CAC40 aim for further gains​​​​

Nasdaq 100, Nikkei 225 and CAC40 aim for further gains​​​​

Nasdaq 100, Nikkei 225, CAC40 Analysis and Charts

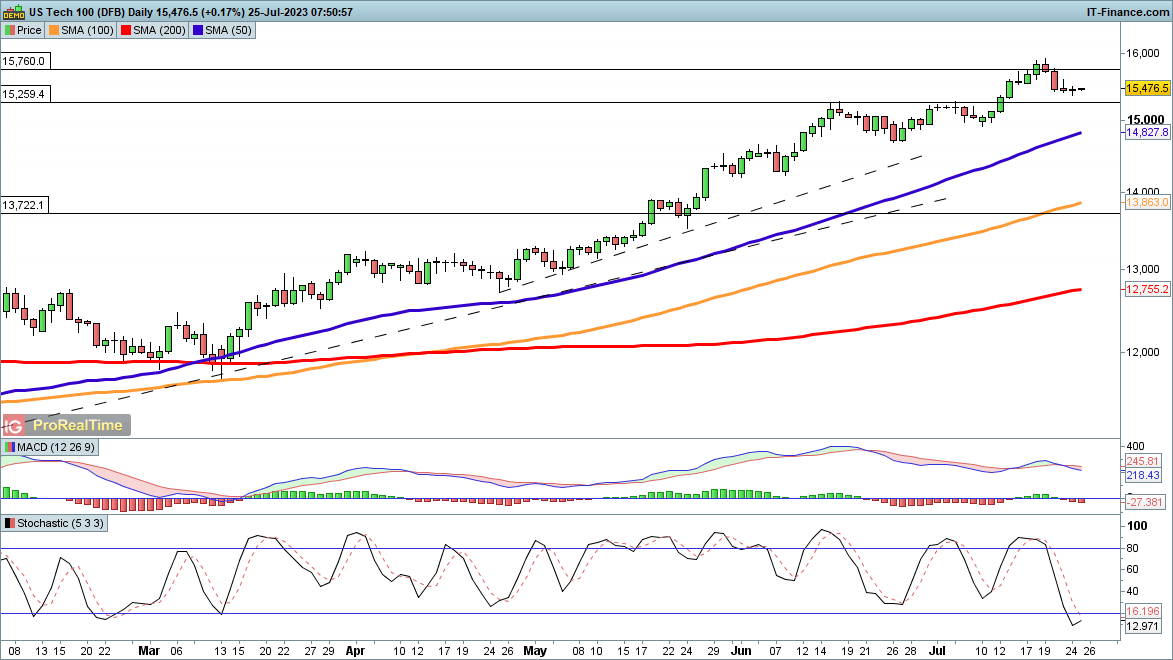
​​​​Shallow pullbacks continue to be the norm for this index, and already buyers are stepping in after the losses on Wednesday and Thursday last week. ​For now, the 15,400 level has been firmly defended, and further gains will target last week’s highs around 15,930. Above this, a fresh higher high for this relentless uptrend will have been created.

​Sellers will want a reversal back below 15,400 that can potentially open the way to the 50-day SMA and the 14,900 level that marked support earlier in July.

​Nasdaq 100 Daily Price Chart

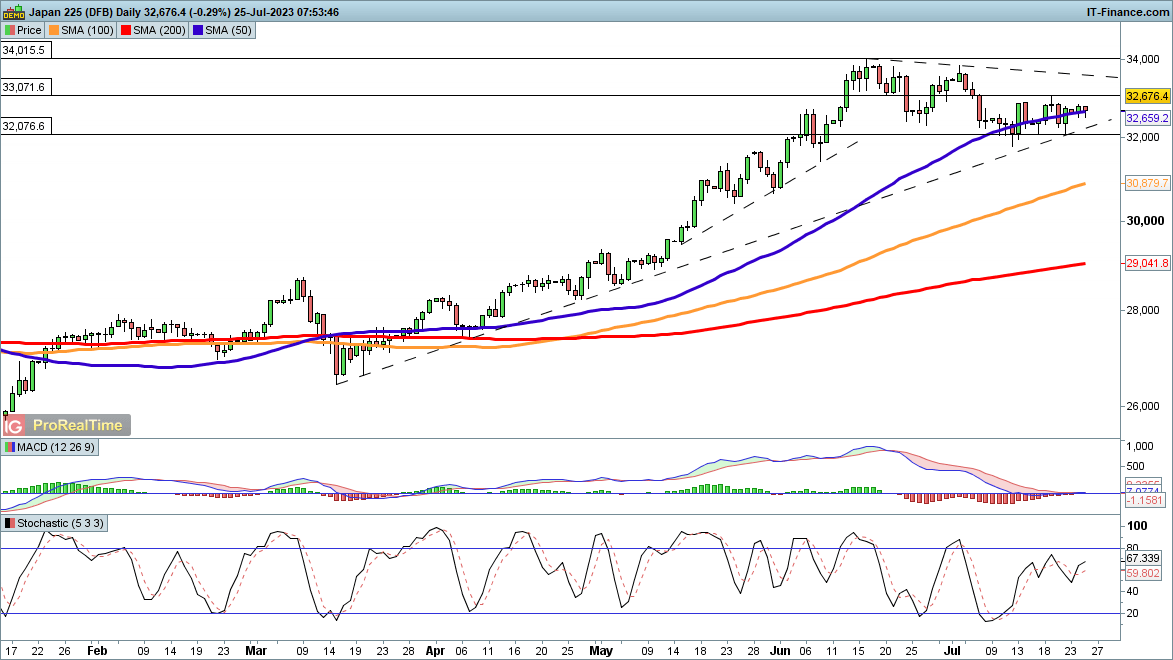
​The index continues to carve out a rounded bottom, with the latest reports of further support for the Chinese economy helping to lift spirits.​Gains above 33,000 have proven impossible to sustain over the course of July, but buyers have repeatedly stepped in around 32,000, stalling any deeper pullback from the June highs. Above 33,000 a move back to the June highs seems to beckon.

​A daily close below 32,000 is needed to provide an indication that a deeper pullback is at hand, perhaps toward the 100-day SMA.

Nikkei 225 Daily Price Chart

​CAC40 breakout continues

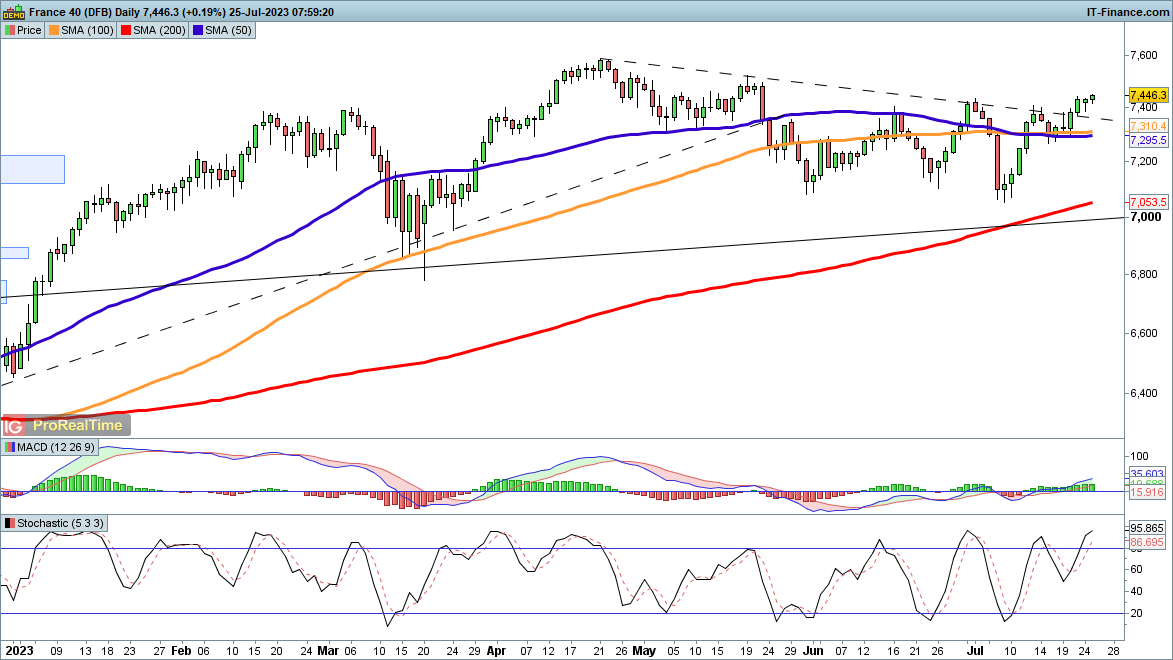
​The index continues to make headway above trendline resistance from the April highs.​The breakout of the past week continues to reinforce the bullish view. The next target will be the May lower high at 7500, and then on to April’s peak at 7580.Above this, the price will move to a new higher high and fresh record highs.

​A move back below 7300 would be needed to suggest that the sellers are back in control in the short-term, although the overall move higher remains in place.

CAC40 Daily Price Chart

Is Gold’s Rebound Over Ahead of FOMC? XAU/USD Price Setups

Is Gold’s Rebound Over Ahead of FOMC? XAU/USD Price Setups

Gold’s rally appears to be losing steam ahead of the US Federal Reserve, the European Central Bank, and the Bank of Japan policy meetings, raising the risk that the rebound this month is corrective.

The US Federal Reserve is widely expected to hike interest rates one last time by 25 basis points on Wednesday, but the accompanying statement will be closely watched. A hawkish hike could provide support to the US dollar globally and weigh on gold. A more data-dependent / ‘wait-and-watch’ could put USD and gold back within their recent ranges, whereas a dovish hike could exert downward pressure on USD, aiding XAU/USD.

In terms of sensitivity of the potential move, if the recent USD performance is anything to go by, a dovish hike by the Fed could weigh on USD more than the other two scenarios. For more on the sensitivity, see “Gold Jumps After Tepid US Retail Sales; What’s Next for XAU/USD After Reverse H&S Target Met?”, published July 19.

XAU/USD 240-minute Chart

image1.png

The European Central Bank is also expected to raise its benchmark rate by 25 basis points on Thursday and stay will likely stay hawkish. However, recent comments from ECB officials that a September rate hike is not a done deal raise the risk of a dovish hike. Meanwhile, the Bank of Japan is expected to keep its ultra-easy monetary policy at its meeting on Friday.

XAU/USD Daily Chart

image2.png

On technical charts,as highlighted in the previous update, XAU/USD has met the price objective of the minor reverse head & shoulders pattern of about 1980 that was triggered earlier this month. However, the yellow metal appears to be succumbing to a tough hurdle at the early-June high of 1983, slightly below the upper edge of the Ichimoku cloud on the daily charts.

If the nascent rebound from the end of June were to continue, then XAU/USD needs to stay above converged support, including the mid-July low of 1945 and the 200-period moving average on the 240-minute charts.

image3.png

A failure to do so would confirm the one-month-long rebound was corrective, exposing downside risks toward the June low of 1893, possibly lower. Retail trader data shows about 69% of traders are net-long gold. The IG Client Sentiment data is typically used as a contrarian indicator to crowd sentiment, suggesting XAU/USD risks further weakness.

Hang Seng Index (HSI) Climbs on Stimulus Aspirations. Will China Drive HSI Higher?

Hang Seng Index (HSI) Climbs on Stimulus Aspirations. Will China Drive HSI Higher?

The Hang Seng Index (HSI) roared more than 4% higher today after dipping almost 2% on Monday.

The rally comes in the aftermath of the Politburo gathering over the weekend. The details of which only came to light late yesterday and lifted Chinese-listed American Depository Receipts (ADR) in the New York session.

The main thrust of the Communist Party of China’s Central Committee held symposium is that there has been an acknowledgement that more needs to be done to boost the economy.

However, there have not been any specific details on exactly what type of stimulus measures will be undertaken at this stage.

Nonetheless, all the mainland China and Hong Kong bourses swelled on the prospect with the Hang Seng China Enterprises Index leading the way, posting gains of over 5% on Tuesday.

Other APAC equity indices were mixed on smaller moves ahead of tomorrow’s Federal Open Market Committee (FOMC) meeting.

Treasury yields have been mostly unchanged although the yield on the 2-year note slipped below 4.85% after trading at 4.92% yesterday.

The US dollar is slightly weaker across the board while the Australian Dollar has been the best-performing currency, encouraged by the news out of China.

EUR/USD has steadied after falling following weak PMI data in Europe compared to the US yesterday.

Crude oil has held onto overnight gains with the WTI futures contract is near US$ 79 bbl while the Brent contract is around US$ 83 bbl. Spot gold is oscillating around US$ 1,960 at the time of going to print

Looking ahead, after Germany’s IFO business survey, the US will see the results of the Conference Board Consumer Confidence household survey.

HANG SENG INDEX TECHNICAL ANALYSIS

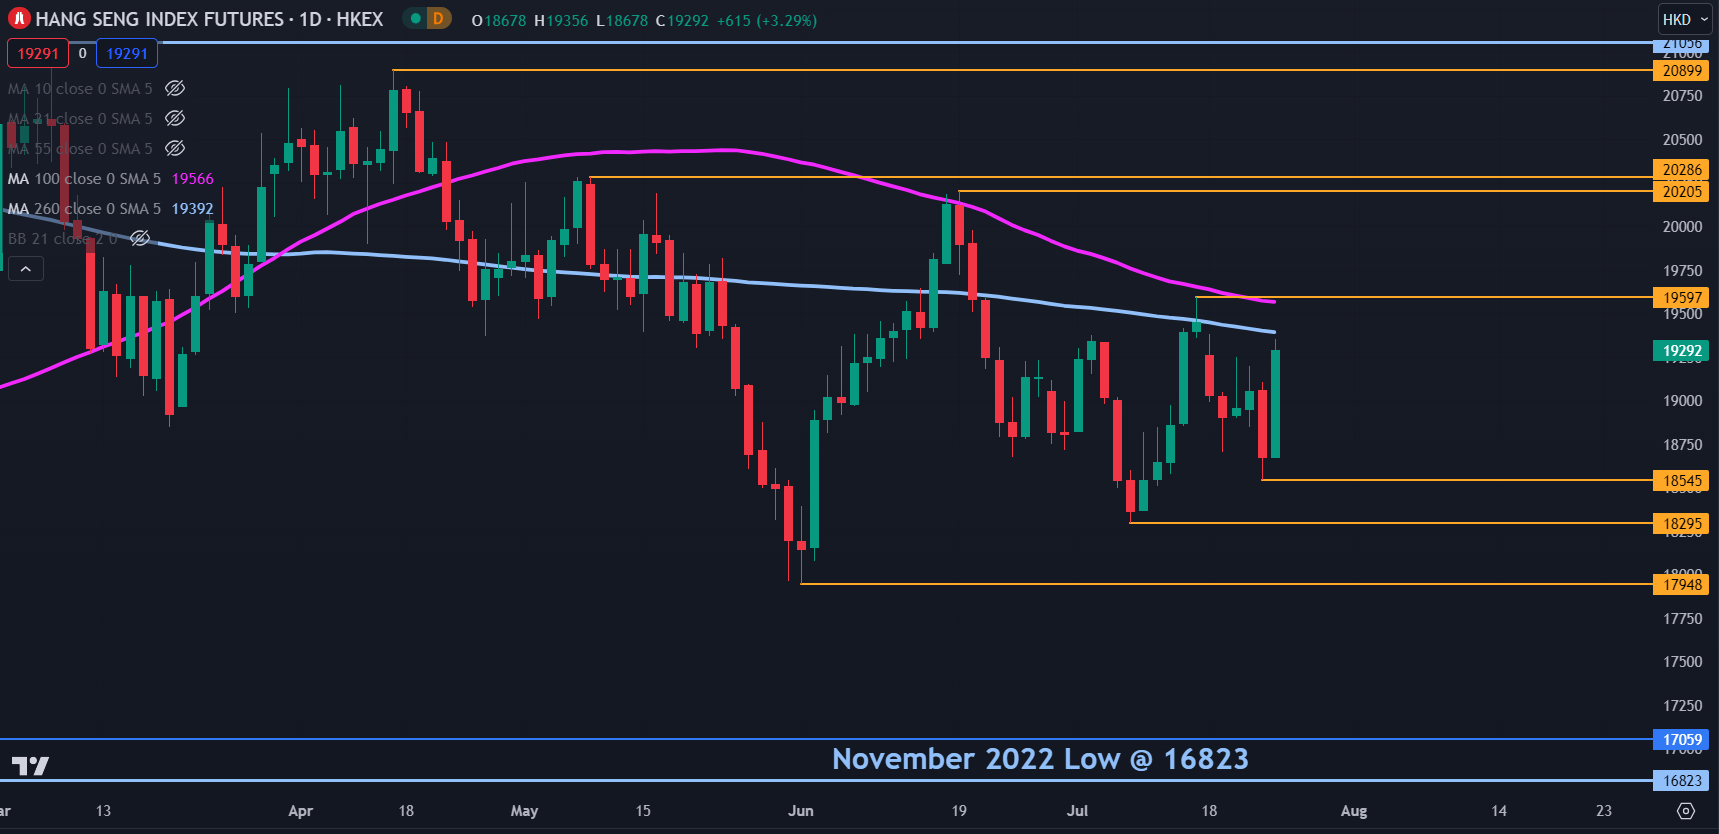
Hong Kong’s Hang Seng Index (HSI) made large gains today, but the overall picture is that of a narrowing range-trading environment.

Resistance could be at the nearby 100- and 260-day simple moving averages (SMA) currently in the 19390 – 19570 area, just ahead of the recent high near 19600.

On the downside, the prior lows of 18545, 18295 and 17948 may provide support.

image1.png


Australian Dollar Surges on China Stimulus Pledge; AUD/USD, EUR/AUD, GBP/AUD Price Action

Australian Dollar Surges on China Stimulus Pledge; AUD/USD, EUR/AUD, GBP/AUD Price Action

The Australian dollar surged against some of its peers after Chinese authorities pledged to stimulate the economy.

Markets took comfort after media reports quoted state news agency Xinhua saying China will shore up economic policy adjustments, focusing on expanding domestic demand, boosting confidence, and preventing risks. The agency also quoted President Xi Jinping as saying during a separate meeting that China will strive to achieve its annual development targets.

Beijing has announced a series of measures to cushion some of the downside risks to the economy, including cuts in key lending benchmarks, targeted measures toward new-energy vehicles, the property sector, and the booming generative artificial intelligence sector, and signaled the end of the years-long crackdown on the technology sector.

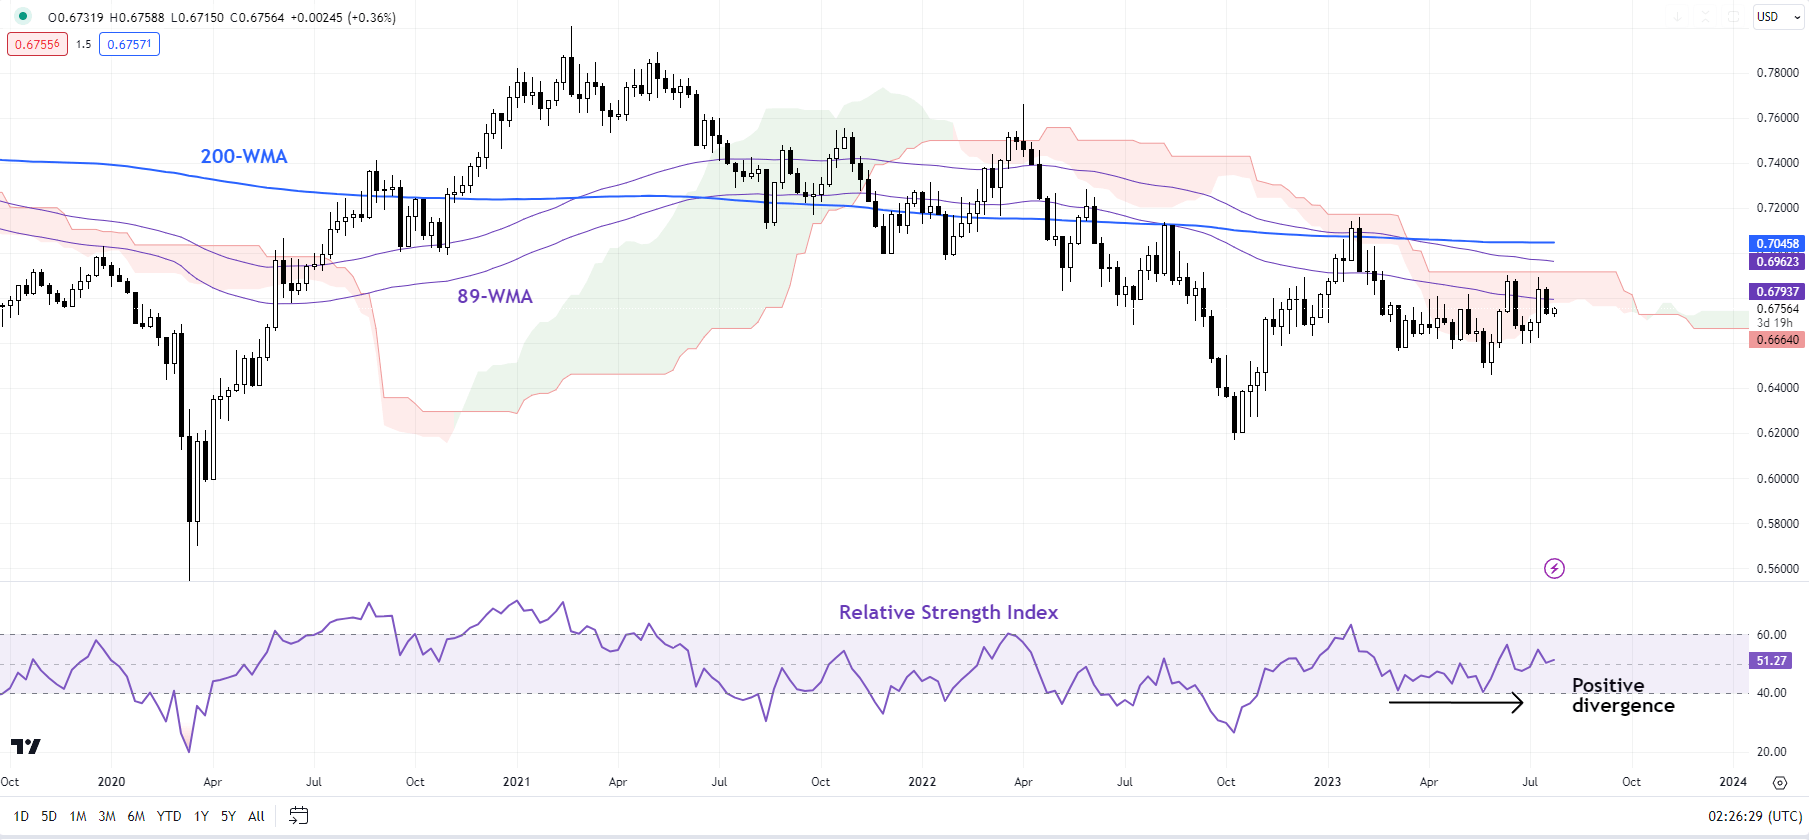
AUD/USD Weekly Chart

image1.png

The focus is now on whether there are additional measures for the struggling property sector addressing the demand side and infrastructure. China is Australia’s largest two-way trading partner in goods and services. Any improvement in China’sgrowthoutlook bodes well for AUD prospects.

Meanwhile, data due on Wednesday is expected to show that Australia CPI eased to 1.0% on-quarter in the April-June quarter from 1.4% in the January-March quarter, and 6.2% on-year in Q2-2023 from 7.0% in the previous quarter. On a monthly basis, CPI is expected to have eased to 5.4% on-year in June from 5.6% in May. With Australia’s unemployment rate near five-decade lows, a slower-than-expected moderation in price pressures could make the August 1 RBA meeting a live one.

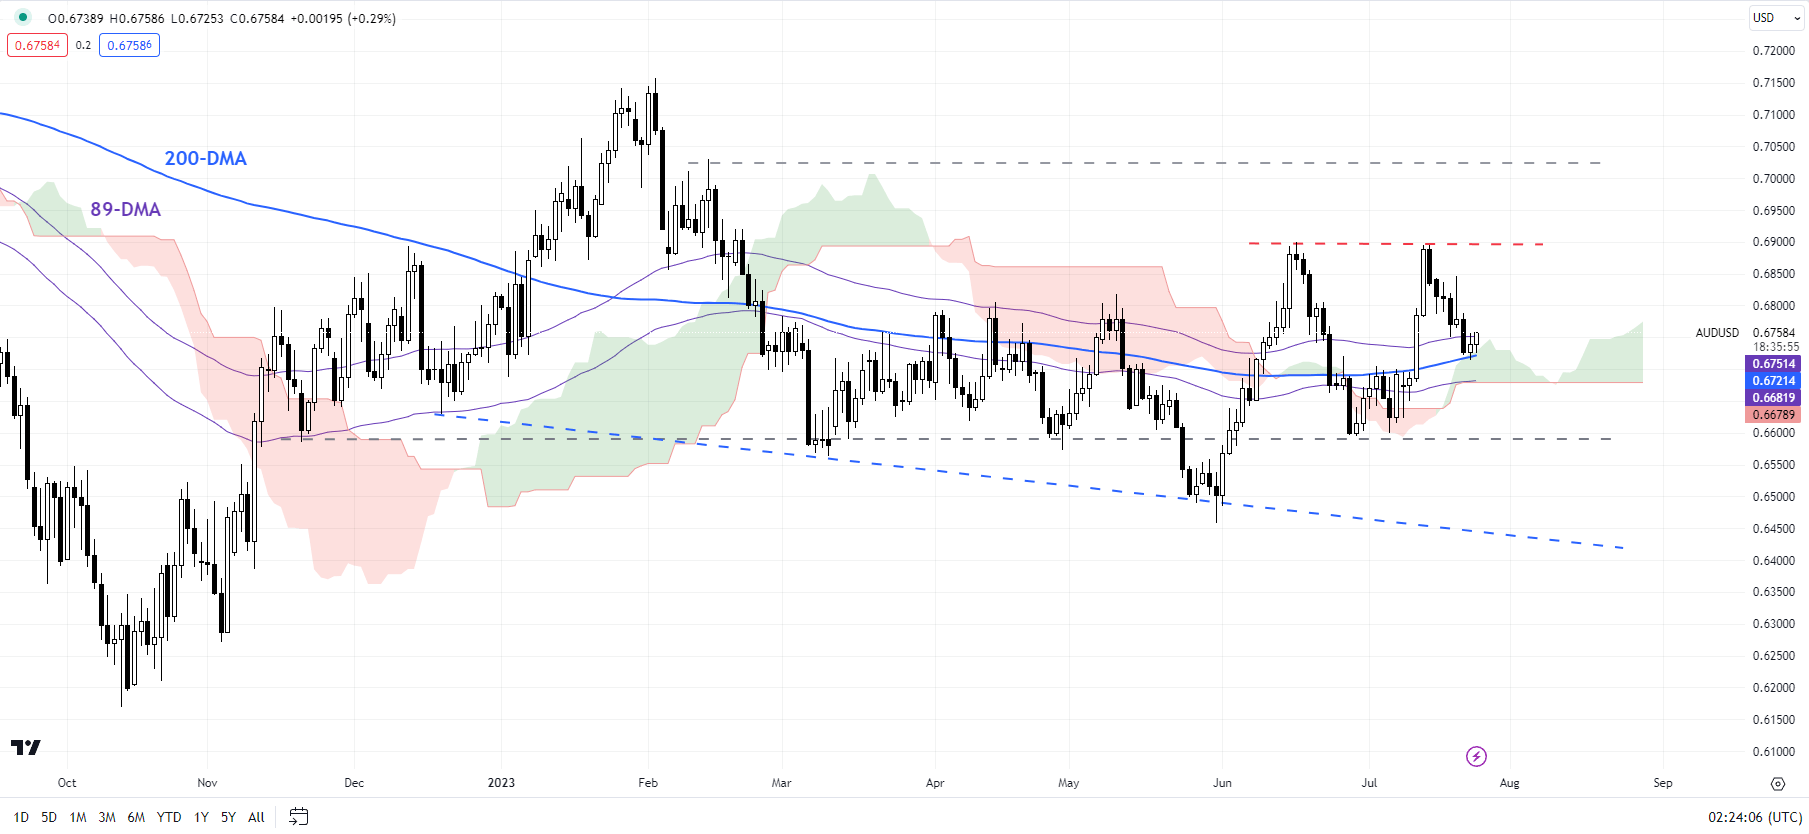
AUD/USD Daily Chart

image2.png

AUD/USD: Forming another base?

On technical charts, AUD/USD is holding above vital support on the 200-day moving average (now at about 0.6720). The rise above Monday’s high of 0.6750 raises the odds that the pair could be forming another base. This follows a higher low formed in late June/early July, opening the prospect of a higher-top-higher-bottom pattern from May.

Still, AUD/USD would need to break above the vital hurdle at the June and July highs of around 0.6900 to confirm that the trend had reversed to up from down. Until then, the path of least resistance remains sideways, within the recently well-established range of 0.6500-0.6900.

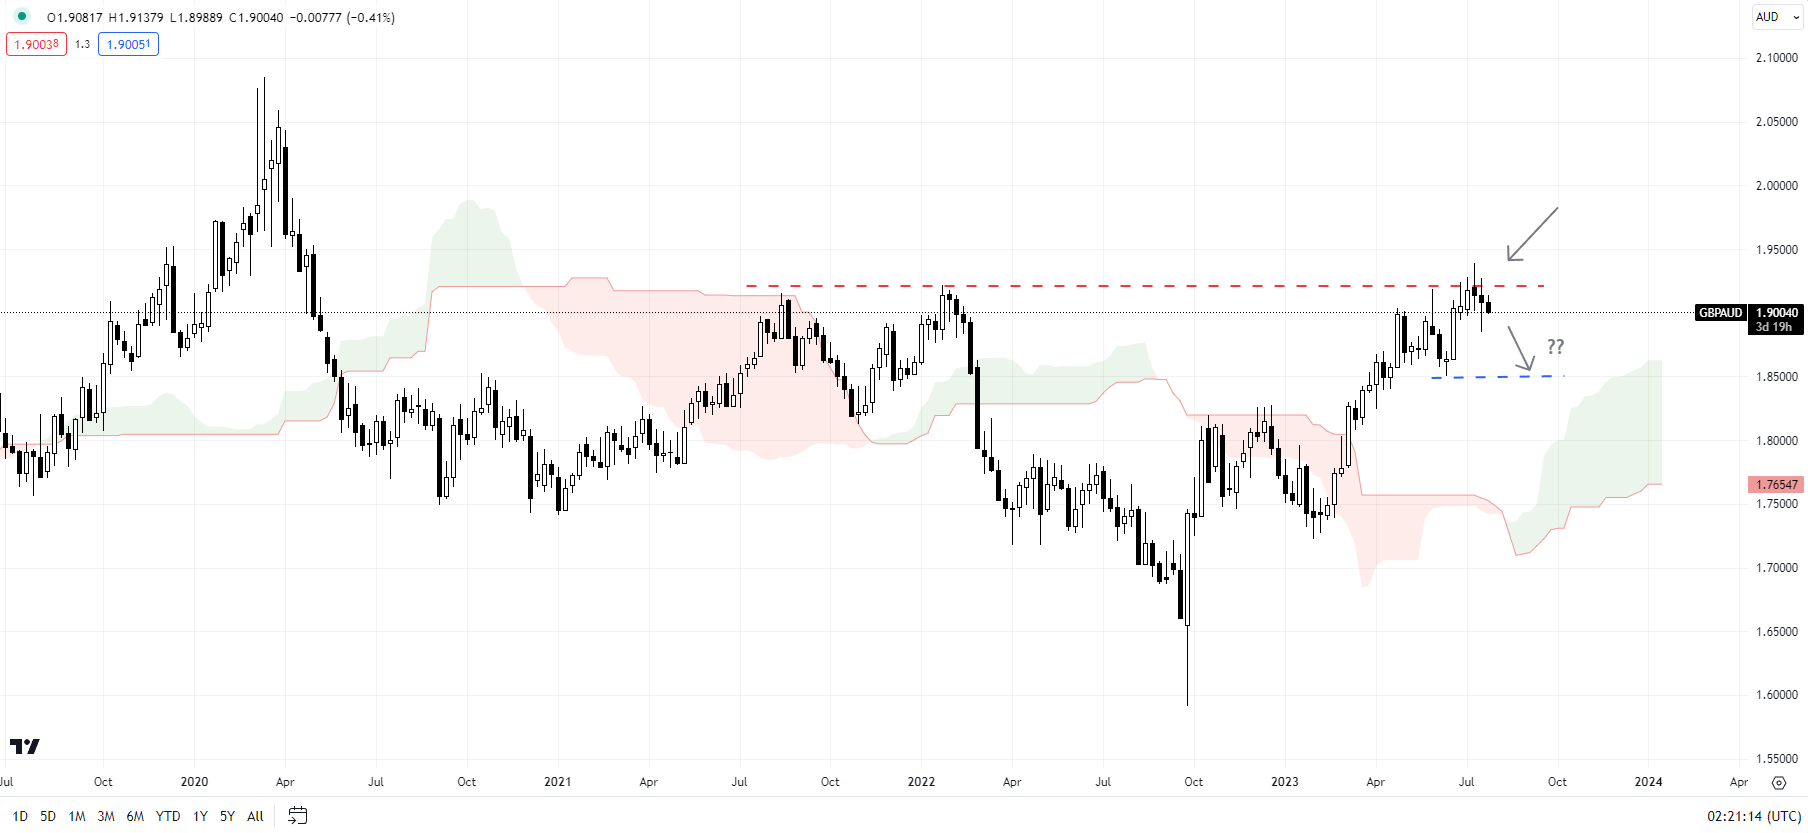
GBP/AUD Weekly Chart

image3.png

GBP/AUD: Risks retreat

GBP/AUD has run into a major hurdle on a horizontal trendline from 2021, at about 1.9200.

A negative momentum divergence (rising price associated with a stalling in the 14-day Relative Strength Index) raises a risk of a drop toward the June low of 1.8500 in the near term. However, the broader upward pressure is unlikely to fade while the cross remains above the 200-day moving average (at about 1.8250).

EUR/AUD Daily Chart

image4.png

EUR/AUD: Upward pressure could be fading

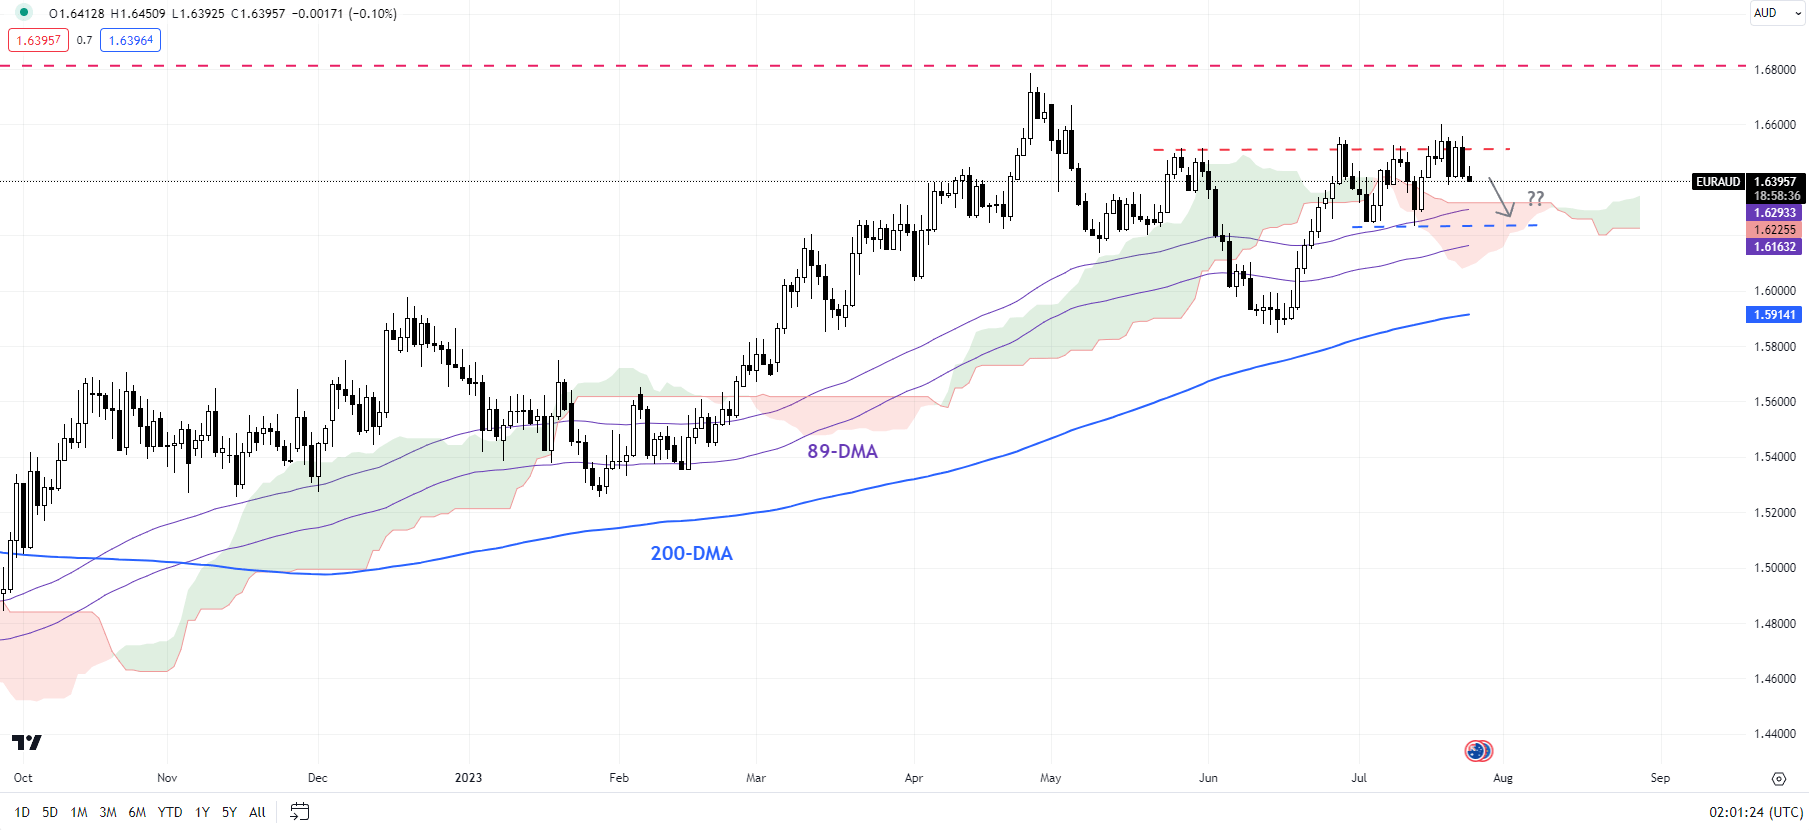
After repeated failed attempts to break above the solid ceiling in the May of 1.6515, EUR/AUD appears set to be weak slightly in the near term. The cross could drop initially toward the mid-July low of 1.6230, potentially the 200-day moving average (now at about 1.5900).

GBP/USD Price Forecast: Fleeting Pound Recovery?

GBP/USD Price Forecast: Fleeting Pound Recovery?

GBPUSD FUNDAMENTAL BACKDROP

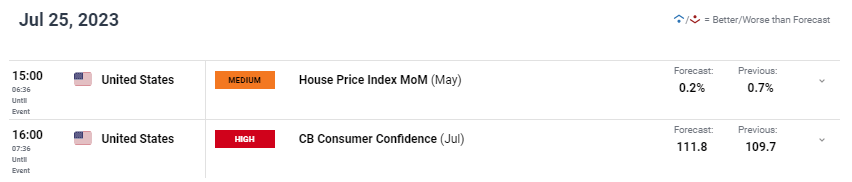
The British pound is attempting a revival after 7 consecutive negative closes against the US dollar after the DXY is trading marginally lower today. Today’s move has little to do with any UK specific factors and will be the case throughout the week as the US takes over with multiple high economic data releases including the FOMC interest rate announcement. Today’s schedule will focus on the US CB consumer confidence release that is expected to push higher for the 4th month in a row and would be the highest level since January 2022, leaving cable exposed to the downside should actual figures fall in line or above estimates.

GBP/USD ECONOMIC CALENDAR (GMT +02:00)

image1.png

From a UK perspective, the Bank of England (BoE) interest rate forecasts have been ‘dovishly’ re-priced coming down from a peak above 6% to 5.8% in February/March 2024 at the time of writing. This has weighed negatively on sterling and exacerbated by the weak PMI data yesterday. In addition, high government debt has not helped the nation as UK debt is significantly higher than both the US and eurozone.

BANK OF ENGLAND INTEREST RATE PROBABILITIES

image2.png

Chinese optimism around additional stimulus has seen a short-term move away from the greenback while augmenting pound strength but this may be short-lived as no action has been implemented just yet.

TECHNICAL ANALYSIS

GBP/USD DAILY CHART

image3.png

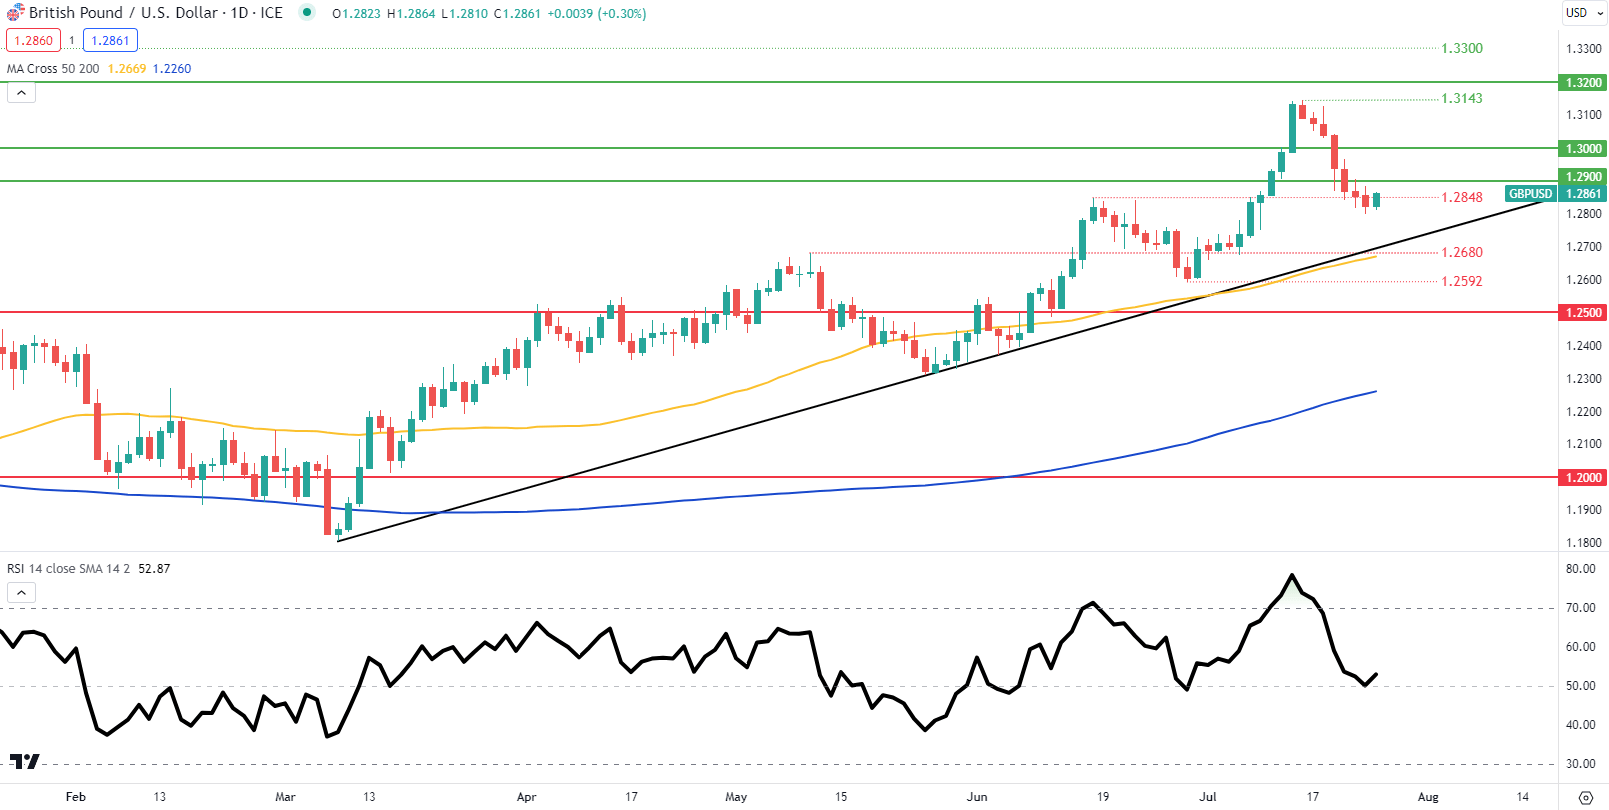
Price action on the daily cable chart above shows levels around the 1.2848 swing support handle with the Relative Strength Index (RSI) lingering at the midpoint region thus favoring bullish nor bearish momentum short-term. That being said, fundamentals tend to favor additional weakness unless the Fed decides to maintain/cut rates or providing extremely dovish guidance with a 25bps hike (priced in). A test of trendline support (black) is plausible if market expectations come to fruition and with recessionary fears gaining traction, the USD may be the safe haven call investors make.

Key resistance levels:

  • 1.3000
  • 1.2900

Key support levels:

  • 1.2848
  • Trendline support
  • 1.2680

BEARISH IG CLIENT SENTIMENT (GBP/USD)

IG Client Sentiment Data (IGCS) shows retail traders are currently neither short or long on GBP/USD with 50% of traders holding short and long positions (as of this writing). At DailyFX we typically take a contrarian view to crowd sentiment but due to recent changes in long and short positioning, we arrive at a short-term downside bias.

US Dollar Bearish Bets Climb to Record High Among Asset Managers

US Dollar Bearish Bets Climb to Record High Among Asset Managers

Asset managers boosted bearish dollar bets to a record amid speculation slowing US inflation will hasten the end of the Federal Reserve’s 16-month run of policy tightening.

Institutional investors — including pension funds, insurers and mutual funds — increased net short position on the greenback by 18% to 568,721 contracts in the week through July 18, according to data on eight currency pairs from the Commodity Futures Trading Commission and aggregated by Bloomberg.

The Bloomberg Dollar Spot Index slid the most in six months on July 12 when US government data showed inflation slowed more in June than economists forecast. The Fed will raise its key rate by 25 basis points this week but may start cutting its benchmark early next year, overnight-indexed swaps indicate.

“We have been gaining this confidence that inflation will come down quite significantly over the coming quarters in the US,” Rodrigo Catril, a senior foreign-exchange strategist at National Australia Bank Ltd., said on Bloomberg Television. “That in itself will encourage the market to believe the Fed not only is done but it will be contemplating rate cuts toward the turn of the year, and that will be a significant downturn for the US dollar.”

Asset managers boosted dollar net shorts by the most against the euro and pound among the eight currencies, the data compiled by Bloomberg show. At the same time, they cut yen shorts by the most since March 2020.

The market is positioning for a number of key central bank policy decisions this week, including the Fed on Wednesday, the European Central Bank Thursday, and Bank of Japan Friday.

Hong Kong stocks slide in pivotal week for China stimulus bets while developers slump as Fed prepares to raise rates

Hong Kong stocks slide in pivotal week for China stimulus bets while developers slump as Fed prepares to raise rates

Hong Kong stocks slide in pivotal week for China stimulus bets while developers sink on liquidity, rate outlook

  • The Hang Seng Index approached a two-week low on concerns China stimulus will disappoint while the Fed are odds-on to tigten its policy this week
  • Foreign investors dumped US$1 billion worth of onshore stocks last week while mainland funds wavered on their purchases in Hong Kong
A homebuyer walking through a construction area in the compound where he bought an apartment in Ningbo, eastern Zhejiang province on June 2. Photo: AFP

Hong Kong stocks slumped amid signs foreign investors are trimming their bets on China’s biggest companies as Beijing holds off big stimulus while the economy deteriorates. Property developers retreated on dimmer sales outlook as central banks prepare to raise interest rates again.

The Hang Seng Index dropped 2.1 per cent to 18,668.15 at the close of Monday trading, approaching a two-week low. The benchmark declined 1.7 per cent last week. The Tech Index lost 2.2 per cent, while the Shanghai Composite Index advanced 0.1 per cent.

Alibaba Group lost 1.8 per cent to HK$89.65 and Tencent tumbled 2.4 per cent to HK$325 while NetEase declined 1.2 per cent to HK$158.20. Developer Country Garden slumped 8.7 per cent to HK$1.26 and Longfor plunged 8.3 per cent to HK$14.82. Hong Kong peer Sun Hung Kai Properties weakened 1.7 per cent to HK$95.05, and New World Development slipped 1.6 per cent to HK$18.08.

Foreign investors sold US$1 billion worth of onshore stocks last week, the most in Asian markets, according to Goldman Sachs. The pullback trimmed the inflows so far this year to US$28 billion. Mainland Chinese funds wavered in their bets, buying US$2.1 billion of stocks in Hong Kong on July 19, and sold US$1.8 billion the next day, the US bank said, citing Stock Connect data.

China’s property market has continued to struggle amid weak sales and persistent liquidity crunch. Changes in new home prices in Tier-1 mainland cities in June ranged from a 0.4 per cent gain to a 0.3 per cent drop from May, according to government data. Sales by China’s top 100 developers plunged 28 per cent in June from a year earlier, according to data compiled by China Real Estate Information Corp.

“China has launched some incremental measures but not the big package investors want to see,” said Redmond Wong, strategist at Saxo Capital Markets Hong Kong. “Targeted measures will continue, and I think the market will eventually turn around to work on that basis.”

The July Politburo meeting is likely to convey an easing bias while continuing to emphasise the “high-quality growth” model, Goldman said in a report. With the leadership placing more focus on security and sustainability than near-term economic growth, “policy stimulus will come in different forms and magnitudes than before,” it added.

USD/JPY pulls back from two-week high, trades with modest losses below mid-141.00s

USD/JPY pulls back from two-week high, trades with modest losses below mid-141.00s

The USD/JPY edges lower on the first day of a new week and erodes a part of Friday’s strong gains to the 142.00 neighbourhood, or a nearly two-week high. Spot prices remain on the defensive through the Asian session and currently trade just below mid-141.00s, down around 0.30% for the day.

The Japanese Yen (JPY) attracts some buyers in reaction to comments by Japan’s top currency diplomat Masato Kanda, saying that the recent inflation and wage rises were overshooting expectations. Speaking to reporters this Monday, Kanda added that the data available so far supports prospects for an upgrade in the Bank of Japan’s (BoJ) inflation forecasts. This revives hopes that the BoJ might tweak its Yield Curve Control (YCC) policy later this week, which, along with a softer risk tone, underpins the safe-haven JPY and act as a headwind for the USD/JPY pair.

Apart from this, a modest US Dollar (USD) downtick is seen as another factor weighing on the pair, though the downside seems limited ahead of this week’s key central bank event risks. The Federal Reserve (Fed) is scheduled to announce the outcome of a two-day policy meeting on Wednesday and is expected to hike interest rates by 25 bps. Moreover, doubts that the Fed will commit to a more dovish policy stance assist the buck to preserve its recovery gains from the lowest level since April 2022 touched last week and should lend support to the USD/JPY pair.

The highly-anticipated FOMC decision will be followed by the latest BoJ monetary policy update on Friday, which will play a key role in determining the near-term trajectory for the major. In the meantime, traders on Monday will take cues from the release of the flash US PMI prints, due later during the early North American session. The data will provide fresh insight into the US economic health, which, in turn, should influence the USD. Apart from this, the broader risk sentiment might also contribute to producing short-term opportunities around the USD/JPY pair.

The Week Ahead – FOMC, ECB, BoJ Rate Decisions, Aussie CPI Headline a Big Week in Markets

The Week Ahead – FOMC, ECB, BoJ Rate Decisions, Aussie CPI Headline a Big Week in Markets

Global markets are heading into a bumper week of tier one economic releases, with the eagerly awaited rate decisions from the Federal Reserve, European Central Bank and Bank of Japan on the calendar. Also in the mix are key Inflation figures from the US , Europe and Australia to keep traders on their toes.

US: FOMC looks set to hike 25bp

US inflation has moved lower recently, but a tight jobs market and business activity remaining resilient, a 25 bp hike from the Fed is expected, with the market pricing it in as a 99%+ probability.

With a 25bp fully priced in it will be the signaling that will be the key to the market reaction with the accompanying statement and presser likely to acknowledge the encouraging signs on inflation, but also a determination not to take any chances that could allow it to re-ignite.

Chart to watch:

The US Dollar Index rebounded strongly last week, from extreme oversold levels, re-taking the major Support/Resistance (and psychological) level at 101.

101 will be the level to watch, a hold above and price action indicates it has reverted to Support could be the start of a leg higher in the USD, a break back below and 101 re-establishes as resistance and a re-test of the July lows will be a possibility.

Eurozone : ECB favoured to hike 25bp – future hikes hang in the balance

Like the FOMC decision, markets are currently pricing in a ECB rate hike of 25bp as almost a done deal, with futures showing a 92% + probability.

Source:Bloomberg terminal

Also, like the FOMC, signaling will be key to the market response after this decision, with another hike in September being teased by ECB members hanging in the balance. Flash PMI manufacturing and Services figures out of Germany and France on Monday could play a part in the ECB forward guidance, so EUR traders should keep an eye on those too.

Chart to watch:

EURUSD has had a stellar run up on the back of USD weakness since early July, breaking out of it’s range before stalling around the 1.12 key resistance level and pulling back last week.

1.12 will be the level to watch and has acted both as strong resistance and support in the last 12 months, a retake and hold of this level will be needed to see another leg up in EURUSD, whilst holding below would be a bearish signal and a test of the previous resistance at 1.1010 (also the 61.8% Fib retracement of latest up move) is certainly in play.

Australia: Market Split on next RBA move – Q2 CPI the decider?

The highlight for AUD traders this week will be the Q2 CPI reading on Wednesday. Which will go a long way to determine whether the RBA hikes rates again at their August meeting. With futures markets evenly split (pricing in a 48% chance of a 25bp hike) some big moves in AUD are likely on the release of this announcement.

hart to Watch:

AUDUSD drifted lower last week, USD strength, though stronger than expected employment data did arrest the decline after AUDUSD found support at the 50% fib level at 0.6750, seeing a brief spike higher before resuming its drop on Friday.

Key level to watch is 0.6750, a 50% fib level from the recent run up in AUDUSD, and also a level that has acted as key Support/Resistance in the past. Another leg up to test the major resistance at 0.69 will need to see 0.6750 re-establish itself as support, the next major support level is around 0.6600.

Japan: BoJ meeting a close call, tweaks to YCC a possibility.

Recent swings in FX and Japanese government bonds are suggesting market participants positioning for a monetary policy adjustment out of the BoJ on Friday. Re-adjusting their target band for JGB’s is a definite possibility and will have some major ramifications for the JPY.

Chart to Watch:

USDJPY bounced last week after a precipitous drop from the 145 “intervention level” to extreme oversold levels recently, pushing above and holding the 50% retracement level.

If there is no change from the BoJ on Friday, a re-test of the 145 level is in the cards for the near future as carry traders resume their long positions. An adjustment should see a rapidly strengthening Yen, and a new down trend in USDJPY kick started.

In other economic announcements, another one to watch will be the Feds favoured inflation gauge, the core PCE Index released on Friday. Full calendar below:

Disclaimer: Articles are from GO Markets analysts and contributors and are based on their independent analysis or personal experiences. Views, opinions or trading styles expressed are their own, and should not be taken as either representative of or shared by GO Markets. Advice, if any, is of a ‘general’ nature and not based on your personal objectives, financial situation or needs. Consider how appropriate the advice, if any, is to your objectives, financial situation and needs, before acting on the advice. If the advice relates to acquiring a particular financial product, you should obtain and consider the Product Disclosure Statement (PDS) and Financial Services Guide (FSG) for that product before making any decisions.