China’s SAFE says will forcefully prevent sharp volatility in the yuan

China’s SAFE says will forcefully prevent sharp volatility in the yuan

SAFE with more specific yuan comments now:

  • Yuan flexibility is increasing, market understanding of two-way fluctuation and ‘risk neutral’ also increased
  • Fed tightening is coming to an end, spillover effect is weakening
  • Will keep yuan basically stable at balanced levels in a forceful manner
  • Will prevent sharp volatilities in the yuan exchange rate
  • Will comprehensively use policy measures to stabilise expectations
Head of China's forex regulator, the State Administration of Foreign Exchange (SAFE)
China to unveil more measures to revive private economy: Officials

China to unveil more measures to revive private economy: Officials

Chinese officials on Thursday pledged greater efforts to revive the private economy, with more measures to be unveiled soon.

Their remarks came after the Communist Party of China Central Committee and the State Council issued a guideline on Wednesday on boosting the growth of the private economy.

“The private economy has long played a positive role in stabilizing growth, promoting innovation, increasing employment and improving people’s livelihoods,” Li Chunlin, deputy head of the National Development and Reform Commission, said at a press conference.

To ensure full implementation of the guideline, the commission will work with relevant parties to introduce supporting policies and measures in the near future, he said.

As part of the supporting measures, the commission will publish a document soon on encouraging private investment to “fully motivate the sector,” Li said.

The commission will continue holding symposiums with private entrepreneurs on a regular basis to help them solve problems and heed their suggestions, Li said.

The private sector contributes approximately 50% of China’s tax revenue, 60% of its GDP, 70% of its technological innovation, and accounts for 80% of its urban employment.

To provide an improved environment for the private economy, China will also work to remove barriers in market access and fully implement policies and mechanisms for fair competition, he said.

An Lijia, vice chairman of the All-China Federation of Industry and Commerce, pledged efforts to create a nurturing social environment for the private economy.

“We will increase publicity of outstanding private entrepreneurs and promote their entrepreneurial spirit. Meanwhile, we will cooperate with relevant departments to crack down on malicious rumors and smears against private enterprises,” An said.

In China, more than 90% of private companies are small and medium-sized enterprises (SMEs), and more than 90% of SMEs are private companies.

China will continue to facilitate financing for SMEs, said Xu Xiaolan, vice minister of industry and information technology.

Outstanding inclusive finance lending to small and micro-sized companies reached 27.7 trillion yuan (about $3.88 trillion) at the end of June, up 26.1% year on year.

China will also promote qualified SMEs to go public, and encourage the national SME development fund to increase investment in start-ups, Xu said.

“The country will work to create a market-oriented, legalized and international business environment for micro, small and medium-sized enterprises,” Xu noted.

Data on Foreign Exchange Settlement and Sales by Banks

Data on Foreign Exchange Settlement and Sales by Banks

As shown in the statistics of the State Administration of Foreign Exchange (SAFE), in June 2023, the amount of foreign exchange settlement and sales by banks was RMB 1431.6 billion and RMB 1372.7 billion, respectively. During January to June 2023, the accumulative amount of foreign exchange settlement and sales by banks was RMB 7848.2 billion and RMB 7833.8 billion, respectively.

In the US dollar terms, in June 2023, the amount of foreign exchange settlement and sales by banks was USD 200.3 billion and USD 192.0 billion, respectively. During January to June 2023, the accumulative amount of foreign exchange settlement and sales by banks was USD 1132.5 billion and USD 1130.7 billion, respectively.

In June 2023, the amount of cross-border receipts and payments by non-banking sectors was RMB 3863.5 billion and RMB 3777.9 billion, respectively. During January to June 2023, the accumulative amount of cross-border receipts and payments by non-banking sectors was RMB 20974.6 billion and RMB 20652.6 billion, respectively.

In the US dollar terms, in June 2023, the amount of cross-border receipts and payments by non-banking sectors was USD 540.4 billion and USD 528.4 billion, respectively. During January to June 2023, the accumulative amount of cross-border receipts and payments by non-banking sectors was USD 3025.9 billion and USD 2979.2 billion, respectively.

Addendum: Glossary and relevant definitions

Balance of payments (BOP) refers to all economic transactions between residents and non-residents.

Foreign exchange settlement and sales by banks refers to settlement and sale transaction that bank executes for customers and for the banks themselves, including statistic data on settlements of forward contracts for foreign exchange settlement and sales and the exercises of option, and excluding the transactions in the interbank foreign exchange market. The statistic reporting date of Foreign exchange settlement and sales by banks should be the trade day of the Foreign exchange settlement and sales transaction. By definition, foreign exchange settlement means that foreign exchange holders sell foreign exchange to banks, and foreign exchange sales means that banks sell foreign exchange to foreign exchange buyers.

The newly signed contract amount of forward foreign exchange settlement and sales refers to the binding forward contract between a bank and its client that predetermines foreign exchange currency, amount, exchange rate and tenor which to be executed upon maturity.

The unwind amount of forward foreign exchange settlement and sales refers to, where client is unable to perform the original forward contract due to change in its real demand, client to fully or partially close its forward position by executing another deal with opposite direction to the original contract.

The rolling amount of forward foreign exchange settlement and sales refers to client to adjust the settlement date of original contract due to change in its real demand.

The outstanding amount of forward foreign exchange settlement and sales by the end of the current period refers to the total amount of forward contracts accumulated from all non-matured forward contracts with client.

The net Delta exposure of outstanding options refers to the implied foreign exchange spot risk exposure from outstanding option contracts that bank executed with client.

The cross-border receipts and payments by non-banking sectors refers to the receipts and payments between domestic non-banking sectors (including institutional and individual residents) and non-residents through domestic banks, excluding receipts and payments in cash. In particular, the statistics includes cross-border receipts and payments between non-banking sectors and non-residents through domestic banks (including RMB and foreign currency), and domestic receipts and payments between non-banking sectors and non-residents through domestic banks (temporarily excluding domestic receipts and payments in RMB between individual residents and non-resident individuals). Data are collected when customers conduct receipts and payments with non-resident counterparties at domestic banks. Specifically, the receipts refer to the capital of non-banking sectors received from non-residents via domestic banks; the payments refer to the capital of non-banking sectors paid to non-residents via domestic banks.

Yuan rebounds on corp debt quota easing

Yuan rebounds on corp debt quota easing

The yuan rebounded on Thursday as China eased the quota of corporates’ foreign debt, a move that experts said has reassured the market of the authorities’ readiness to utilize their ample policy reserves to safeguard the stability of the Chinese currency.

Experts also said the yuan, also known as the renminbi or RMB, may further shake off its recent weakness and strengthen against the greenback in the second half of the year as China’s economy is expected to outperform that of the United States while U.S. interest rate hikes will come to an end.

On Thursday, the onshore yuan jumped by 386 basis points against the U.S. dollar to 7.1811 as of 16:30, after it shed 872 basis points against the greenback in a three-day weakening streak, according to market tracker Wind Info.

The rally came after China increased the macroprudential adjustment parameter for cross-border financing of corporates and financial institutions to 1.5 from 1.25, effective Thursday.

The parameter acts as a multiplier that determines the upper limit of outstanding cross-border financing an institution can avail. For instance, a nonfinancial enterprise with total net assets of 1 million yuan ($139,277) should be allowed to have 3 million yuan in outstanding external debt following Thursday’s move, up from 2.5 million yuan previously.

By allowing more overseas borrowing, the move will boost capital inflows, increase onshore dollar liquidity and stabilize the yuan, experts said, adding that it also delivered a clear signal that the authorities are ready to utilize their policy reserves in time to safeguard yuan stability.

The People’s Bank of China, the country’s central bank, and the State Administration of Foreign Exchange jointly announced on Thursday they are raising the parameter, several days after PBOC Deputy Governor Liu Guoqiang assured that the PBOC will use its policy tools when needed, to keep the yuan exchange rate generally stable at a reasonable level.

Zhou Maohua, an analyst at China Everbright Bank, said the PBOC still has ample tools to stabilize the yuan after Thursday’s move, including the foreign exchange deposit reserve requirement ratio, the RRR for trading in foreign-exchange forward contracts and the countercyclical adjustment factor.

So far this year, the onshore yuan has depreciated by more than 3 percent against the dollar, which experts attributed to China-U.S. monetary policy divergence as well as the U.S. economy’s resilience when China’s economic recovery had slowed down.

China’s one-year loan prime rate, a market-based benchmark lending rate, came in at 3.55 percent on Thursday, unchanged from the previous month, after it fell by 10 basis points in June as the PBOC further eased monetary policy to support the economy.

By contrast, the U.S. Federal Reserve is widely expected to further raise the target range for the federal funds rate by 25 basis points to 5.25-5.5 percent next week. The widening U.S.-China interest rate differential, experts said, has put pressure on the yuan against the dollar.

This narrative, however, could reverse in the second half of the year. Hu Yifan, head of macroeconomics for Asia-Pacific at UBS Global Wealth Management, said the yuan may recover to about, or even stronger than, the 7-per-dollar level by the end of the year as the Fed may stop rate hikes in the coming months.

Also underpinning the yuan would be China’s economic condition faring better than that of the U.S. as the latter may see negative growth in the second half following the Fed’s rate hikes while China’s economy further recovers, Hu said.

Foreign holdings of U.S. Treasuries decreased in May as the U.S. aggressively raised interest rates. As the second-biggest foreign holder of U.S. debt, China’s holdings in U.S. Treasury securities slid to a 14-year low at $846.7 billion as of the end of May, down by $22.2 billion from April, the U.S. Treasury Department said on Tuesday.

‘Something very strange’ explains why a US recession has been delayed

‘Something very strange’ explains why a US recession has been delayed

Since the Federal Reserve began aggressively hiking interest rates last year, more and more economists warned that a US recession was imminent. But that recession has not yet arrived, and there’s no sign a recession is near even after reliable indicators like the inverted yield curve flashed red flags. According to Societe Generale, “something very strange has happened” that explains why a US recession has been delayed, and it has to do with some timely moves made by corporations. The bank highlighted that going back to at least 1975, corporate net interest payments would rise as the Fed raised interest rates.

Credit hedge funds – brighter opportunities for a cloudier second half

Credit hedge funds – brighter opportunities for a cloudier second half

Thought of the day

Investors in traditional credit markets face a more challenging and complex second half. We expect growth to slow for the remainder of 2023. Lending standards are tightening in many developed markets, a trend intensified by banking turbulence in the US and Europe. And riskier credit segments like high yield and leveraged loans are most at risk of spread widening and negative total returns, as borrower distress and default rates likely climb. Default volumes totaled USD 7.2bn in bonds and USD 6bn in loans in May, while US corporate bankruptcies stood at 236 between January and April this year (double the same period in 2022) based on Bank of America data.

Overall, we are most preferred on fixed income over equities, with a preference for high grade and investment grade bonds over riskier traditional credit segments. But the challenging environment for traditional credit investors may prove fruitful hunting ground for alternative credit managers, in our view. We see growing opportunities for credit hedge funds to provide investors that can bear their risks with attractive carry, lower sensitivity to interest rate and credit risk, and potential for greater gains than losses thanks to “convexity.”

Credit long/short funds may benefit from higher dispersion among the riskiest issuers. Fundamental credit long/short hedge funds posted annualized returns of 2.8% in 2023, with less than half of the volatility of traditional credit (based on HFRI RV Corporate Index data). We see further value in this strategy for the second half, as it seeks to generate returns from exploiting differences between issuers and using hedges to limit exposure to overall credit market movements.

Spread dispersion between high-yield issuers stands at a year-to-date high, suggesting larger return potential from long/short credit hedge funds. These strategies may also benefit from market volatility, as they historically outperformed traditional credit investments two-thirds of the time after a market sell-off (based on HFRI RV: Fixed Income Corporate and Bloomberg US Corporate IG index data back to 1993).

In today’s uncertain economic environment, we see most merit in seeking exposure to managers with low net exposure and with the ability to go net-short in credit markets should economic worries prove worse than expected.

Convertible arbitrage strategies may offer bigger opportunities for gains than losses. Historically, convertible arbitrage funds (represented by the HFRI RV: FI-Convertible Arbitrage Index) generated comparable average annualized performance to equities at less than half the volatility. And low positive correlations of 0.24 and 0.59, respectively, to global bonds and global equities suggest potential portfolio diversification benefits for long-term investors (based on data since 1993).

We see scope for convertible arbitrage to extend its 2.7% year-to-date gain, as last year’s equity market sell off means many US instruments offer appealing yields and would gain more in price from an equity rally than they would fall should stocks sell off (the so-called “convexity” effect). Rising default rates, however, underscore the need for issuer selectivity and for investors to seek managers with conservative approaches and good hedging capabilities.

Distressed corporate debt managers may be able to add value as defaults rise. On balance, we expect mid-single-digit default rates for both high yield and loans over the next 12 to 18 months. The growth in size for lower-rated credit markets over recent years may provide additional opportunities for distressed managers to generate returns. For now, we favor opportunistic funds as well as other alternative managers in private credit with extensive experience through multiple cycles and robust risk management processes, as opposed to investing in traditional distressed funds. Banking sector struggles this year might also benefit private asset-backed finance (ABF), as subdued bank lending and a potential economic slowdown can create opportunities for non-bank lenders. With increased demand, resilient private balance sheets and low defaults, ABF presents diverse investment opportunities across sectors and themes, in our view.

Investors in alternative credit strategies should be aware that these assets are long-term focused, illiquid, and require longer lockup periods. Investors need to be comfortable with those risks, as well as those around transparency of underlying holdings, leverage, and volatility. Above all, investments should be made within the context of a financial plan and a well-diversified portfolio.

Japan restores South Korea’s preferential trade partner status

Japan restores South Korea’s preferential trade partner status

Japan reinstated South Korea on Friday to its list of countries with preferential trade status, allowing for simplified export procedures.

In August 2019, the government had excluded South Korea from the list, citing deficiencies in the country’s trade control system.

In the same year, the government also tightened export controls to South Korea for three materials used for the production of semiconductors and displays. Tokyo lifted the strict controls in March.

Under the preferential status, most of the items that were subject to strict controls no longer need export permits per contract.

The items include machine tools, which are believed to be at high risk of being diverted for military use.

Earlier this month, Tokyo and Seoul signed a memorandum to hold director-level policy talks periodically on their export control systems.

They said that if there are any problems, they will hold dialogue and decide what actions should be taken.

US Dollar Recovery this Week Faces Next Key Obstacle, Where to for DXY?

US Dollar Recovery this Week Faces Next Key Obstacle, Where to for DXY?

DXY Weekly Chart

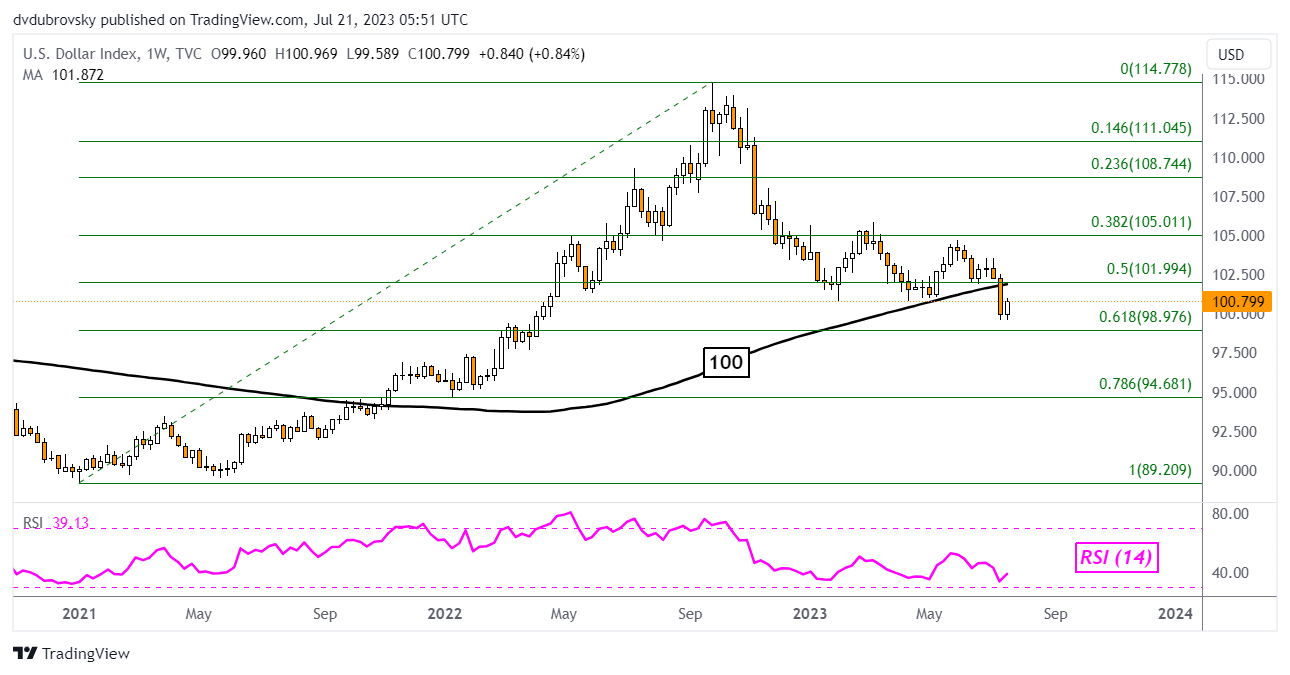
The DXY Dollar index fell about 2.3% last week, marking the worst 5-day period since November. Using the weekly setting below, we can get an idea of how prices have behaved since then heading into the end of July. Prices broke under the 100-week Simple Moving Average (SMA). That has opened the door to a broader bearish shift.

That said, an upside close this week could somewhat undermine this breakout. At about 0.8%, that is the most since mid-June. Further confirmation places the focus on the 61.8% Fibonacci retracement level at 98.97. Falling under the latter would offer a stronger broader downside technical bias. We can analyze the daily setting to get a better idea of how prices have been stabilizing of late.

DXY Weekly Chart

DXY Daily Chart

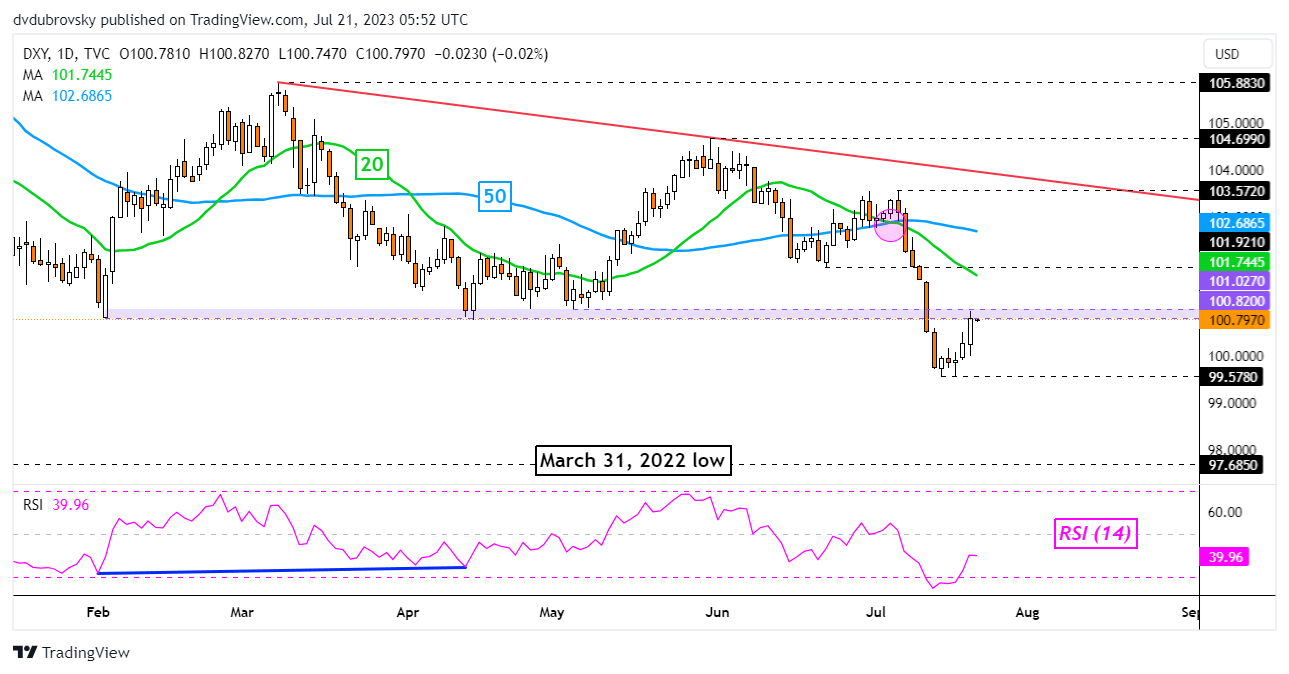
On the daily chart, the DXY Dollar Index has found a new level of support around 99.57. This followed a breakout under the 100.82 – 101.02 support zone. This range was established back in February and held on multiple occasions in April and May. With Thursday’s ascent, prices are back at this zone which is holding as new resistance.

Piercing through this area opens the door to an extended near-term upward move. That places the focus on the 20- and 50-day SMAs. These could hold as resistance, maintaining the dominant downside bias. Otherwise, a turn lower places the focus back on 99.57. Beyond this price sits the March 31st low at 97.68.

DXY Daily Chart

Profit-Taking in Big Tech Overnight, as US Earnings Remain Centre Stage: US Dollar, Nikkei 225, AUD/JPY

Profit-Taking in Big Tech Overnight, as US Earnings Remain Centre Stage: US Dollar, Nikkei 225, AUD/JPY

Market Recap

Earnings from Netflix and Tesla have triggered some profit-taking in big tech companies overnight, as pockets of weaknesses in their results seem to give rise to concerns for other upcoming big tech results as well. Given the stellar tech rally since the start of the year, market participants may be pricing for not just an earnings beat, but a strong guidance in corporate earnings over the coming quarters with current ‘soft landing’ hopes. Any signs to challenge that narrative may call for some re-rating in their present lofty valuation.

Wall Street ended mixed overall (DJIA +0.47%; S&P 500 -0.68%; Nasdaq -2.05%), with further catch-up gains in value sectors as the DJIA delivered its nineth day winning streak. Weaker-than-expected read in the Philadelphia Fed Manufacturing Index (-13.5 versus -10 forecast) and a deeper contraction in the Conference Board Leading Economic Index have been largely shrugged off, with the earnings season taking centre stage and expectations well-positioned for the last rate hike from the Fed next week. Treasury yields largely headed higher, with the 10-year yields jumping 10 basis-point (bp) overnight.

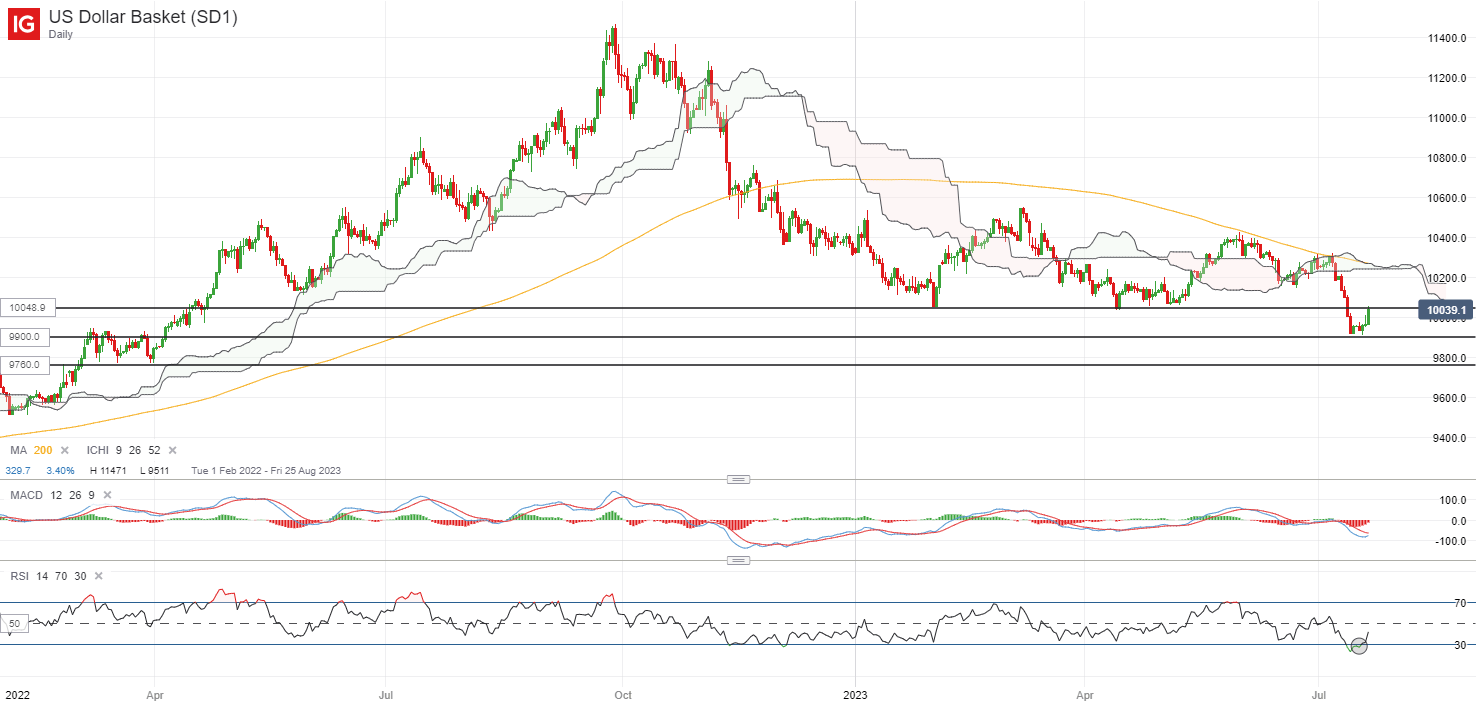
One to watch may be the US dollar, which is back to retest its previous support-turned-resistance level at the 100.50 level. For now, the broader trend of lower highs and lower lows could still suggest sellers largely in control, while there are the odds that the recent upmove is a near-term moderation from oversold technical conditions following a hefty 4% sell-off over the past two week. Failure to reclaim the 100.50 level over the coming days could leave its July 2023 low on watch at the 99.00 level for a retest.

image1.png

Asian stocks look set for a negative open, with Nikkei -0.69%, ASX -0.22% and KOSPI -0.75% at the time of writing. The economic calendar is relatively quiet to end the week, with focus this morning revolving around the Japan’s inflation data for June. The headline print was lower than expected (3.3% versus 3.5% year-on-year), but the core aspect continue to show some persistence with a match of consensus at 4.2%.

That may still keep speculations of a policy adjustment from the Bank of Japan (BoJ) in place, with the Japanese 10-year bond yields hovering near its two-month high into the BoJ meeting next week. While there has been some pushback from authorities lately for a July move, the consensus remains that a policy shift will be a matter of when and could eventually take place by the end of this year.

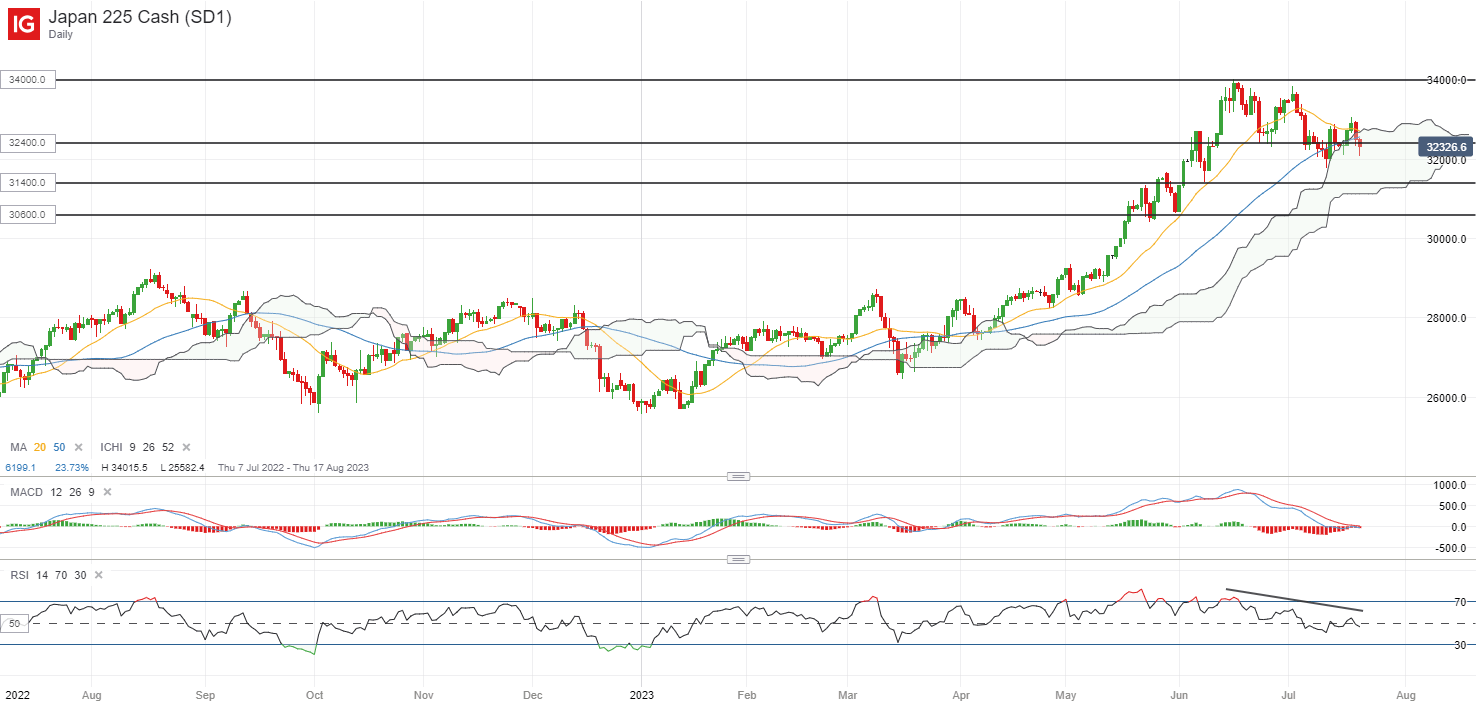
Any hawkish shift in policy settings may be negative for the Nikkei 225 index, as seen from the 2% sell-off back in December 2022 on the BoJ’s surprise yield curve control (YCC) tweak. But while that is still perceived to be a few meetings away, the index is currently attempting to defend a key double-top neckline at the 32,400 level. The recent lower highs on its Relative Strength Index (RSI) point to some exhaustion in upward momentum for now, while the index attempts to stay above its 100-day moving average (MA) for now. Failure to defend the 32,400 level may potentially pave the way towards the next line of support at the 31,400 level.

image2.png

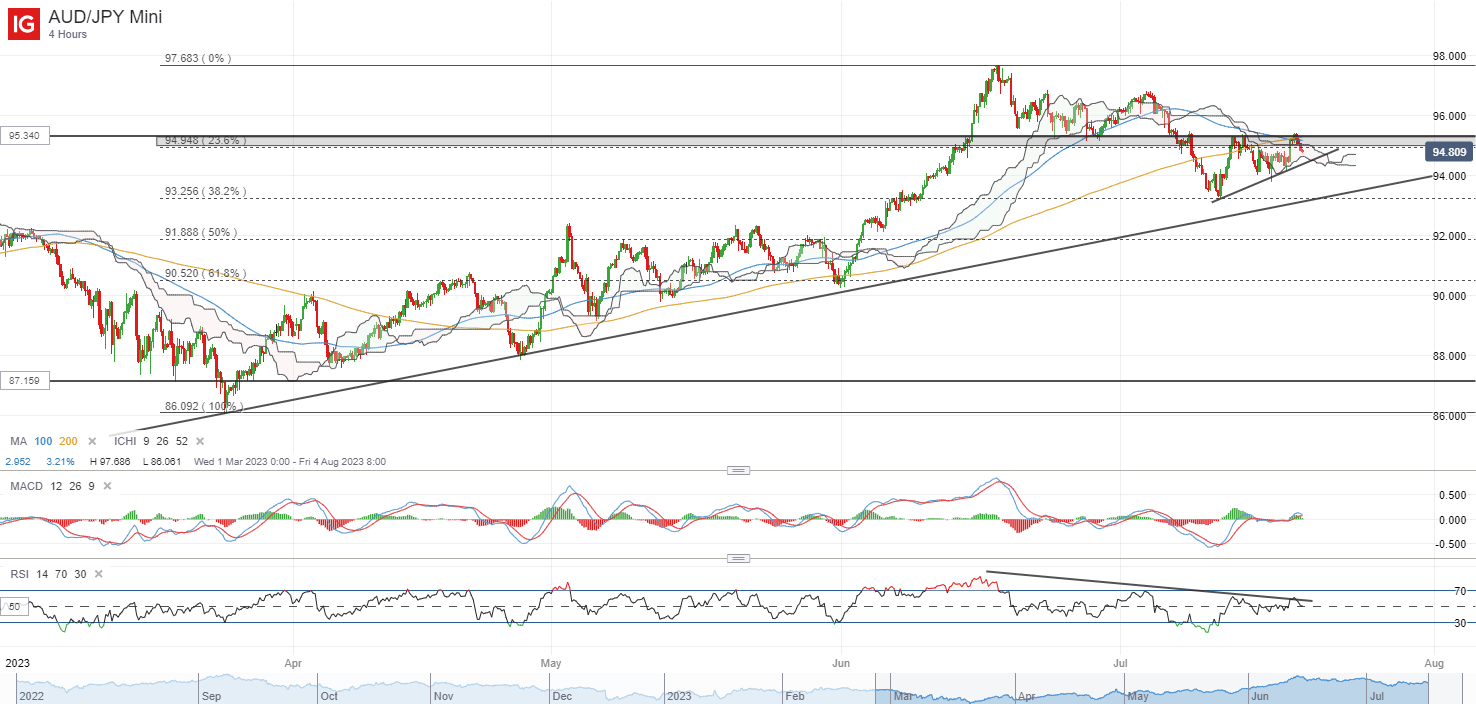
A hotter-than-expected jobs data out of Australia yesterday has prompted a hawkish recalibration in rate expectations for the Reserve Bank of Australia (RBA), as market participants price for a higher odds of a 25 bp move from the central bank next month. That triggered an initial jump in the AUD/JPY before the more subdued risk environment dampened some optimism around the risk-sensitive AUD.

With that, the AUD/JPY is once again back to retest its key resistance at the 95.34 level, with a near-term ascending triangle pattern in place on the four-hour chart. Buyers may have to overcome the 95.34 level to provide greater conviction for a move to retest its June 2023 high, but for now, the risks of a lower high is still present, with any downside potentially leaving the 93.20 level on watch as immediate support.

image3.png

Euro Technical Outlook – A Retreat from Lofty Levels. Will EUR/USD Reverse?

Euro Technical Outlook – A Retreat from Lofty Levels. Will EUR/USD Reverse?

EUR/USD TECHNICAL ANALYSIS

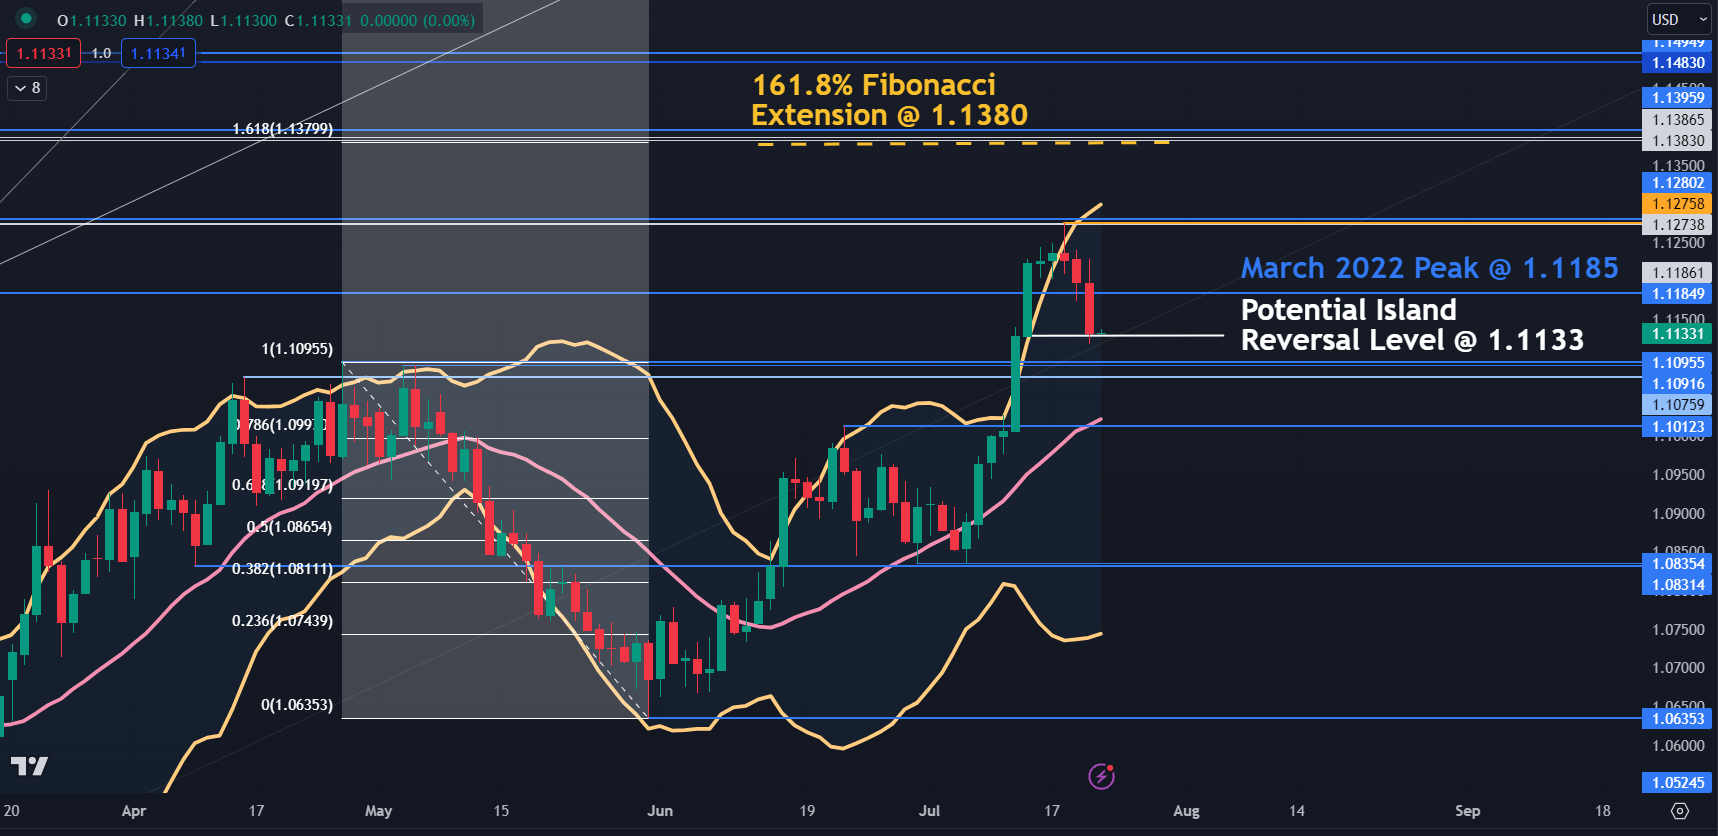
Last week’s rally has broken above the upper band of the 21-day simple moving average (SMA) based Bollinger Band.

When it closed back inside earlier this week, it opened up a bearish run over the next few days as discussed here on Tuesday.

The bears may look to add exposure if there is a close below 1.1133, as it would set up an island reversal candlestick pattern.

An Island Reversal occurs when there is a gap in price action that extends the bullish or bearish trend. After the price reaches its zenith or nadir, the price action then makes another gap in the price in the opposite direction to where the first gap occurred.

Strictly speaking, it is rare for an Island Reversal to occur in free-floating foreign exchange markets as they do not close during the working week.

The continuous trading of currencies means that the daily close and next open are almost identical. In general, the change in price reflects the interest rate differential between the two currencies.

Exchange-traded financial market products, such as equities and futures, generally close for a period each day. This allows new information to be disseminated before the next open and the price may move significantly from where it closed, enabling a gap.

So, for EUR/USD, a close below 1.1133 may indicate that an Island Reversal has evolved. If it does close below that level, the further below 1.1133 that it occurs, the more comfort the bears might find.

Support could be at the breakpoints in the 1.1075 – 1.1095 zone and lower down at 1.1010.

On the topside, resistance could be at the breakpoint from the March 2022 high at 1.1185 or the recent peak at 1.1275, which coincides with two historical breakpoints.

Further above those levels, resistance might be at the Fibonacci Extension of the move from 1.1095 to 1.0635 at 1.1380. Just above there are some more breakpoints in the 1.1385 – 95 area.

EUR/USD DAILY CHART

image1.png