Germany PMI moves into contraction territory in July

Germany PMI moves into contraction territory in July

The German economy moved into contraction territory in July as a deepening downturn in manufacturing output coincided with a sustained slowdown in services activity growth, the latest HCOB ‘flash’ PMI® survey compiled by S&P Global showed. Business expectations towards future activity meanwhile turned negative for the first time this year, which was reflected in a weakening of job creation from the strong rates seen in the second quarter. On the price front, rates of input cost and output charge inflation continued to slow. However, this owed exclusively to an increasing drag from falling manufacturing costs

EZ: Flash PMI signals steeper downturn and cooling price pressures at start of third quarter

EZ: Flash PMI signals steeper downturn and cooling price pressures at start of third quarter

Eurozone business output fell at the fastest rate for eight months in July, according to the latest HCOB flash PMI survey data produced by S&P Global, marking a weak start to the third quarter. Deteriorating forward-looking indicators such as future output expectations and new order inflows also point to the likelihood of the downturn deepening in coming months, prompting companies to pull back on hiring. Price pressures meanwhile moderated further, with average selling prices rising at the slowest rate for almost two-and-a-half years. Prices charged by manufacturers fell at a rate not seen since the height of the

Bearish Yen Positioning by Asset Managers Cut by Most Since 2020

Bearish Yen Positioning by Asset Managers Cut by Most Since 2020

Asset managers trimmed bearish positions on the yen by the most in more than three years as inflation continues to put pressure on the Bank of Japan to adjust its ultra-loose monetary policy this year.

The latest Commodity Futures Trading Commission data for the five days through July 18 also showed a slight reduction in the still-bearish bets of hedge funds. Meanwhile, one-week risk reversals, which show demand for call options to buy the yen relative to put options to sell it, suggest that traders are hedging for a stronger currency.

The yen has had a wild ride since the end of June, rebounding more than 5% from its weakest versus the dollar since November, before trimming more than half of that rally to trade around 141.70 on Monday morning in Tokyo. While the likelihood of a BOJ policy tweak this week appears to be falling after a report Friday that said officials see little urgent need to act on yield-curve control, a growing number of economists continue to see change as possible later this year.

Ueda Says BOJ to Keep Easing Unless Shift in Price Goal View

Although the yen is feeling depreciation pressure at the moment, “traders are hedging against the risk of a stronger yen,” said Takeshi Ishida, a currency strategist at Resona Bank Ltd. “While it’s more likely that the BOJ won’t change policy, the magnitude of yen moves in the event of a policy adjustment would be big,” he added.

©2023 Bloomberg L.P.

Weakest rise in UK private sector output for six months in July

Weakest rise in UK private sector output for six months in July

July data highlighted a considerable slowdown in business activity growth across the UK private sector economy. The latest rise in output levels was the weakest for six months, largely due to flatlining new orders and sharply reduced backlogs of work. Manufacturing companies meanwhile reported the biggest improvement in suppliers’ delivery times since this index began in January 1992. The normalisation of global supply chains helped to boost vendor performance and bring down cost pressures in July. As a result, manufacturers reduced their output charges for the second month running. Across the UK private sector as

Natural Gas Price Technical Outlook: Best Week Since mid-June, Where to?

Natural Gas Price Technical Outlook: Best Week Since mid-June, Where to?

Daily Chart – Range-Bound

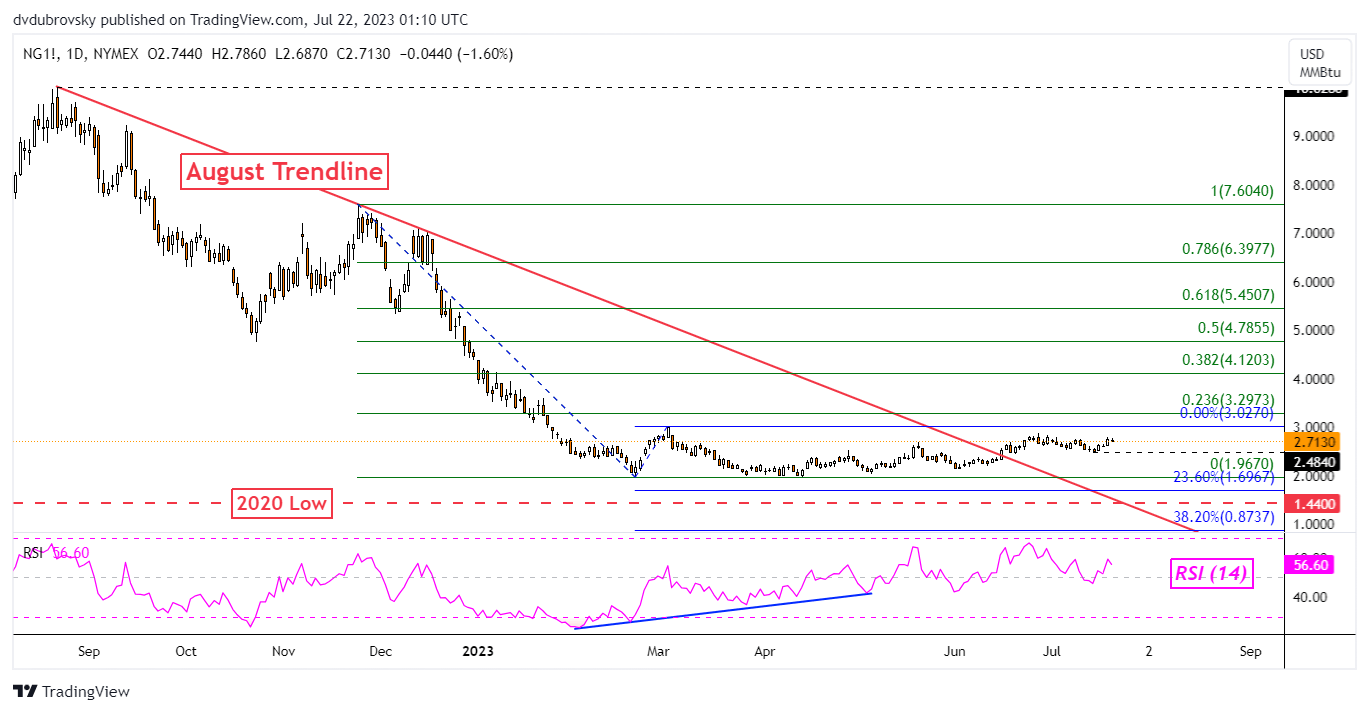
Last week, natural gas prices rallied about 6.9% in what was the best 5-day period since the middle of June. Yet, despite this performance, you can barely notice a change in meaningful trend on the daily chart below. The heating commodity remains broadly range-bound ever since prices stabilized around November.

While natural gas eventually broke above the falling trendline from August, meaningful upside progress has been lacking. Broadly speaking, the heating commodity remains stuck in a broad range between 1.967 and 3.027. Until a breakout is seen in either direction, the technical outlook remains mostly neutral.

Daily Chart – Range-Bound

4-Hour Chart – Eyes on 20-Day SMA

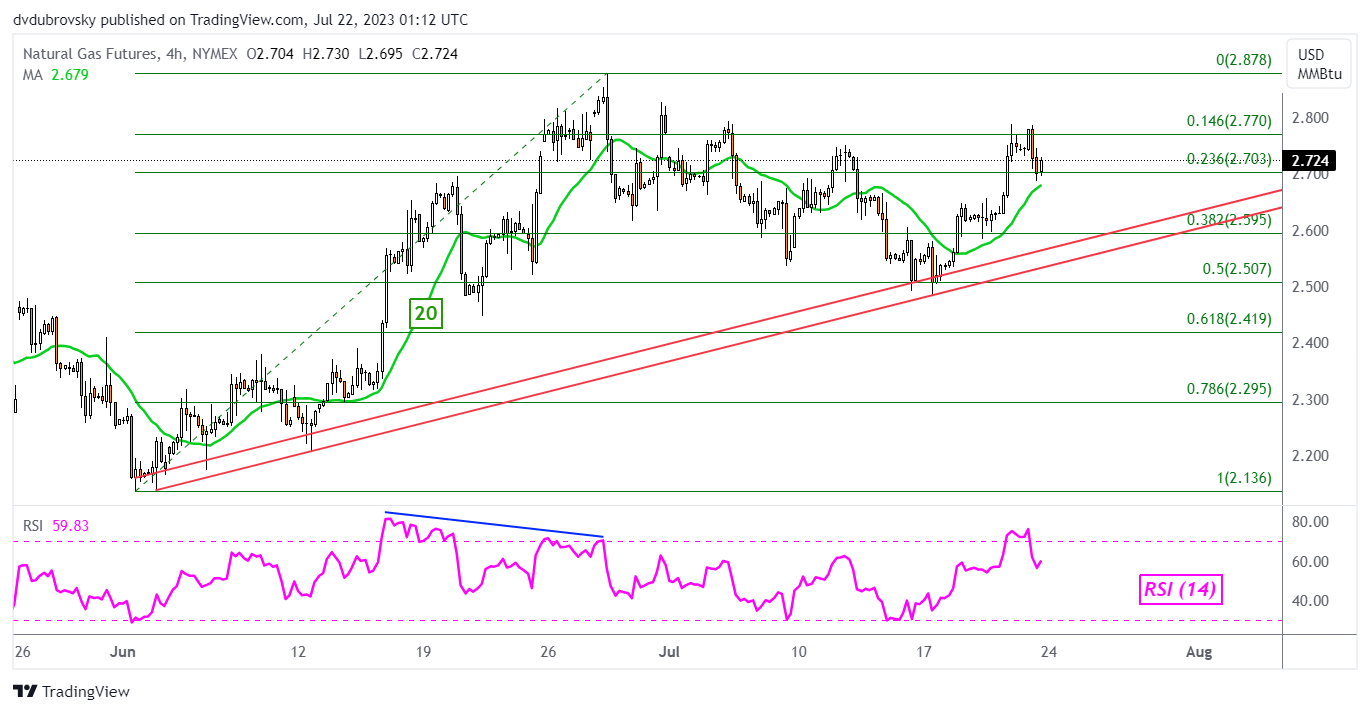
The 4-hour chart can give us a better idea of what might be in store in the near term while the broader picture remains neutral. Last week’s rally established new resistance as the minor 14.6% Fibonacci retracement level at 2.77. Immediate support seems to be the 23.6% point at 2.703.

Meanwhile, the 20-period Simple Moving Average (SMA) is cautiously creeping higher. This could reinstate a near-term upside technical bias in the week ahead. That would place the focus on the June 28th high of 2.878.

Otherwise, falling under the moving average subsequently exposes a rising range of support from the beginning of June. That is maintaining the near-term upside bias in the short-to-medium term. A breakout through this zone would open the door to a bearish perspective toward the June low of 2.136.

image2.png

Japanese Yen Slides as Speculation Mounts Ahead of BoJ Meeting. Where to for USD/JPY?

Japanese Yen Slides as Speculation Mounts Ahead of BoJ Meeting. Where to for USD/JPY?

The Japanese Yen slumped last week with USD/JPY rallying to make a peak just shy of 142.00 after having visited 137.25 just 10 days ago.

The weakening of the Yen comes ahead of the Bank of Japan’s (BoJ) monetary policy meeting this Friday.

The BoJ currently have a policy rate of -0.10% and is maintaining yield curve control (YCC) by targeting a band of +/- 0.50% around zero for Japanese Government Bonds (JGBs) out to 10 years.

Speculation has been rife that BoJ Governor Kazuo Ueda might look to tweak YCC this year but the timeline for such a move, should it happen, remains opaque. This has led to market uncertainty around monetary policy and by extension, notable moves in USD/JPY.

Former BoJ Deputy Governor Masazumi Wakatabe spoke on Bloomberg television today and highlighted that clear communication is something that he thinks Governor Ueda has been trying to address.

The latest Japanese inflation read of 3.3% year-on-year is well above the 2% inflation target. The concern for the central bank is the sustainability of maintaining at such levels.

A hawkish turn too soon could steer the world’s third-largest economy back toward deflation, something that has periodically undermined the economy for decades.

Ahead of the BoJ gathering is the Federal Open Market Committee (FOMC) meeting on Wednesday, with interest rate markets looking for a 25 basis point lift in the target rate.

Once again, the language from Fed Chair Jerome Powell in the post-decision presser will be closely scrutinised for guidance of the Fed’s rate path.

US inflation has been decelerating in the last few months and this has led to speculation that there could be an easing of the hawkish rhetoric from the bank.

The implication for Treasury yields from the Fed’s conclave may impact USD/JPY. Looking at the spread between the US 10-year bond and same tenor JGB, a significant move in Treasury yields might see more volatility for USD/JPY.

USD/JPY AND YIELD SPREAD BETWEEN TREASURIES AND JGBS

image1.png


Asia Day Ahead: Sentiment in Check Ahead of US Fed Meeting

Asia Day Ahead: Sentiment in Check Ahead of US Fed Meeting

Wall Street were little changed last Friday amid subdued moves in the Treasury yields, while the US dollar saw further firming (+0.3%) following recent sell-off. Some reservations continue to linger around mega-cap tech stocks ahead of several key earnings this week in the likes of Alphabet, Microsoft and Meta Platforms, as recent releases from Netflix and Tesla suggest that earnings expectations may be priced close to perfection. Overbought technical conditions and ‘extreme greed’ sentiments as shown from the CNN Fear & Greed Index may call for some cooling in the recent equities rally, although the broader trend still leans towards an upward bias.

The start of the new trading week could potentially bring about some indecision, before volatility picked up on the onslaught of big tech earnings and the FOMC meeting towards the latter half, alongside meetings from the European Central Bank (ECB) and the Bank of Japan (BoJ). Up today, a series of global flash purchasing managers index (PMI) data will be on watch, with consensus largely for global economic conditions to stay soft.

With the pick-up in the US financial sector lately on earnings releases (XLF +3.1% over past week), perhaps one to watch may be the SPDR S&P Regional Banking ETF, which has recently broken above the neckline of an inverse head-and-shoulder formation. The neckline projection suggests an eventual target of the 56.10 level, with immediate resistance to overcome at the 46.94 level for now. Increasing moving average convergence/divergence (MACD) and a move above its 100-day moving average (MA) seem to support some upward momentum in place.
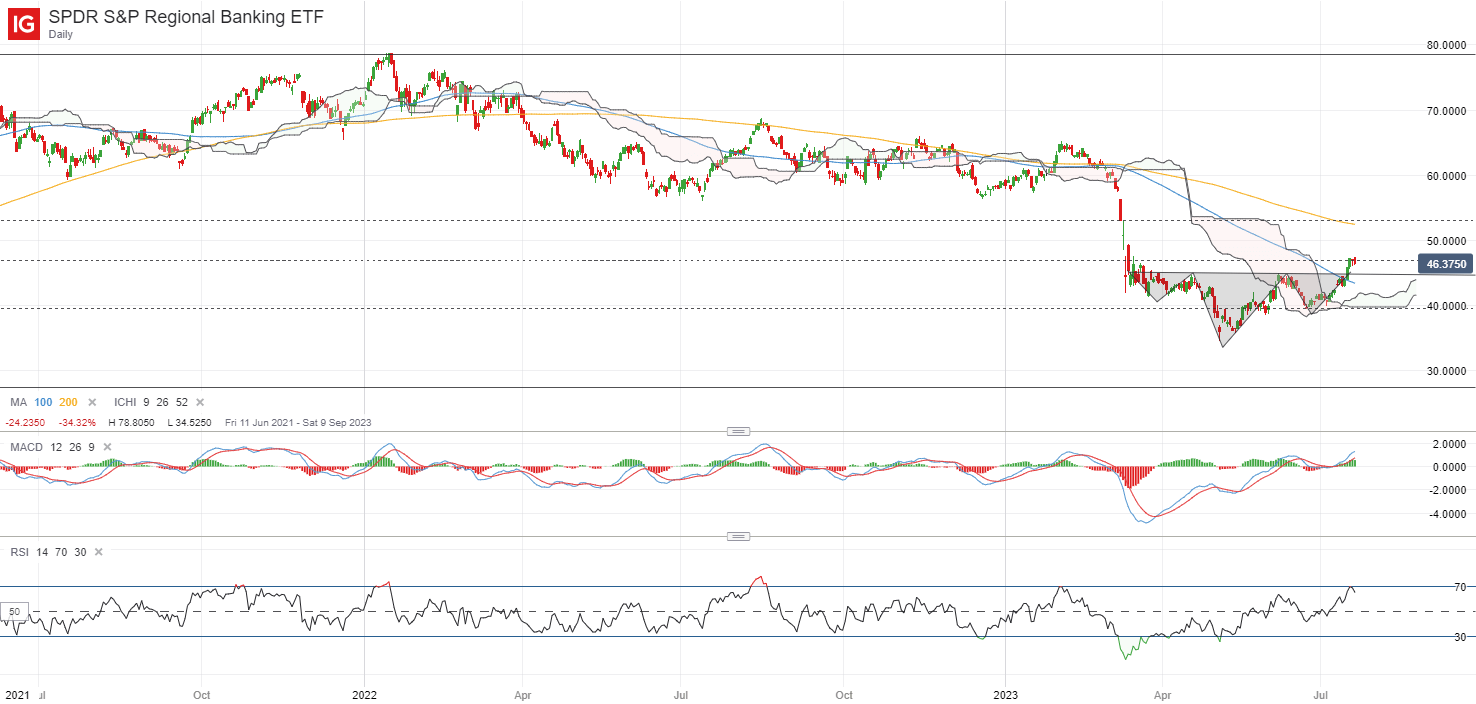
image1.png

Asia Open

Asian stocks look set for a positive open, with Nikkei +1.32%, ASX +0.04% and KOSPI +0.27% at the time of writing. Chinese equities were attempting to find their footing last Friday, with the Nasdaq Golden Dragon China Index eking out a 0.4% gain, following a 0.8% up-move in the Hang Seng Index in the earlier session. Recent stimulus measures to boost consumption of automobile and electronics items failed to provide much conviction that they will be sufficient to uplift the downbeat growth conditions, with mounting hopes on the China Politburo meeting this week for more follow-through.

Closer to home, Singapore’s consumer price index (CPI) will be on the radar today, with further moderation in pricing pressures likely to be the story. Headline inflation is expected to ease to 4.6% from previous 5.1%, while the core aspect is expected to head to 4.2% from the previous 4.7%, overall reflecting some progress in inflation and provide room for an extended pause in tightening from the Monetary Authority of Singapore (MAS).

The USD/SGD has been largely trading within a rectangle pattern since the start of the year, recently attempting to find support off the lower base at the 1.320 level. A bullish crossover on MACD and increasing RSI may point to near-term upward momentum as a reversion from oversold technical conditions plays out, but the broader consolidation pattern could still point towards wider indecision. Near-term, any softer-than-expected read in inflation figure could potentially leave the 1.338 level on watch as immediate resistance to overcome.
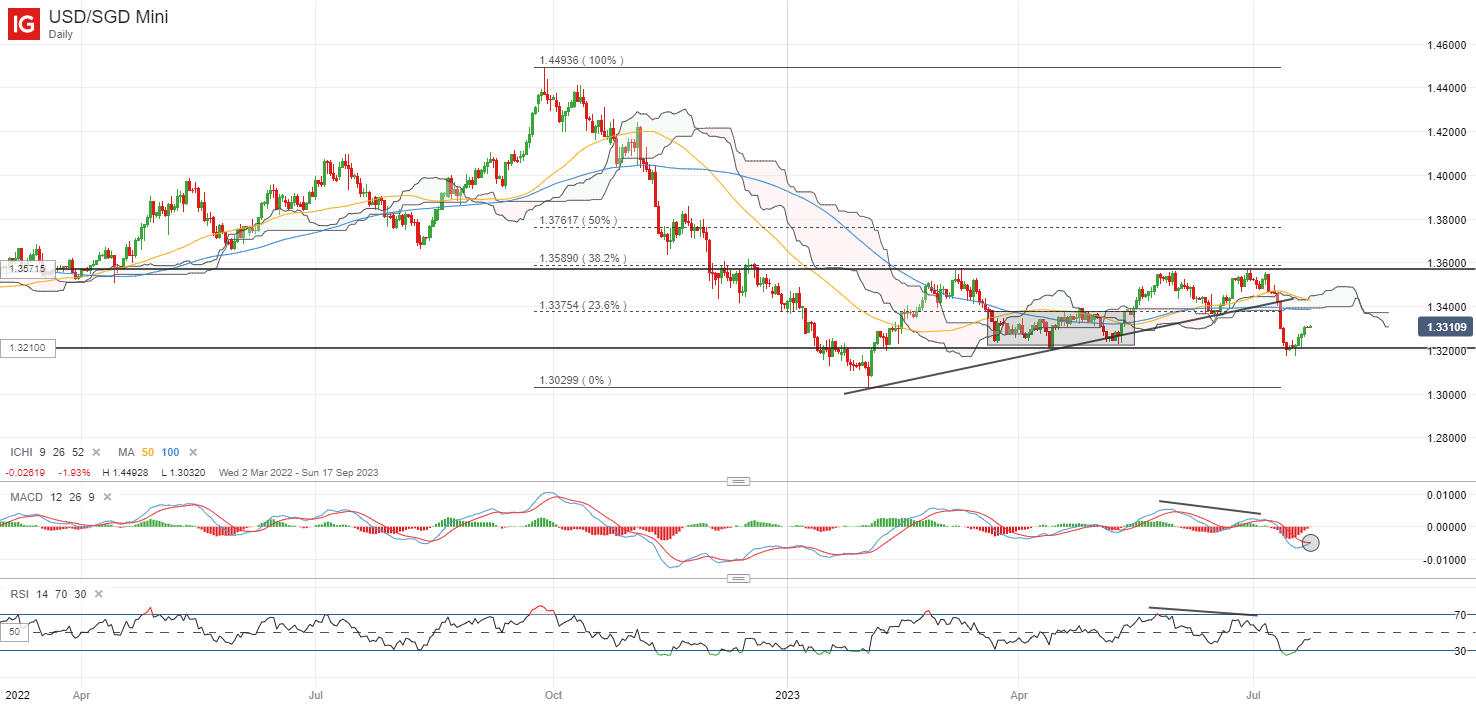
image2.png

On the watchlist: Gold prices on watch in lead-up to FOMC meeting this week

Into the FOMC meeting this week, expectations were priced for the Fed to deliver its last 25 bp rate hike before a prolonged pause in its hiking cycle through the rest of the year. Any emphasis on a more data-dependent stance from the Fed at the upcoming meeting could be viewed as less hawkish, which may aid to limit the downside for gold prices. Thus far, gold prices have recovered as much as 4.5% in July on a softer US dollar and lower Treasury yields, but are facing some resistance at the US$1,980 level.

The recent CFTC data has revealed a sharp build-up in net-long positions among money managers to its two-month high last week (135,907 contracts, up from 100,619 contracts the week before). For now, its weekly Relative Strength Index (RSI) has also managed to defend its key 50 level. Greater conviction for buyers may have to come from a reclaim of its key psychological US$2,000 level, with any successful attempt potentially placing its 2023 high back on the radar for a retest.
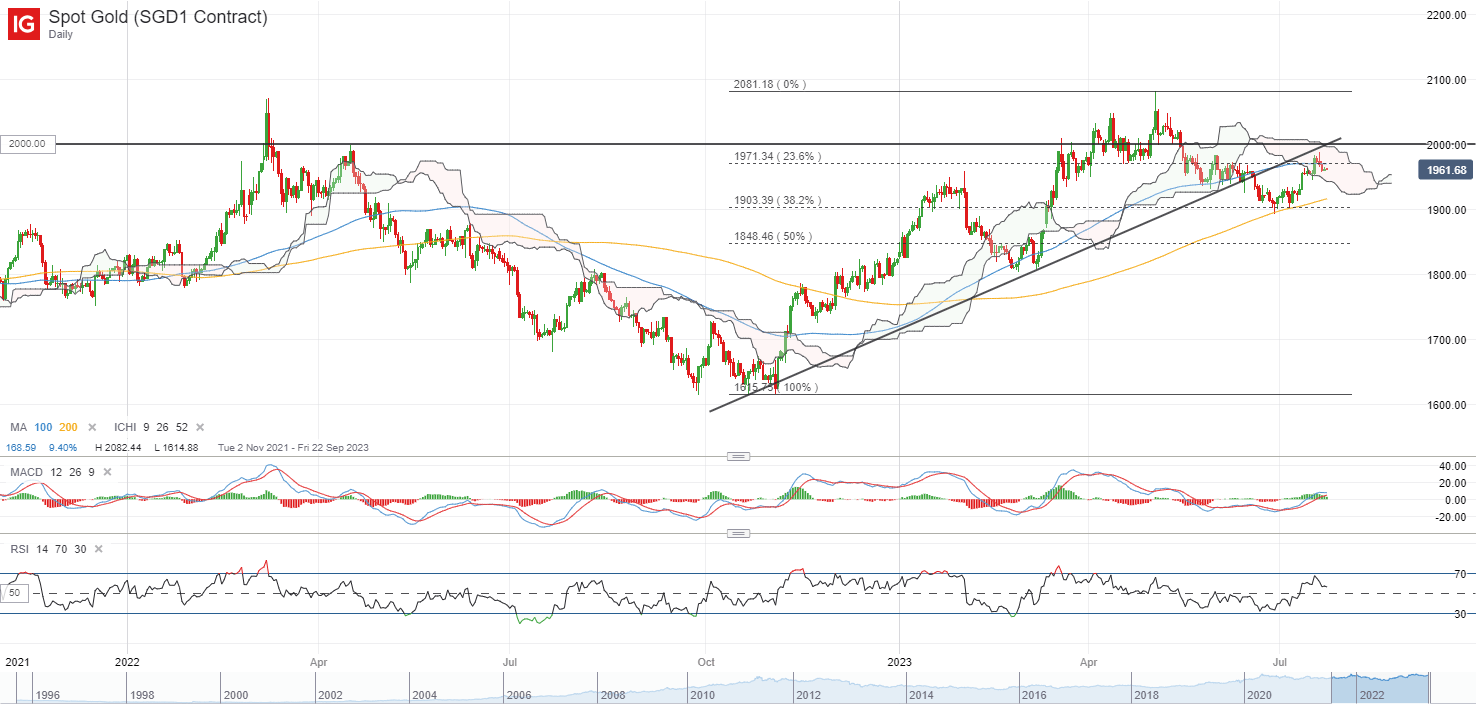

image3.png

New Zealand Dollar Ahead of Fed Rate Decision; NZD/USD, AUD/NZD, EUR/NZD Price Setups

New Zealand Dollar Ahead of Fed Rate Decision; NZD/USD, AUD/NZD, EUR/NZD Price Setups

Those looking for directional plays in the New Zealand dollar against some of its peers may have to wait a little longer, at least until there are signs of divergence in monetary policy outlooks.

Converging monetary policy outlooks have left currency pairs to the ebb and flow of data, which tends to be at best noise unless viewed from a zoomed-out perspective. In this regard, the key focus is on the US Fed rate decision on Wednesday. The central bank is widely expected to raise interest rates one last time this year, with the key focus on its forward guidance.

A hawkish hike could provide support to the US dollar globally. A more data-dependent / ‘wait-and-watch’ could put USD back within its recent ranges, whereas a dovish hike could exert downward pressure on USD, boosting NZD.

The Reserve Bank of New Zealand kept interest rates on hold earlier this month, with a view that NZ rates are at their peak. However, stubbornly high NZ inflation (climbed 1.1% on-month in the June quarter Vs 0.9% expected) complicates the policy outlook. Markets are pricing in around a 50% chance of another RBNZ rate hike with no rate cuts until mid-2024.

NZD/USD Daily Chart

image1.png

NZD/USD: Looking for a clear direction

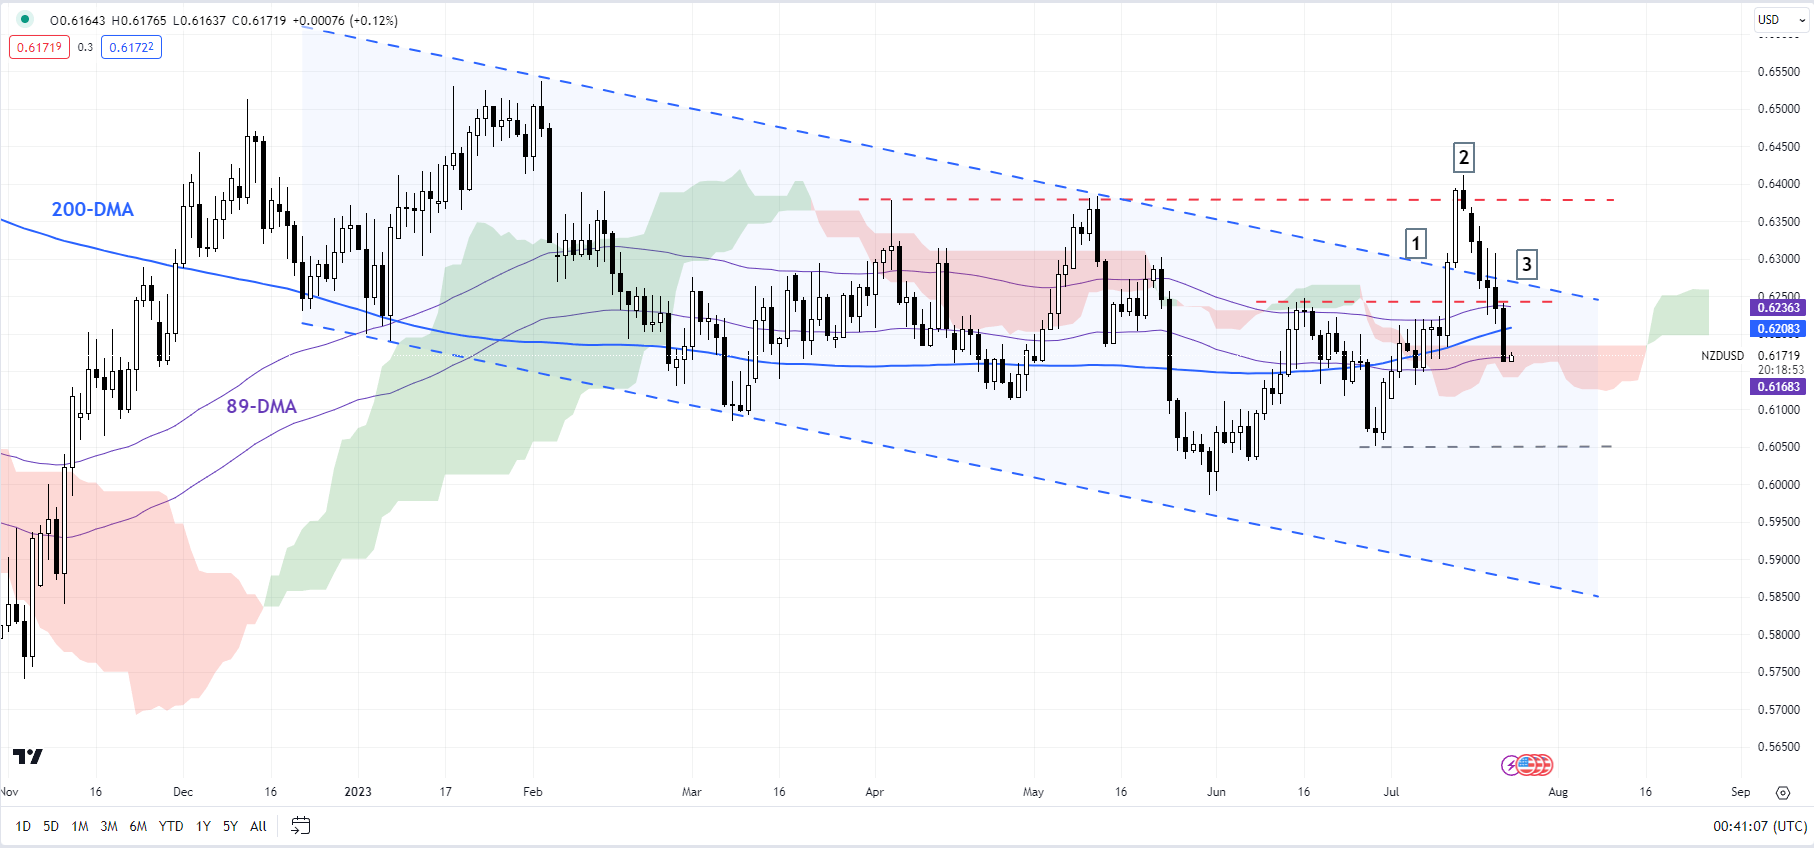
On technical charts, three signs indicate NZD/USD remains at best within its well-established range from March. NZD/USD rose in mid-July above key resistance on the upper edge of a downtrend channel since the start of the year but subsequently failed to cross another vital hurdle at the May high of 0.6385.

As mentioned in the previous update, a move above 0.6385 is vital for the broader bearishness to reverse. See “New Zealand Dollar Flexes Muscles Ahead of RBNZ; NZD/USD, EUR/NZD, GBP/NZD Price Action”, published July 11. Last week’s fall below the resistance-turned-support at 0.6250 has scaled back the upward pressure, putting NZD/USD back within its well-defined range. A fall below the May low of 0.6000 would be needed for the broad bearishness to resume.

AUD/NZD Daily Chart

image2.png

AUD/NZD: Re-attempting to form a base?

AUD/NZD has been essentially sideways since the beginning of the year. The broader range established is 1.05-1.11, though most recently, it has narrowed a shade to 1.06-1.11. Interestingly, the cross is attempting to form a higher base, assuming last week’s rebound trickles through. The higher-high-higher-low pattern since April is another sign of a potential uptrend. Key support is around 1.0700, including an uptrend channel from April and a rising pitchfork channel from December.

EUR/NZD Weekly Chart

image3.png

EUR/NZD: Dark clouds clearing?

EUR/NZD’s hold above key support on a horizontal trendline from October (at about 1.7550) has meant that the uptrend remains intact. That is, despite the choppy price action since April, EUR/NZD hasn’t broken any significant pivot support. However, the cross needs to break above the immediate barrier at the April high of 1.81 for the uptrend to resume. A failure to do so would imply a continuation of the 1.72-1.81 range.

US Dollar Holds the High Ground Ahead of Fed, ECB and BoJ Meetings. Higher USD?

US Dollar Holds the High Ground Ahead of Fed, ECB and BoJ Meetings. Higher USD?

The US Dollar has mostly held onto the gains seen last week ahead of crucial central bank meetings this week.

The Federal Open Market Committee (FOMC) gathering on Wednesday will kick things off ahead of the European Central Bank (ECB) on Thursday and the Bank of Japan (BoJ) on Friday.

Interest rate markets are pricing in a 25 basis point (bp) lift from the Fed and the ECB but no change from the BoJ. The focus at all three conclaves is likely to be on the language and signalling that might emanate from the post decisions commentary.

APAC equities have had a mixed day with Hong Kong’s Hang Seng Index (HSI) slipping lower with hopes of a big stimulus package emerging from China’s Politburo meeting diminishing.

On the other side of the ledger, Japanese indices ran higher on Monday with the Yen mostly maintaining the losses seen from last week. This has led to market perceptions of a boost to exporters there.

Currency markets have had a benign start to the week so far after some decent moves last week. The Aussie, Kiwi and Sterling saw notable declines against the US Dollar and have seen little movement today.

Treasury yields appear contained for now ahead of the FOMC meeting with the benchmark 2-year note trading near 4.85% while the 10-year bond is around 100 bp lower at 3.85%.

Gold has eased slightly, trading near US$ 1,960 at the time of writing while crude oil steadied after initial losses at the open. The WTI futures contract is near US$ 77 bbl while the Brent contract is around US$ 81 bbl.

Today’s economic calendar is dominated by PMI readings across Europe and North America.

DXY (USD) INDEX TECHNICAL ANALYSIS

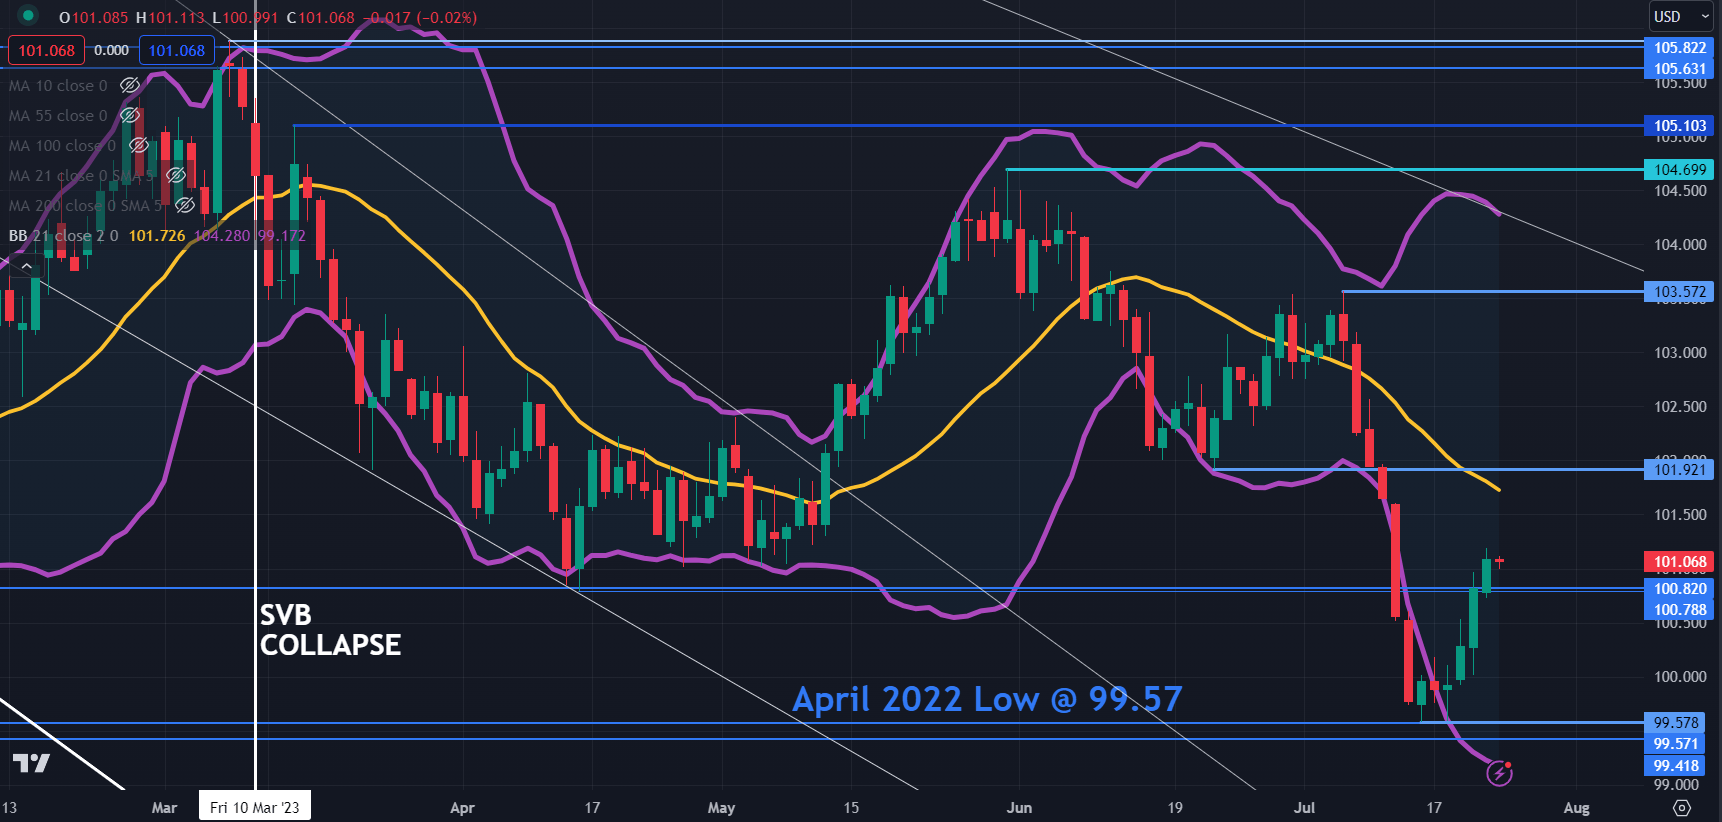
The DXY (USD) index made a 15-month low 10 days ago at 99.58 which was just above the April 2022 low of 99.57.

Those levels could provide support ahead of a breakpoint at 99.42. Ahead of those levels, support may lie near a series of breakpoints around 100.80

That sell-off saw the price break below the lower band of the 21-day simple moving average (SMA) based Bollinger Band.

Once it closed back inside the band a bullish few days unfolded as discussed here at this time last week.

On the topside, resistance could be at the breakpoint of 101.92 ahead of the prior peak at 103.57.

image1.png


Euro Breaking News: Dreadful German PMI Pushes EUR/USD Below 1.11

Euro Breaking News: Dreadful German PMI Pushes EUR/USD Below 1.11

EURO FUNDAMENTAL BACKDROP

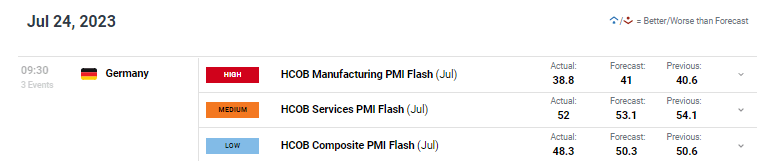
The euro’s recent struggles got worse this morning after German HCOB PMI data (see economic calendar below) missed on all fronts with manufacturing contracting further while services (the country’s major GDP contributor) slipping to 52 but remaining within expansionary territory. Germany being the largest eurozone economy, serves as a proxy for the region and with similar figures reflected by the French release, EZ data to come will likely echo this sentiment. Some important commentary from the report includes (Source: S&P Global):

  • “Services new business falls for the first time in six months.”
  • “There is an increased probability that the economy will be in recession in the second half of the year.”
  • “The composite index moved into sub-50 contraction territory for the first time since January.”
  • “The pace of employment growth across the German private sector slowed sharply in July.”

EUR/USD ECONOMIC CALENDAR (GMT +02:00)

image1.png

Source: DailyFX economic calendar

The upcoming European Central Bank (ECB) interest rate decision this week will need to consider this data and the swift slowdown in economic data. Although I do not expect a change in current market pricing (refer to table below) that favors a 25bps hike with almost 100% certainty, subsequent guidance thereafter may begin on a dovish trajectory that could expose the euro further.

EUROPEAN CENTRAL BANK INTEREST RATE PROBABILITIES

image2.png

TECHNICAL ANALYSIS

EUR/USD DAILY CHART

image3.png

Chart prepared by Warren Venketas, IG

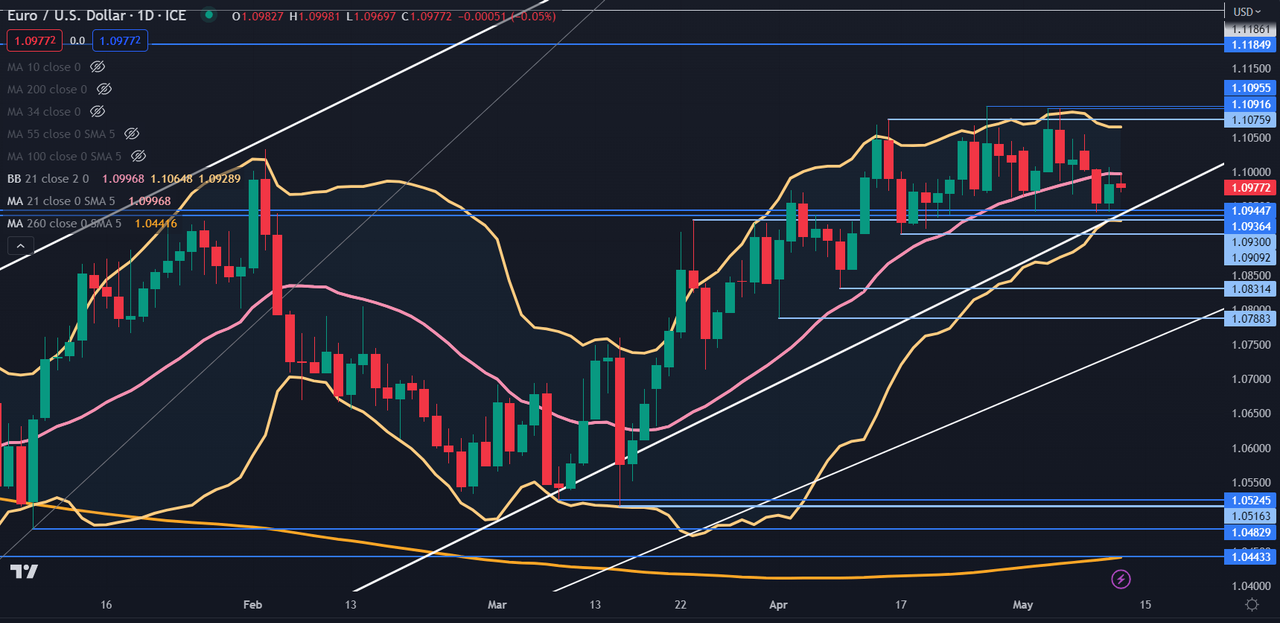
Daily EUR/USD price action above has maintained its bearish course now below the 1.1096/1.1100 zone ahead of the highly anticipated ECB rate decision. With more scope for a dovish repricing from the ECB relative to the Fed, the pair may well extend its downside towards the 1.1000 psychological support handle.

Resistance levels:

  • 1.1300
  • 1.1185
  • 1.1096

Support levels:

  • 1.1000

IG CLIENT SENTIMENT DATA: BEARISH

IGCS shows retail traders are currently SHORT on EUR/USD, with 65% of traders currently holding short positions (as of this writing). At DailyFX we typically take a contrarian view to crowd sentiment but due to recent changes in long and short positioning we arrive at a short-term downside bias.