Gold Boosted by US CPI; Reverse Head & Shoulders Triggers in XAU/USD

Gold Boosted by US CPI; Reverse Head & Shoulders Triggers in XAU/USD

Gold rebounded after US inflation slowed more than expected in June, reinforcing market expectations that the US Federal Reserve is nearing the end of its tightening cycle.

US CPI rose 0.2% on-month in June, the smallest gain since August 2021, compared with 0.3% expected. Core CPI moderated to 4.8% on-year Vs 5% expected and 5.3% in May. Still, rate futures are showing a 92% chance of a 25-basis point hike at the July 25-26 meeting, and a small chance of another hike before the year-end, according to the CME FedWatch tool.

However, markets are pricing in rate cuts starting in H1-2023, with nearly 5 rate cuts by the end of next year. The market’s expectations contrast with the Fed’s projected two rate hikes before the year-end and no rate cuts until 2025. Wednesday’s data has further reinforced the market’s dovish pricing. Having said that, given that inflation continues to be well above the Fed’s target and the labour market remains resilient, a rate hike at the July meeting could yet go through. Beyond that, it remains highly uncertain, both in terms of whether rate hikes happen and by how much.

XAU/USD 240-minute Chart
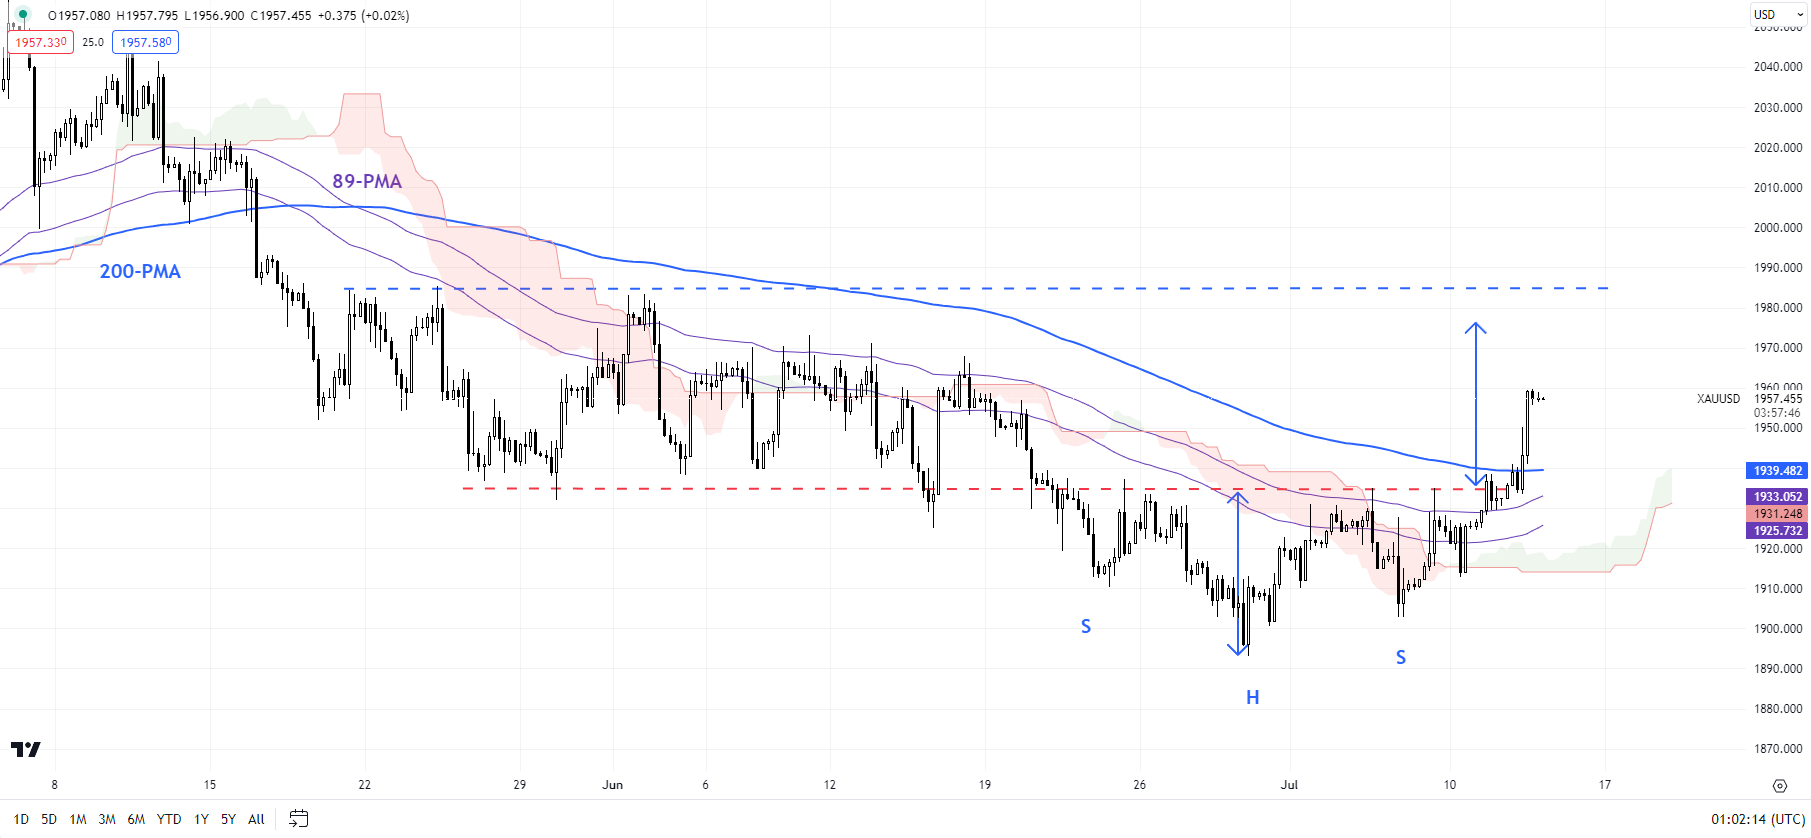
image1.png

Chart Created by Manish Jaradi Using TradingView

On technical charts, the downward pressure has eased after XAU/USD rose above the key resistance area 1935-1945 (including the end-June high, the 89-period moving average, and the 200-period moving average on the 240-minute charts). The break has triggered a minor reverse head & shoulders pattern (the left shoulder is at the late-June low, the head at the end-June low, and the right shoulder is at the early-July low), with a potential price objective of around 1980, close to the early-June high of 1983.

XAU/USD Daily Chart
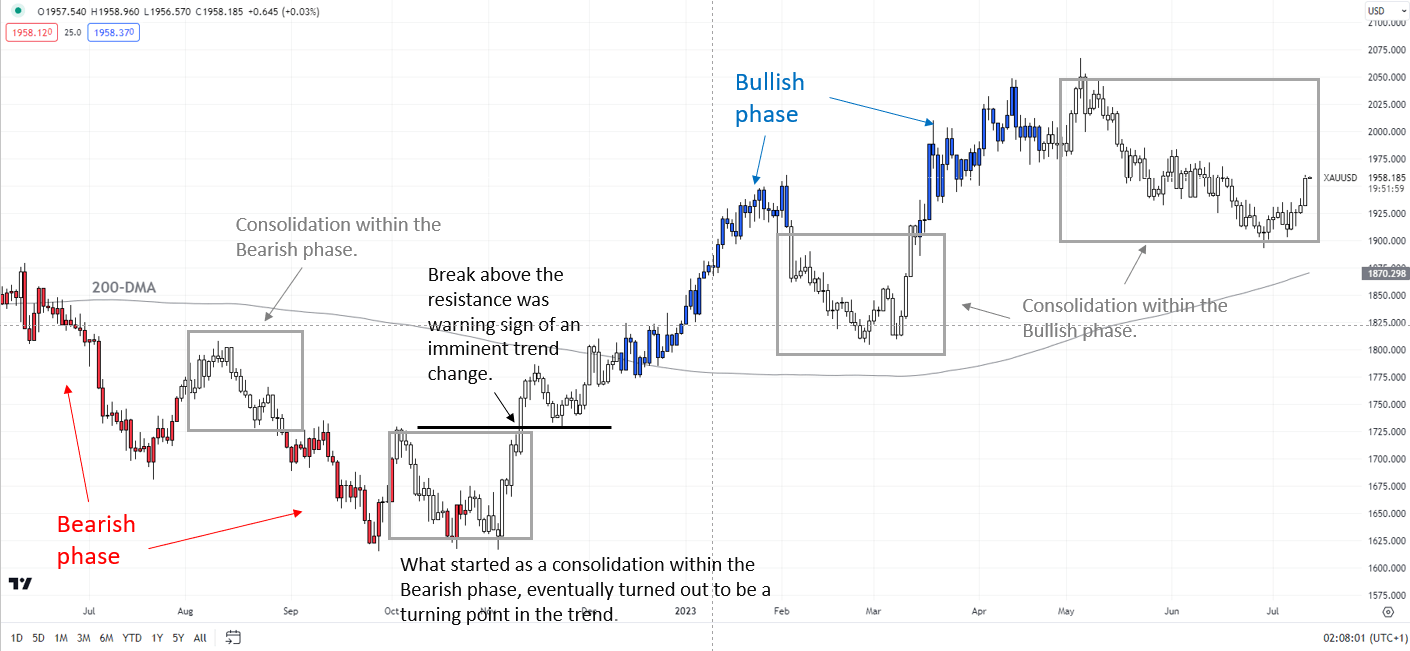
image2.png

Chart Created by Manish Jaradi Using TradingView; Notes at the bottom of the page.

Intraday technical charts were showing a loss in downward momentum going into US jobs data on Friday. Moreover, XAU/USD met the price objective of a bearish triangle triggered in late June. For more discussion, see “Gold Slips After FOMC Minutes; XAU/USD Scenario Ahead of US Jobs Data”, published July 6.

Zooming out, gold remains in a consolidation phase within the broader uptrend, as the daily colour-coded candlestick charts show. However, beyond the daily charts, higher timeframe charts have shown fatigue in gold’s rally. See “Gold Could Find It Tough to Crack $2000”,published March 28, and “Gold Weekly Forecast: Is it Time to Turn Cautious on XAU/USD?” published April 16.

Note: The above colour-coded chart(s) is(are) based on trending/momentum indicators to minimize subjective biases in trend identification. It is an attempt to segregate bullish Vs bearish phases, and consolidation within a trend Vs reversal of a trend. Blue candles represent a Bullish phase. Red candles represent a Bearish phase. Grey candles serve as Consolidation phases (within a Bullish or a Bearish phase), but sometimes they tend to form at the end of a trend. Candle colors are not predictive – they merely state what the current trend is. Indeed, the candle color can change in the next bar. False patterns can occur around the 200-period moving average, or around a support/resistance and/or in sideways/choppy market. The author does not guarantee the accuracy of the information. Past performance is not indicative of future performance. Users of the information do so at their own risk

EUR/USD Soars on USD Weakness, EUR/GBP Struggles Against GBP Strength

EUR/USD Soars on USD Weakness, EUR/GBP Struggles Against GBP Strength

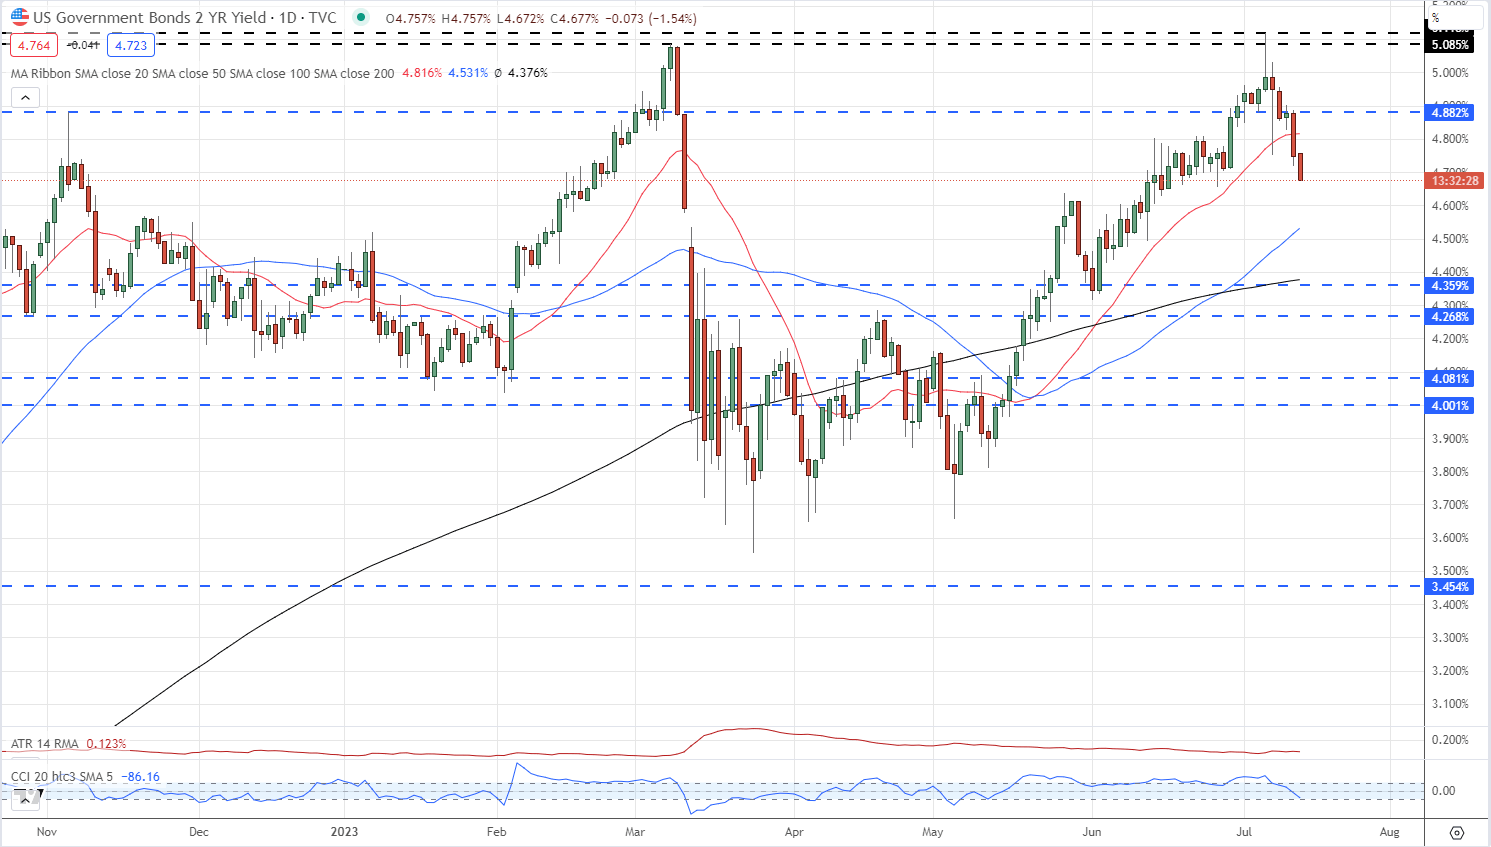
The latest US inflation report showed price pressures easing by more than anticipated, a much-needed boost for the Federal Reserve as they continue to tackle inflation. Yesterday’s release sent US Treasury yields tumbling further as traders continue to price in a potential ’one and done’ on US rate hikes. The Fed is fully expected to hike rates by 25 basis points later this month, but with inflation easing, they may have more room to leave rates unchanged in the months ahead. The recent sell-off in bond yields and US dollar weakness support the peak rate idea. The rate-sensitive two-year UST has shed 40 basis points in the last week.

US Treasury Two-Year Yields

image1.png

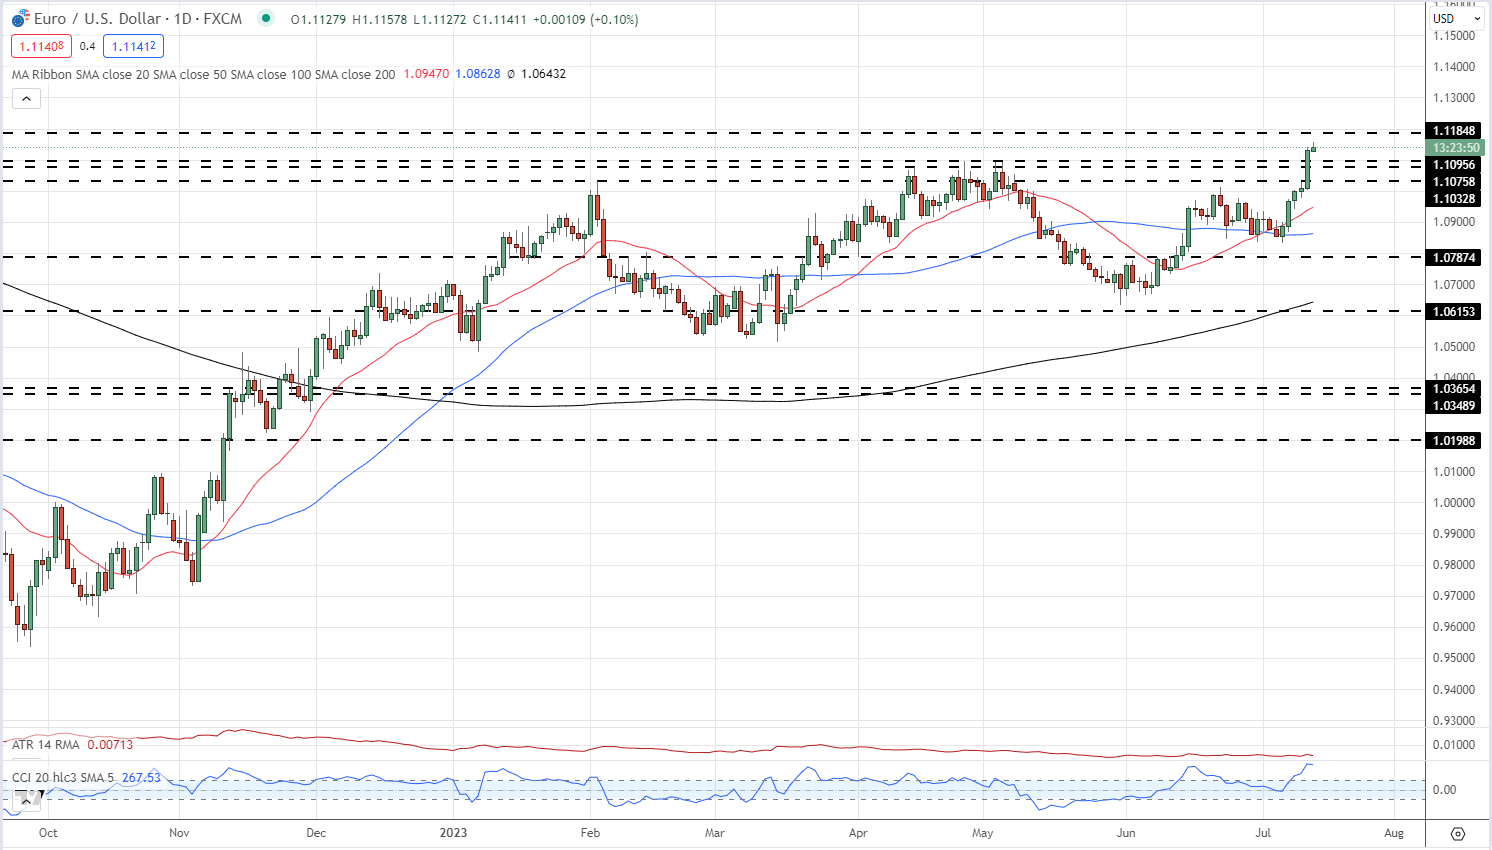
This US dollar weakness can be seen clearly against the Euro with EUR/USD now back at highs seen around 15 months ago. Prior resistance highs made in mid-April to early May were broken in one daily candle yesterday, and if the pair consolidate above 1.1096 then these old levels of resistance may turn into levels of support. The CCI indicator at the bottom of the chart shows the pair as heavily overbought, so this needs to be normalized before EUR/USD can push further ahead. The next level of resistance is close by at 1.1185 after which 1.1250 comes into consideration.

EUR/USD Daily Price Chart – July 13, 2023

image2.png

Retail Short GBP/USD – Large Weekly Change

Retail trader data shows 28.45% of traders are net-long with the ratio of traders short to long at 2.52 to 1.The number of traders net-long is 4.10% lower than yesterday and 35.07% lower than last week, while the number of traders net-short is 6.15% higher than yesterday and 38.55% higher than last week.

We typically take a contrarian view to crowd sentiment, and the fact traders are net-short suggests GBP/USD prices may continue to rise. Traders are further net-short than yesterday and last week, and the combination of current sentiment and recent changes gives us a stronger GBP/USD-bullish contrarian trading bias.

UK Economy Shrinks Less Than Expected in May, GBP/USD Breaches 1.3000

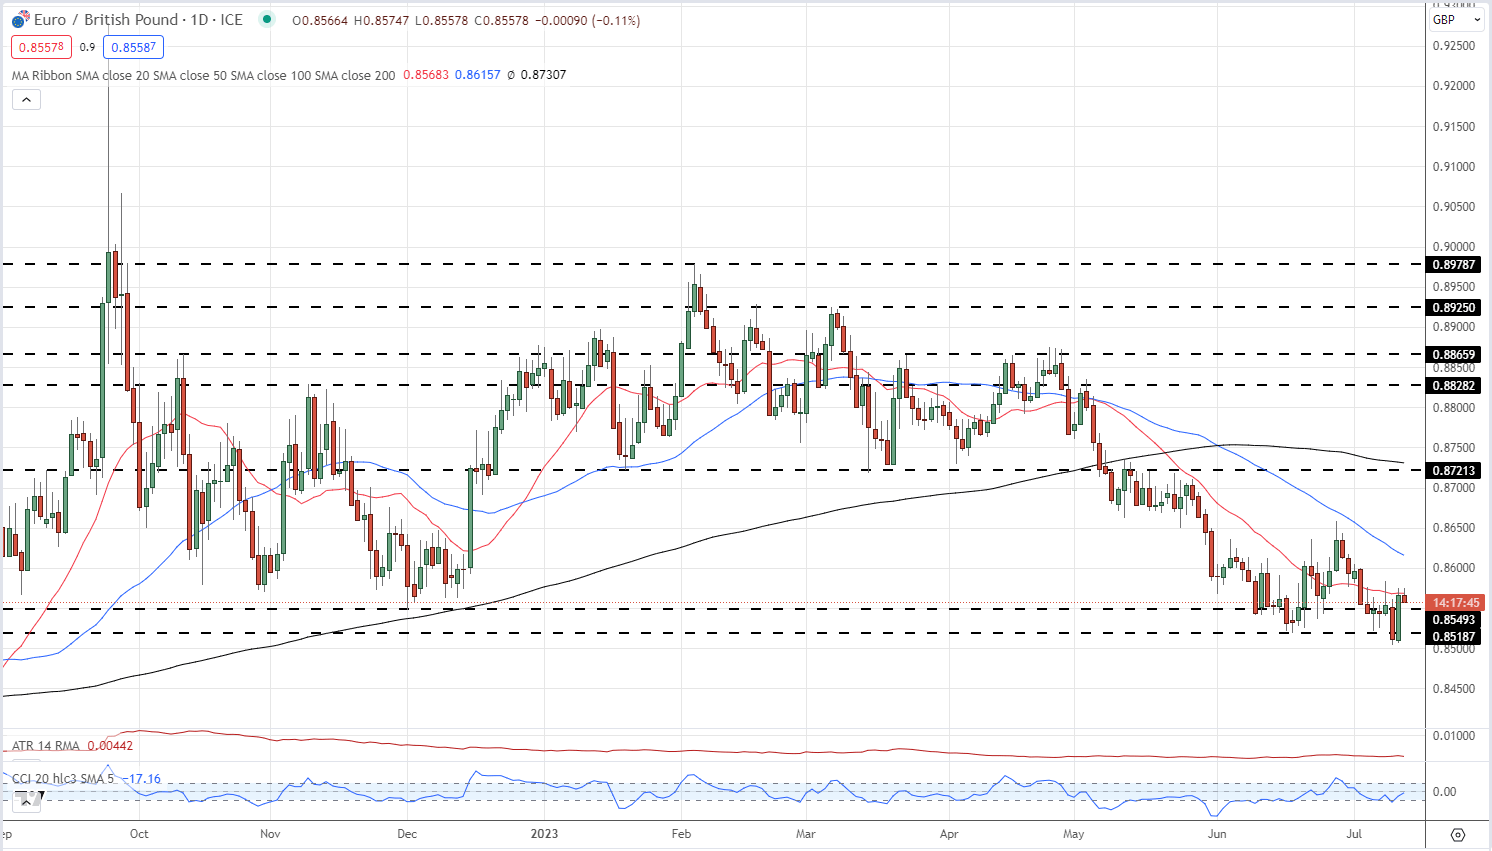
EUR/GBP is a different story with the pair continuing to drift lower. EUR/USD printed a 0.8979 multi-month high at the start of February and since then the pair have moved lower, making an unbroken series of lower highs and lower lows. Sterling remains supported by elevated bond yields and expectations that the Bank of England will continue hiking rates ever higher. The wider the interest differential becomes between the British Pound and the Euro, the lower EUR/GBP will go.

EUR/GBP Daily Price Chart – July 13, 2023

image3.png

What is your view on the EURO – bullish or bearish?? You can let us know via the form at the end of this piece or you can contact the author via Twitter

Markets Might be Pricing in Policy Uncertainty That May Present Opportunities

Markets Might be Pricing in Policy Uncertainty That May Present Opportunities

Going into the third quarter, the macro environment for financial markets is characterized by several central banks potentially nearing the peak in the tightening cycle. The lingering issue in most parts of the world is that inflation remains stubbornly elevated.

The notable exceptions from a tightening policy are the Bank of Japan and the People’s Bank of China where policy remains relatively loose.

However, for most Western central banks, the narrative is focusing on the data as it comes to hand and policy being adjusted accordingly to the new information.

This has created scenarios across several asset classes whereby large, sustainable trends are not unfolding. Rather, range trading type environments are permeating across many markets.

What can also be observed is that when the ranges break to the topside or the downside, the price has often retreated back inside the range. Sometimes the market goes on to create a new range at differing levels to the prior range.

This price action could be attributed to the uncertainty around monetary policy but ultimately, it doesn’t matter what is the root cause. What matters is the potential opportunity of having this understanding of market behavior.

AUD/USD is a prime example of this false break of the range. It traded within a 0.6560 – 06820 range for 3 months before breaking to the downside in late May. After making a low near 0.6460, it then moved back up inside the range and continued higher to then break the topside of the range in June.

After making that peak near 0.6900, the price again fell back into the range.

AUD/USD CHART

image1.png


Gold is another example. At the time of going to print, it just broke below the prior low that had held for 3 months. It remains to be seen if the price will recover. Steeping back a touch, gold remains within the 1,810 – 2,085 range that is been for all of 2023.

GOLD CHART

image2.png

Chart prepared by Dan McCarthy, created with TradingView

Looking forward, the trade opportunity may lie in the monitoring of range breaks across various markets and being prepared for potential false breaks.

These breaks outside the established ranges are often accompanied by stop-loss orders being triggered. Once those positions have been cleared out, a reversal might be worth paying attention to.

UK Economy Shrinks Less Than Expected in May, GBP/USD Breaches 1.3000

UK Economy Shrinks Less Than Expected in May, GBP/USD Breaches 1.3000

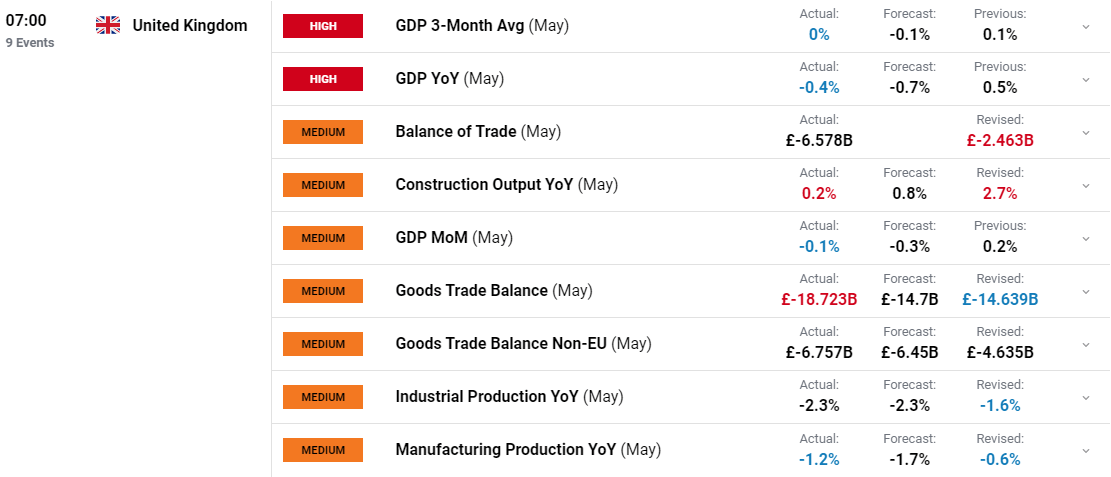
UK real GDP monthly is estimated to have fallen by 0.1% in May 2023 after growth of 0.2% in April 2023. Looking more broadly at the data and GDP has shown no growth in the 3 months to May 2023. Monthly GDP fell by 0.4% in May 2023 compared with the same month last year. For comparison, monthly GDP grew by 0.5% between April 2022 and April 2023. According to ONS data it is important to remember the Platinum Jubilee which resulted in an additional working day in May but 2 fewer days in June which could have a bearing on the final data print when compared to the same period in 2022.

UK Chancellor Hunt commented that the extra bank holiday had an impact on growth in May with inflation remaining a drag on economic growth prospects.

image1.png

Customize and filter live economic data via our DailyFX economic calendar

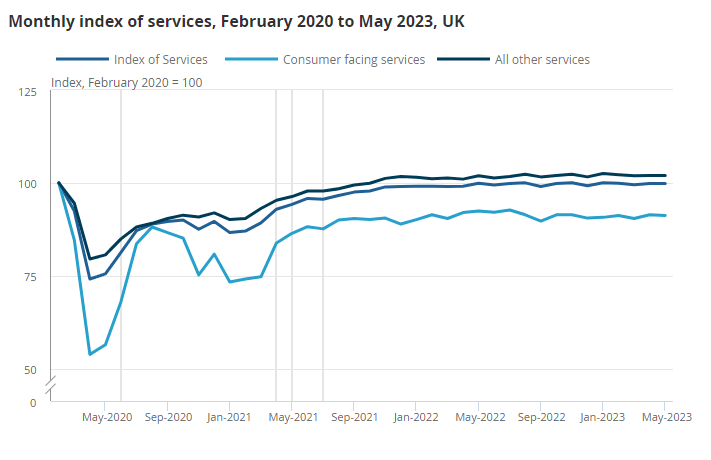
The Services sector no growth in May 2023, following growth of 0.3% in April 2023. Overall, the services sector showed no growth in the three months to May 2023 compared with the three months to February 2023. The largest increase was a 1.1% increase in human health and social work activities which was largely offset by a 0.5% decline in wholesale and retail trade and repair of motor vehicles and motorcycles.

UK GDP is now estimated to be 0.2% above its pre-covid levels from February 2020.

image2.png

UK GROWTH PROSPECTS FOR 2023 AND THE BANK OF ENGLAND

The Bank of England Governor Andrew Bailey spoke this week following a rise in wages in the UK which had seen rate hike expectations increase. Governor Bailey still believes the UK is on the correct trajectory in its fight against inflation sticking by his rhetoric that inflation is expected to fall significantly in Q2 of 2023. The Governor also stated that the economy as well as UK banks are coping at the moment despite the unprecedented rate hikes over the past 18 months.

Despite the fact that UK GDP is higher than pre-pandemic Feb 2020 level there remains a concern that the Bank of England will need to reach a more restrictive rate in order to bring down inflation. This could in turn lead the UK economy into a recession with Chancellor Hunts comments today reiterating the effects inflation is having on the economy. All eyes on the BoE now heading toward the August MPC meeting.

MARKET REACTION

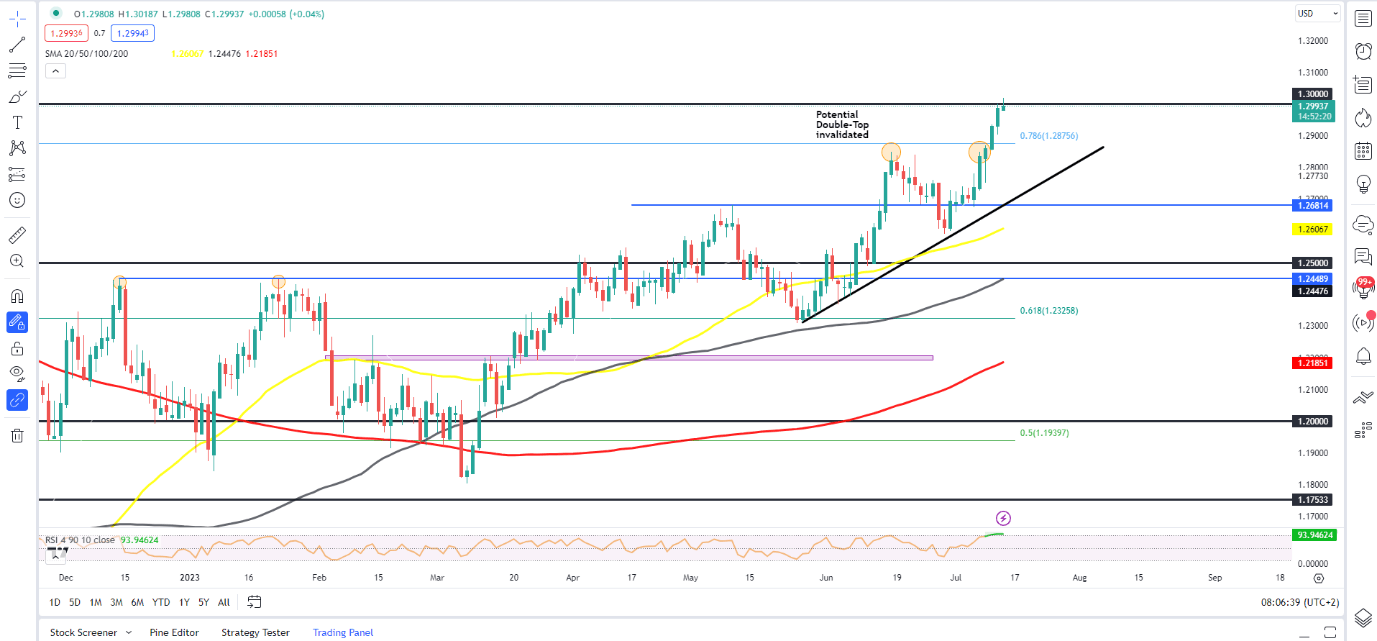
The initial market reaction following the news has seen GBPUSD remain flat following yesterday’s rally as the psychological 1.3000 level was breached. Looking at the bigger picture from a technical perspective, GBPUSD price failed to close above the 1.3000 handle for now and failure to do so could see cable put in a retracement toward support at 1.2875.

Taking a look at the IG client sentiment data and we can see that retail traders are currently net SHORT on GBPUSD with 71% of traders holding short positions (as of this writing). At DailyFX we typically take a contrarian view to crowd sentiment meaning we could see GBPUSD prices continue to rise following a short retracement to the downside.

GBPUSD Daily Chart, July 13, 2023

image3.png

Better to Bet on Cool US CPI Print Than Hot One, JPMorgan Sales Team Says

Better to Bet on Cool US CPI Print Than Hot One, JPMorgan Sales Team Says

Traders hoping to profit from a surprise reading in Wednesday’s consumer inflation data may be better off positioning for it to come in below forecasts, according to JPMorgan Chase & Co.’s sales and trading desk.

While the consensus estimate for June’s consumer price index is for a 3.1% annualized pace, the bank’s team including Andrew Tyler sees a four-in-five chance for the data to arrive in line or below the estimate, a range of outcomes that can bolster equities, all else equal.

In two contrasting tail-risk scenarios where the CPI reading presents a market shock, the team assigns a 10% probability that inflation slows drastically and the S&P 500 surges in response. Those odds are twice as high as the opposite situation, where a significant rebuilding in pricing pressures sends stocks reeling.

Put another way, the team expects a yearlong inflation slowdown to allow the Federal Reserve to ease off its monetary tightening campaign, a backdrop that bodes well for stocks.

“Think this print pushes the market closer to Goldilocks where we have economic growth, earnings growth, and normalized inflation,” Tyler and his colleagues wrote in a note to clients this week. “While the bull case does not require a pause/skip at the July Fed meeting, it would certainly magnify the upside potential.”

In the most likely scenario laid out by the team, CPI comes in between 3% and 3.2%, and the S&P 500 adds 0.5% to 0.75%. An inflation reading at 2.7% or lower is expected to spark a rally of at least 2.5% in the equity benchmark.

The trajectory of inflation has become a focal point for Wall Street traders in recent years, particularly after the Fed under-estimated the stickiness of pricing pressure and then rushed to hike interest rates at a pace not seen in decades.

Market volatility regularly spiked around the release in 2022 though angst has receded this year. The Cboe 1-Day Volatility Index, a gauge of the S&P 500’s expected price swings in the next 24 hours, last traded near 16. That’s lower than any pre-CPI sessions in data going back to May 2022. Still, the gameplan from JPMorgan’s team shows the stakes are high for investors.

To be sure, gaming on CPI day isn’t straightforward. For one, there are different flavors for the data, and people disagree on which is more important for traders. While the JPMorgan team focused on the headline number, a survey by 22V Research placed emphasis on so-called core inflation, which strips out food and energy.

In 22V’s survey of clients, almost two-thirds of the respondents expect core CPI to be lower than the 5% forecast by economists in a Bloomberg survey. About 54% of them consider the event as risk-on.

The S&P 500 has moved an average 1.6% on CPI days in the past year. This time, the implied move from the options market is around 0.7%, according to Danny Kirsch, head of options at Piper Sandler & Co.

Japan’s wholesale inflation slows for 6th straight month

Japan’s wholesale inflation slows for 6th straight month

TOKYO : Japan’s wholesale inflation slowed for a sixth straight month in June due to sliding fuel and commodity prices, data showed on Wednesday, a sign the cost-push pressure that drove up consumer prices is steadily easing.

The data underscores the central bank’s view that consumer inflation will slow in coming months as global commodity prices slide from last year’s peak levels.

“Sectors like beverage and food makers continue to pass on higher raw material costs. But the pace appears to be moderating,” Masato Higashi, head of the Bank of Japan’s price statistics division, told a briefing.

The corporate goods price index (CGPI), which measures the price companies charge each other for their goods and services, rose 4.1 per cent in June from a year earlier, data showed, slower than a median market forecast for a 4.3 per cent increase.

The rise, which followed a 5.2 per cent gain in May, was the slowest annual pace since April 2021, data by the BOJ showed.

The main factor behind the slowdown was utility and gas bills which rose 5.3 per cent in June from a year earlier, much smaller than a 12.8 per cent gain in May. Food and beverage prices increased 7.4 per cent in June, smaller than a 8.0 per cent gain in May, the data showed.

The yen-based import prices fell 11.3 per cent in June from a year earlier, the biggest annual drop since July 2020, offering some relief for retailers heavily reliant on raw material imports.

The BOJ has stressed its resolve to maintain ultra-loose monetary policy until the recent cost-driven rise in inflation shifts to price gains driven by robust domestic demand, and accompanied by higher wages.

The RBNZ hold rates, AUD/USD breaks out ahead of US CPI

The RBNZ hold rates, AUD/USD breaks out ahead of US CPI

The RBNZ held rates as expected. But with RBNZ being one of the more feisty central banks, you feel a bit cheated when they do what the consensus expects. The RBNZ have always had a reputation of ‘going all in’ when action was concerned, and this this tightening cycle was no exception. Their twelve consecutive hikes added 525bp to their base rate, seven of which were 50bp and a single 75bp hike along the way.

The statement and minutes retained their dovish undertone overall, but they can’t not warn that inflation is still ‘too high’ as they need to contain inflation expectations. But with an economy now in recession, it’s a relatively safe bet that we’ve seen the terminal rate. And that means the next theme for investors to obsess over is when the RBNZ will begin cutting rates, which requires monitoring inflation levels and relative hawkishness of other central banks. Which means we can forget about interest rate cuts any time soon.

What does the RBNZ pause mean for the RBA and AUD/NZD?

That RBNZ’s fight against inflation was seen as a bit of a test balloon for other central banks. And many were likely concerned when inflation in New Zealand continued to rip higher despite the RBNZ’s valiant attempts to contain inflation much sooner than other central banks. So the fact that they have paused along with a relatively dovish statement provides hopes for the others.

Yet in the case of the RBA, I am less convinced. With a cash rate of 4.1% and potential for another couple of hikes, the 1.4% differential of NZ rate could diminish by 50bp over the coming months, and that could help support AUD/NZD.

The daily chart for AUD/NZD has pulled back to the 61.8% Fibonacci ratio in three waves, and a bullish engulfing candle formed yesterday ahead of today’s rally towards the 200-day EMA and MA. It was unlikely to simply break above such a key resistance level immediately, so we now see any pullback towards the 1.0733 lows as a potential for bulls to seek a discount and eventual rally towards 1.09000 or 1.0950. A break beneath 1.07330 invalidates the near-term bullish bias.

20230712audnzdCI

 AUD/USD daily chart:

AUD/USD has not been the easiest markets to trade on the daily timeframe over the past few weeks, despite building a base with a double bottom at 66c. Yet AUD/USD managed to break above last week’s highs and the 200-day MA, likely thanks to strong loan-growth data from China and bets of a softer US inflation print.

Yet the 200-day EMA is capping as resistance, but perhaps that can provide a pullback towards the 200-day MA and another opportunity for bulls to reload ahead of US CPI (assuming the bet is for US inflation to come in softer than expected). But if it can clear the 200-day EMA around 0.6750, it opens up a run for 0.6800, whereas a break beneath 0.6660 brings 0.6600 back into focus.

20230712audusdCI

US Dollar Falls to Lowest in Three Months Ahead of Inflation Data

US Dollar Falls to Lowest in Three Months Ahead of Inflation Data

A gauge of the dollar’s strength fell to a three-month low before a US inflation report which may reinforce bets that the Federal Reserve is nearing the end of its tightening campaign.

The Bloomberg Dollar Spot Index fell as much as 0.3% to the weakest since April 14 on Wednesday. Economists expect the June figures to show consumer-price growth decelerated on an annual basis, with the headline print likely to have fallen to the lowest since March 2021.

“Expectations of the Fed reaching the end of its rate-hiking cycle and further cooling of US CPI will likely reinforce bearish dollar bets,” said Ken Cheung, strategist at Mizuho Bank Ltd. in Hong Kong. “Traders may also be trimming their long dollar positions in carry trades.”

Bullish dollar bets are losing appeal among traders as signs mount that US interest rates may be approaching a peak. The Bloomberg Dollar Spot Index has tumbled more than 10% from its September peak and hedge funds turned negative on the currency for the first time since March.

The greenback’s losses this week coincided with a resurgence in other Group-of-10 currencies. The yen, which has the second-largest weighting in the Bloomberg gauge after the euro, strengthened beyond the key 140 per dollar level in Asia trading Wednesday as traders positioned for this month’s Bank of Japan policy meeting.

In addition, the pound is rising toward the 1.30 mark, which it last reached more than a year ago, as traders price in more Bank of England rate hikes.

“The dollar is firmly on the backfoot,” said Khoon Goh, head of Asia research at Australia & New Zealand Banking Group Ltd. in Singapore. The Dollar Index is likely to lurch lower, and “a weaker-than-expected US CPI tonight could certainly deliver the catalyst for this move.”

US dollar set for pullback against the yen

US dollar set for pullback against the yen

Thought of the day

The US dollar has retreated recently against the yen, down from a peak of above 144 at the start of the month to 140.6 at the time of writing. Even after this pullback, however, the US dollar has still gained close to 10% versus the yen since the start of the year. The dollar’s 2023 rally largely reflects the divergence between a hawkish Federal Reserve and a dovish Bank of Japan (BoJ).

But we believe the latest bout of dollar weakness is a sign of things to come, and we see the USDJPY pairing falling to around 124 by next June.

Japan’s finance ministry has shown a strong discomfort with USDJPY approaching the 145 level. This was the level at which the Japanese authorities intervened to support the yen in September last year, with officials stressing that the yen weakness was excessive and one-sided. While it took a further bout of yen buying at 150 in October, this did succeed in bolstering the yen.

The yen’s rally last year illustrates that corrections can be rapid. USDJPY fell by as much as 16% in less than three months, from around 152 in late October 2022 to around 127 in mid-January 2023. Two key catalysts for the rapid fall were a significant easing in US core CPI data on 10 November (from 0.6% m/m to 0.3% m/m) and an unexpected adjustment in the BoJ’s yield-curve control policy on 20 December. These events prompted a rapid liquidation of elevated net short yen positions, which resulted in a large rebound for the currency.

The same set of conditions that caused the yen to appreciate in late 2022 are in place again, in our view. Even though we cannot rule out near-term spikes in the pairing above 145 so long as the Fed remains hawkish and the BoJ stays dovish, we believe any further dollar strength would be short-lived. As in late 2022, we expect a moderation in US economic data and an adjustment in the BoJ’s yield-curve control policy. We also see stretched net short yen positioning in the market—which could accelerate any move higher in the Japanese currency.

So, we believe investors should be cautious about chasing any spikes in the dollar-yen from here, and we advise US-dollar-based investors to retain any long-yen positions. This fits with our broader expectation for a period of US dollar weakness, as interest rate differentials between the US dollar and other currencies narrow. We therefore recommend investors with the Japanese yen, euro, British pound, or Swiss franc as their home currency to strengthen their home bias. We also expect gold to be a beneificary, with a potential rally to USD 2,250/oz by June of next year.

This website uses cookies to make sure you get the best experience on our website. You can find more information under the Privacy Statement. You are free to change your cookies’ settings in the privacy settings.

Crude Oil Prices May Extend Gains as Retail Traders Turn More Bearish

Crude Oil Prices May Extend Gains as Retail Traders Turn More Bearish

WTI crude oil prices rallied 2.2 percent on Tuesday, extending gains since the end of last week. The past 24 hours also marked the highest close since early May. The commodity is up about 6.2% in July so far. If gains are maintained throughout this month, it would confirm the strongest 4-week period since October, which was when WTI gained 8.4%.

The latest push higher brought the commodity to the edge of the 74.68 – 76.28 inflection zone – see chart below. As such, a rejection at resistance could send prices back lower towards the near-term rising trendline from June 28th. Confirming a breakout under the latter exposes support at 66.86 before the critical 63.60 – 65.72 zone kicks in.

Otherwise, climbing higher into the inflection zone and surpassing upper resistance at 76.28 exposes the long-term 200-day Simple Moving Average (SMA). This could hold as key resistance, maintaining the broader downside focus. Otherwise, extending gains would open the door to revisiting the 81.44 – 83.48 resistance zone that was reinforced in April.

Crude Oil Daily Chart

Crude Oil Daily Chart

Crude Oil Sentiment Outlook – Bullish

The IG Client Sentiment (IGCS) gauge shows that about 59% of retail traders are net-long crude oil. IGCS typically tends to function as a contrarian indicator. Since most traders are still biased to the upside, this suggests that prices may fall down the road. Recently, downside exposure has increased by 14.56% and 54.41% compared to yesterday and last week, respectively. With that in mind, these changes hint that the price trend may soon reverse higher despite overall positioning.

Crude Oil Sentiment Outlook - Bullish