New Zealand Dollar Dipped Initially then Recovered After the RBNZ Left its Cash Rate Alone

New Zealand Dollar Dipped Initially then Recovered After the RBNZ Left its Cash Rate Alone

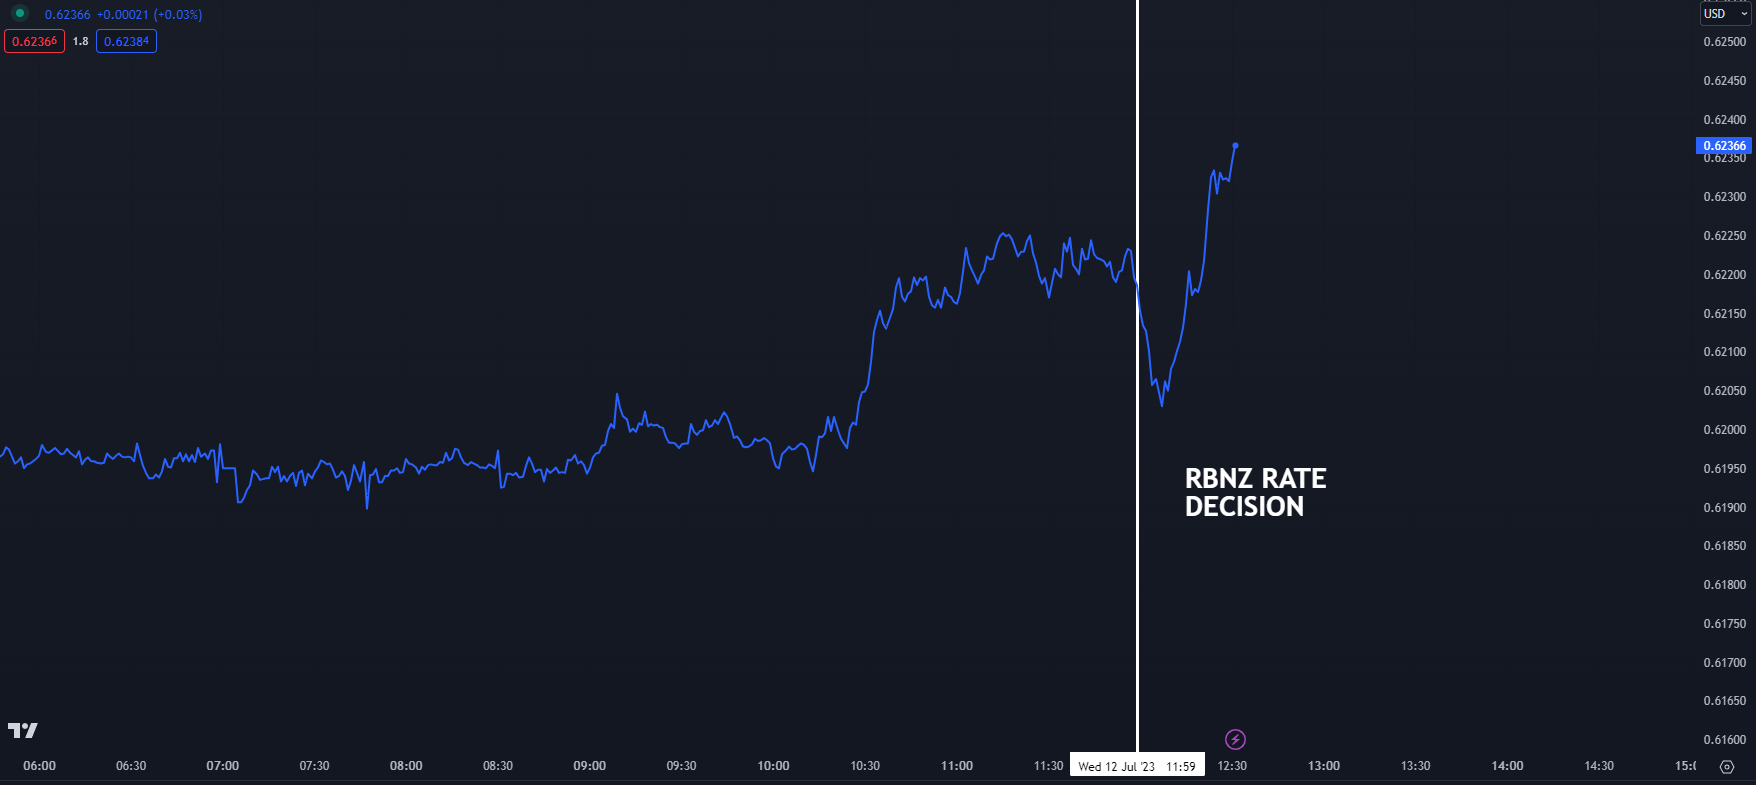
The New Zealand Dollar slid lower after the Reserve Bank of New Zealand (RBNZ) left rates unchanged at 5.50% at its monetary policy committee meeting (MPC) today. It has since rebounded on the prospect of less severe domestic economic conditions going forward.

The RBNZ had previously raised the overnight cash rate (OCR) 12 times since the first lift in October 2021. New Zealand’s S&P/NZX 50 equity index consolidated higher on the news following losses seen at the open.

The Kiwi Dollar had gained some ground going into today’s decision with the US Dollar sliding across the board to start the Asian session.

The initial weakness in the aftermath of the OCR decision was most notable against the Japanese Yen and Australian Dollar.

AUDJPY traded under 86.50 after nudging 89.70 at this time last week. It has recovered back over 87.00.

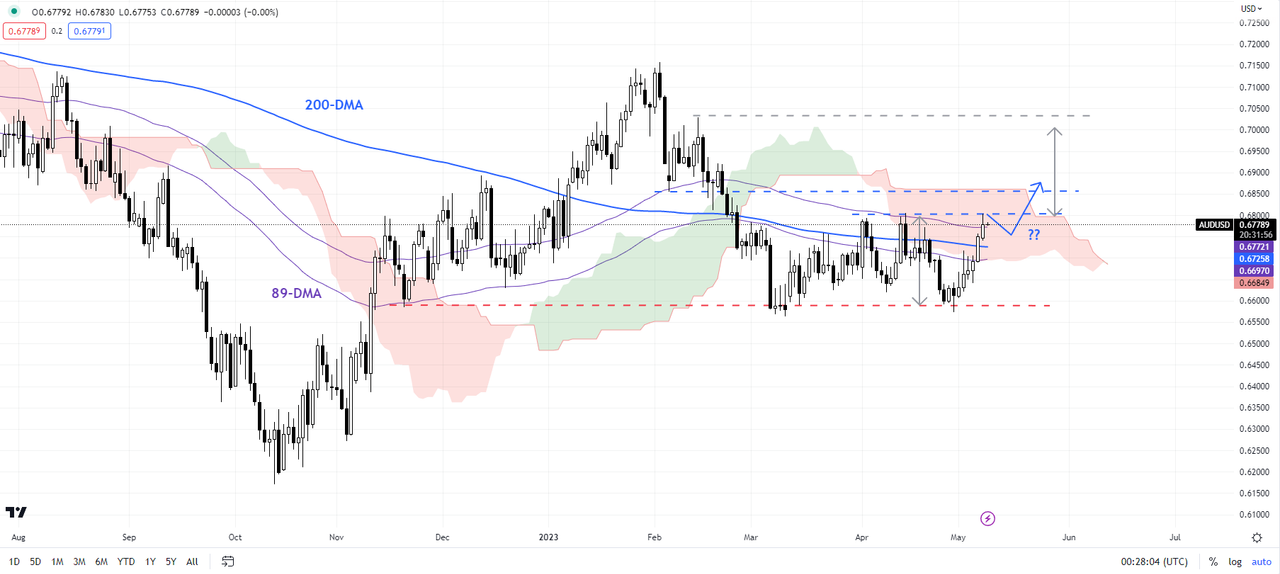
AUDNZD has rallied a big figure to reach above 1.0830 and is eyeing off the 200-day Simple Moving Average (SMA) that is currently at 1.0834. A convincing break above it might see bullish momentum evolve. Live prices can be found here.

NZ CPI in the first quarter was below expectations at 6.7% and the second quarter reading will be released next Wednesday. The RBNZ have an inflation target of 1 – 3%.

Today’s pause in the hiking cycle may reflect the market perception of many Western central banks whereby once policy settings are seen as tight enough, an extended period of ‘wait and see’ could be in store.

The neighbouring Reserve Bank of Australia refrained from tightening at its meeting last week as did the Federal Reserve at their June Federal Open Market Committee (FOMC) meeting.

The New Zealand interest rate market have moved toward little chance of another rate rise from the RBNZ for the next year and beyond.

NZD/USD REACTION TO RBNZ RATE PAUSE

image1.png


All eyes on US CPI ahead, with mixed session in Asia: DJIA, USD/JPY, NZD/USD

All eyes on US CPI ahead, with mixed session in Asia: DJIA, USD/JPY, NZD/USD

The usual cautious lead-up to the US consumer price index (CPI) release has failed to deter risk appetite in Wall Street overnight, as major US indices pushed higher on strength in value sectors (energy, industrials, financials). The market confidence could arise as broad expectations are positioned for the upcoming US CPI to reflect further moderation in pricing pressures, with the headline figure expected to decline to 3.1% year-on-year from previous 4%. Likewise, the core aspect is expected to decline to 5.0% year-over-year from 5.3% in May. Month-on-month, both the headline and core inflation prints are expected to increase by 0.3%.

Another dip in the US core CPI read may reinforce some degree of success in Fed’s tightening moves thus far and leaves room for the Fed to consider a prolonged rate pause for more policy flexibility. Any upside surprise in inflation may put chatters of more rate hikes on the table but given that a 25 basis-point (bp) hike is already heavily priced for the upcoming Fed meeting (88% probability from US Fed funds futures) and the broader trend for inflation is still to the downside, it may potentially have to take a significant beat in inflation numbers to drive a pronounced recalibration in rate pricing.

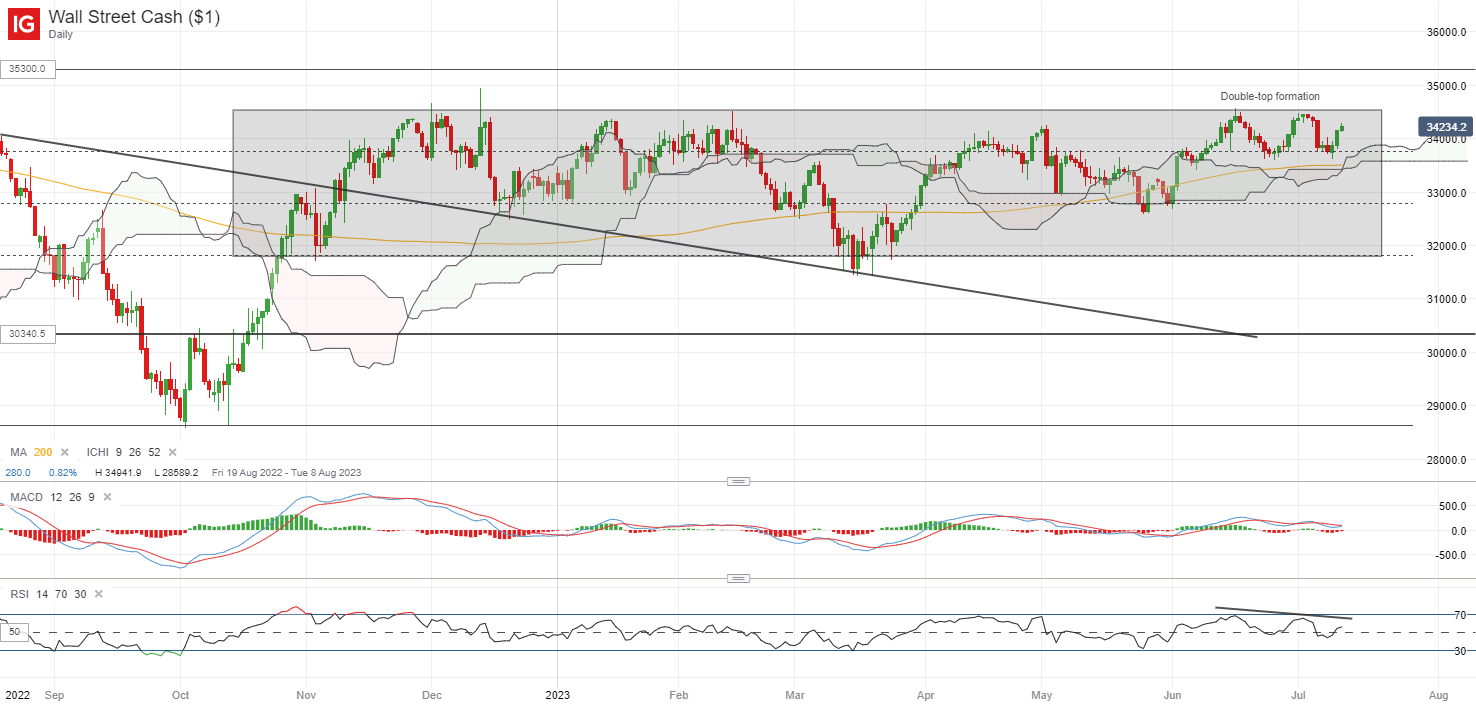
The DJIA has largely traded in a wide consolidation pattern since November last year, with a retest of the upper consolidation range marked with the formation of a double-top pattern. Bearish divergences on Relative Strength Index (RSI) and moving average convergence divergence (MACD) seem to point to moderating upward momentum on recent peaks but nevertheless, buyers have managed to defend the double-top neckline overnight at the 33,600 level. Another retest of the upper range may be on watch at the 34,500 level, with any successful upward break potentially leaving the 35,300 level in sight.

image1.png

Asian stocks are in a mixed session, with Nikkei -0.77%, ASX +0.32% and KOSPI +0.18% at the time of writing. Chinese equities have managed to see some gains yesterday, with the small step from China authorities in extending stimulus support for the property sector providing hopes for more to come over the coming months. The Nasdaq Golden Dragon China Index is up 1.6% overnight after an initial dip. That said, past instances suggest that signs of policy success in lifting economic conditions may still be needed to drive more sustained gains. China’s economic surprise index has turned in a new two-year low recently, with the worst-is-over conditions still on the lookout among investors.

The economic calendar this morning saw a downside surprise in Japan’s producer prices (4.1% versus 4.3% forecast), with its sixth consecutive month of decline seemingly pointing towards some easing upward pressure on consumer prices. With views of a quicker policy shift by the Bank of Japan (BoJ) on the surge in Japanese workers’ wages lately, today’s wholesale inflation data may slightly dampen some hawkish expectations.

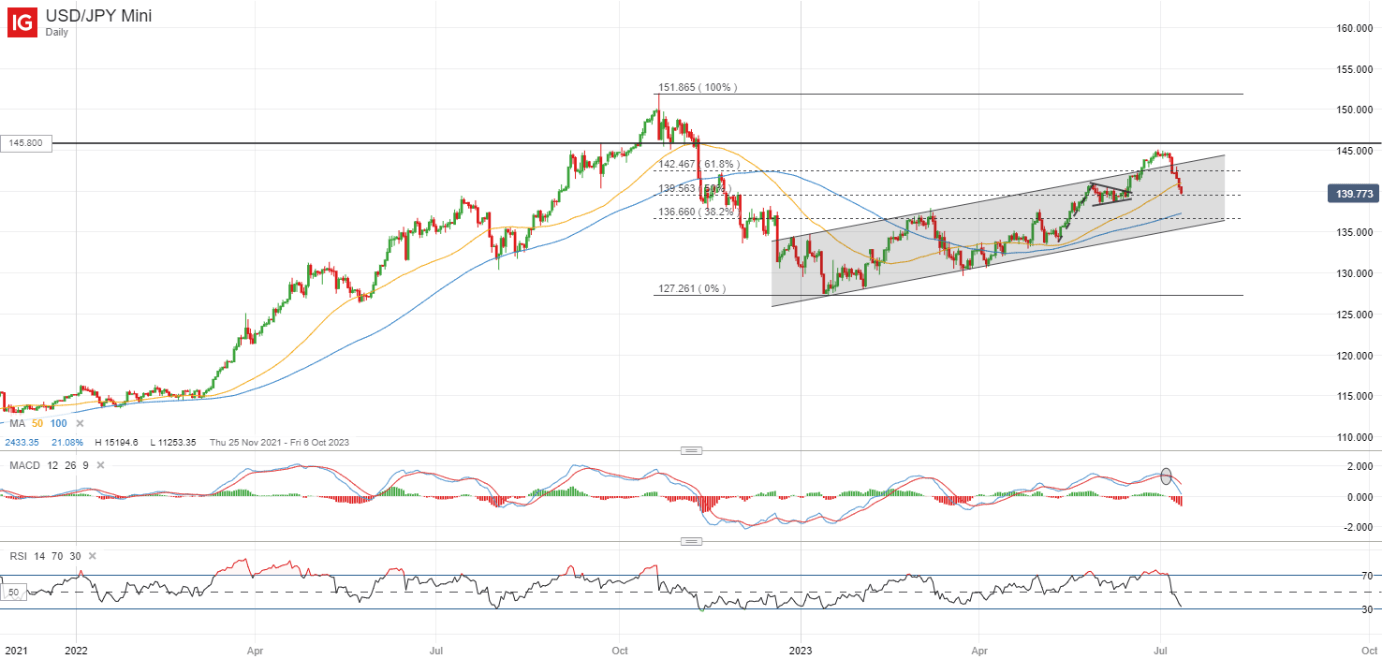
A brief breakout for the USD/JPY above its ascending channel pattern has failed to find much follow-through, as interaction at the 145.00 level was faced with strong resistance. The level marked a previous area of intervention by Japanese authorities, which prompted some retreat from buyers. The pair is currently back to retest its 139.60 level of support, with any failure for the level to hold potentially paving the way towards the 136.60 level, where the lower channel trendline resides.

image2.png

On the watchlist: NZD/USD stuck below resistance confluence

The Reserve Bank of New Zealand (RBNZ) has kept interest rates on hold in today’s meeting as widely expected, considering that 525 bp worth of tightening thus far has forced its economy into a technical recession. While the committee acknowledged that monetary conditions are restricting spending and reducing inflationary pressures, current inflation levels are still too high for comfort, with some lingering bets for an additional hike down the road.

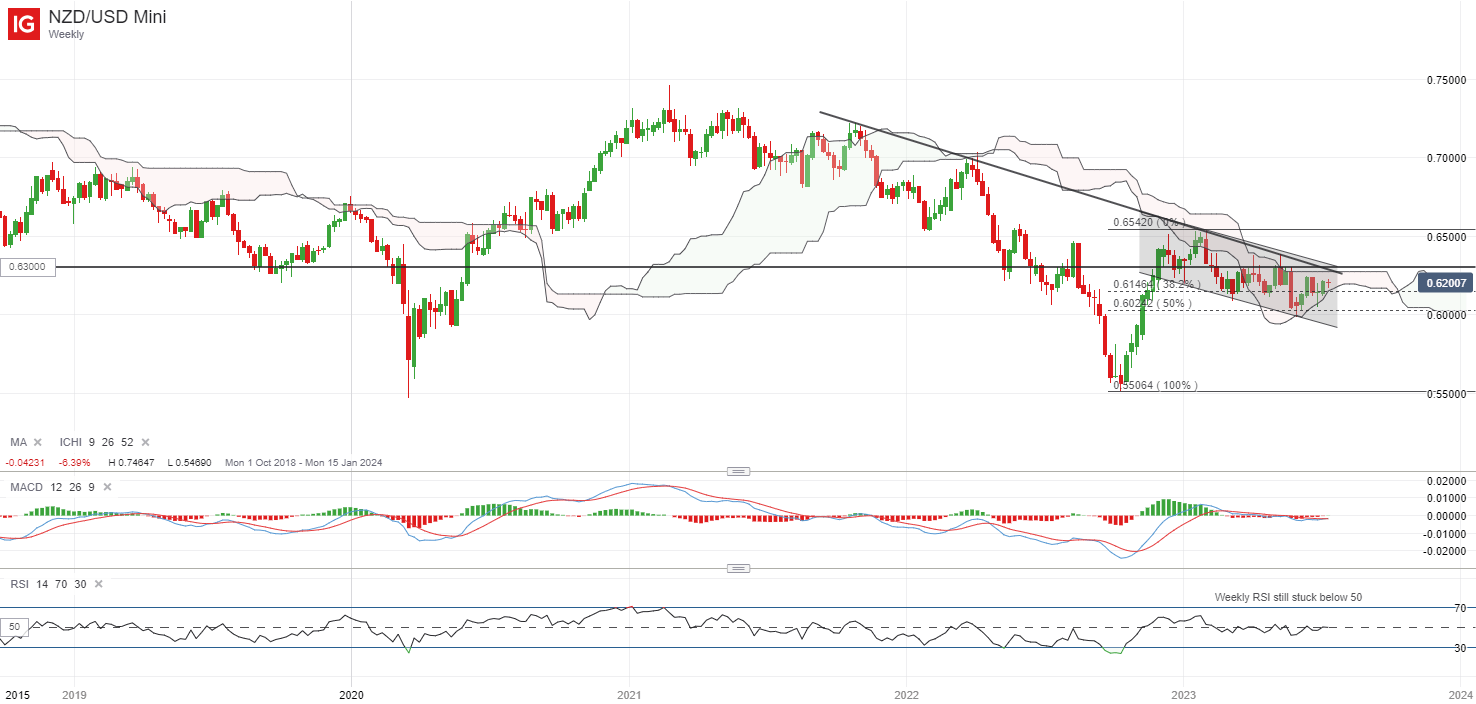
On the weekly chart, the NZD/USD has been trading within a descending channel pattern since the start of the year, with a key resistance confluence at the 0.630 level. This is where the upper channel trendline resistance coincides with the upper edge of the weekly Ichimoku cloud, while its weekly RSI still struggles to overcome its 50 level for now. A reclaim of the 0.630 level may be needed to pave the way to retest its year-to-date high at the 0.654 level next. On the downside, the channel support will place the 0.591 level on watch, if the pair resumes its prevailing downward trend.

image3.png


US Dollar Slips While Japanese Yen Rallies Ahead of US CPI. New Lows for USD?

US Dollar Slips While Japanese Yen Rallies Ahead of US CPI. New Lows for USD?

The US Dollar struggled to find traction going into the Wednesday session despite Treasury yields stabilising after sliding in the prior sessions. The largest losses were seen against the Japanese Yen and the Australian Dollar.

After eclipsing 145 last week, USD/JPY has crashed below 140 today as the timeline of a possible tilt from the Bank of Japan is being re-assessed by the market. They will meet to decide on monetary policy on July 28th.

At the same time, there is a degree of nervousness ahead of crucial US CPI data, potentially undermining USD.

A Bloomberg survey of economists is anticipating that the year-on-year headline inflation gauge will continue to ease and print at 3.1% later today. Well below the 4% prior reading.

The benchmark 10-year Treasury note is yielding close to 3.95% after almost touching 4.10% at the start of the week.

US CPI will be a critical piece of the monetary policy for the Fed at its Federal Open Market Committee (FOMC) meeting on July 26th.

In the Asian session, the Reserve Bank of New Zealand (RBNZ) left its overnight cash rate (OCR) unchanged at 5.50% at their monetary policy committee (MPC) today.

NZD/USD initially dipped but recovered soon after as the interest rate market moved toward a less restrictive policy further out on the curve to potentially improve the domestic economic outlook.

AUD/USD was also supported by comments from Reserve Bank of Australia (RBA) Governor Philip Lowe that were viewed as less hawkish than the language in last week’s statement on monetary policy.

Crude oil has made a 2-month high with the WTI futures contract trading as high as US$ 75.14 bbl while the Brent contract touched US$ 79.75 bbl. Gold also gained on the weaker US Dollar, overcoming US$ 1,940 today

APAC equities had a mixed day with all the main Japanese indices sinking with a stronger Yen while Hong Kong’s Hang Seng Index (HSI) saw some decent gains.

Yesterday’s pro-growth commentary from President Xi Jinping might have assisted the outlook for the world’s second-largest economy.

While US CPI is likely to be the main focus for the market today, Bank of England (BoE) Governor Andrew Bailey will also be speaking and may provide some volatility.

The full economic calendar can be viewed here.

DXY (USD) INDEX TECHNICAL ANALYSIS

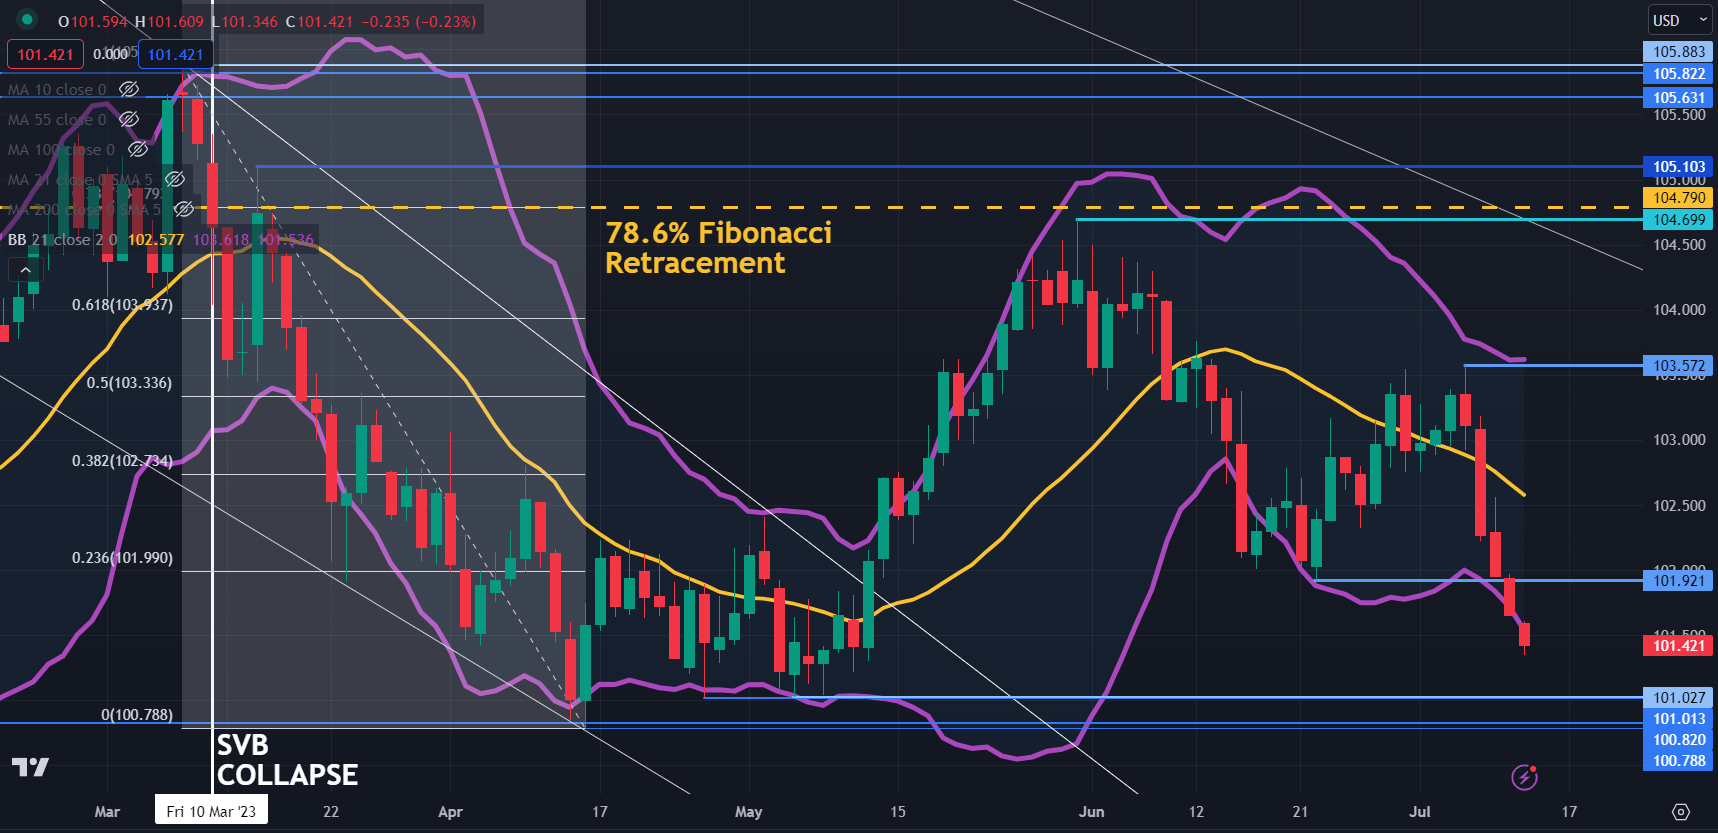
The DXY (USD) index made a 2-month low today and it might test potential support in the 100.80 – 101.00 area where there are a series of prior lows.

The recent sell-off broke below the lower band of the 21-day simple moving average (SMA) based Bollinger Band. A close back inside the band might signal a pause in the bearish run or a potential reversal.

On the topside, resistance could be offered at the breakpoint of 101.92, ahead of the recent peak of 103.57.

image1.png


Australian Dollar Fundamental Bias Breakdown: What Matters the Most for AUD/USD?

Australian Dollar Fundamental Bias Breakdown: What Matters the Most for AUD/USD?

Like other exchange rates, AUD/USD can be influenced by the difference in relative monetary policy, which in this case is between the RBA and the Fed. But that alone is one of the many ingredients that drive the direction of the Aussie. Financial markets are constantly adapting to changing economic environments. That also means the importance of what impacts the Australian Dollar changes over time.

For example, another ingredient that influences AUD/USD is financial market sentiment. That is because Australia finds itself sitting at the front end of the global supply chain, or in other words, the world business cycle. That is why you will often see the exchange rate being influenced by stock markets, especially those related to Emerging Markets.

China is Australia’s largest trading partner, and the latter heavily exports commodities to the former. That also means that understanding the dynamics of commodity prices is another factor that determines Australian Dollar direction. This means three vital ingredients are impacting the exchange rate: relative monetary policy, market sentiment and commodity prices.

With that in mind, this is a special report that focuses on trying to understand how the influence of these variables on the Australian Dollar changed from 2006 up until the middle of 2023. The purpose of the study will be to demonstrate why it is important to adapt fundamental analysis to constantly changing environments. With that in mind, let us cover how this was performed.

How the Study Was Conducted

Rolling regression modeling over a 36-month window in steps was used on the following variables (all of which were expressed in month-over-month form): AUD/USD, the spread between Australian and United States 2-year government bond yields, the MSCI Emerging Markets Index (EEM) and the Bloomberg Commodities Index (BCOM). Doing this created explanatory coefficients that changed in influence over time. It should also be noted that to gauge underlying relationships, a few data outliers were removed. If you are interested, a full analysis of how this was performed was outlined in a Twitter thread.

How Has RBA & Fed Policy Divergence Been Influencing AUD/USD?

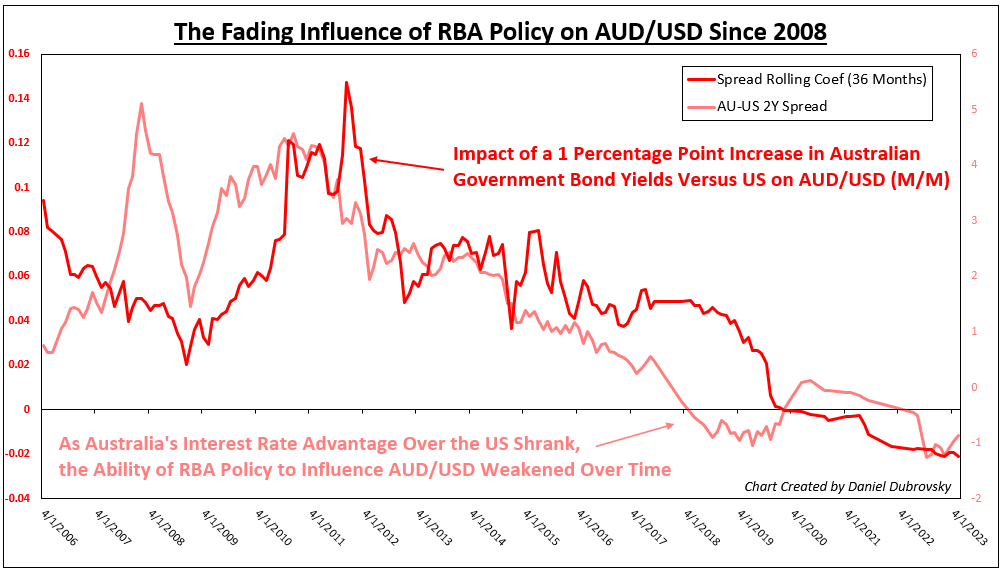
We will start with the importance of relative monetary policy. The dark red line on the chart below is the rolling bond yield spread coefficient and how it changed over time. When this line is rising above 0, that means a 1 percentage point improvement in 2-year bond yield returns in Australia relative to the United States produced an increasingly more positive reaction from AUD/USD (m/m), controlling for EEM and BCOM.

In other words, increasingly higher interest rates in Australia relative to the United States typically means stronger Aussie appreciation. What you may notice is that the dark red line has been falling steadily since 2011 and turned slightly negative around the time of 2020. When the dark red line is at 0, that means there is practically no relationship between AU-US bond yield spreads and AUD/USD.

So, what happened to this relationship? The yield advantage that Australia once had relative to the United States slowly evaporated after the 2008 Financial Crisis (light red line), turning negative heading into Covid and remaining mostly thereafter. In other words, interest rates in the US became higher than in Australia. As this happened, the ability of RBA monetary policy to influence AUD/USD (through setting interest rates) weakened significantly and remained so in the few years after Covid.
How Has RBA & Fed Policy Divergence Been Influencing AUD/USD?

How Has Emerging Market Sentiment Been Impacting AUD/USD?

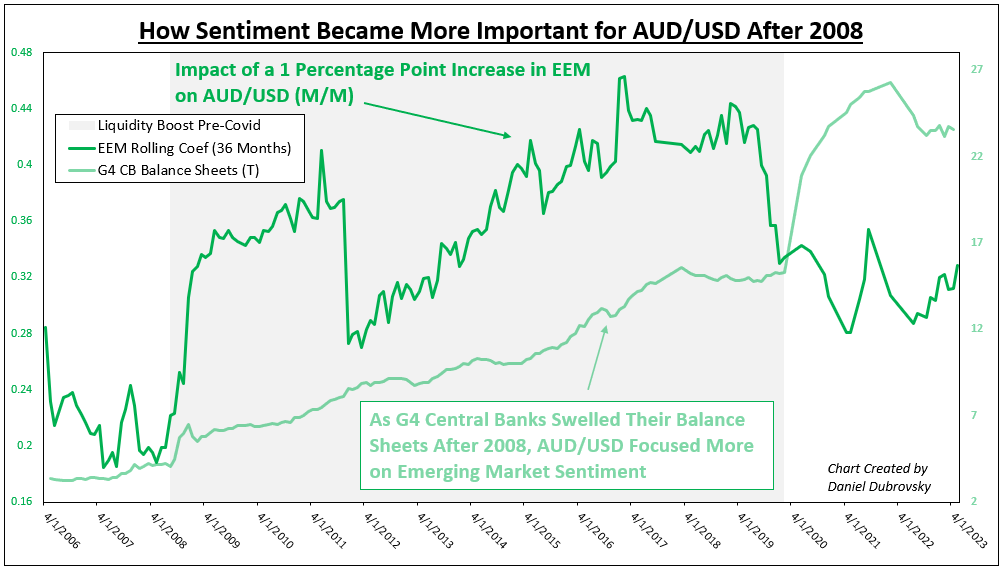
While RBA policy became an increasingly poorer predictor of AUD/USD, Emerging Market sentiment became more important. The dark green line on the chart below is the rolling EEM coefficient. When this line is rising above 0, a 1 percentage point boost in monthly Emerging Market performance shows increasingly better returns in AUD/USD (m/m), controlling for bond yield spreads and BCOM.

I have overlaid this with G4 central bank balance sheet assets. What you can see is that as major central banks injected liquidity into the financial system after the 2008 recession, sentiment became an increasingly better predictor of the Aussie exchange rate. But, you might notice that the dark green line peaked just before Covid and stayed lower thereafter despite the surge in asset holdings.

That would speak to less influence from market sentiment driving AUD/USD in the post-Covid era (although the relationship remained positive). Let us take a closer look at why this happened.
How Has Emerging Market Sentiment Been Impacting AUD/USD?

What About Commodity Prices?

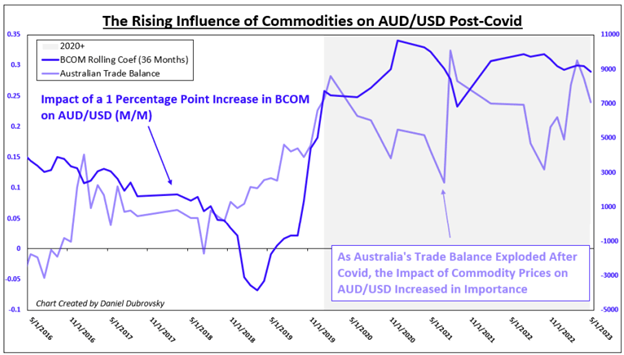
The dark blue line on the chart below is the rolling BCOM coefficient, zoomed in on just 2016+. When this line is rising increasingly above 0, a 1 percentage point boost in the BCOM Index tends to elicit a stronger positive effect on AUD/USD (m/m), controlling for bond yield spreads and EEM. What is very interesting is that the dark blue line surged higher heading into Covid and remained elevated thereafter.

This is as Australia’s trade balance exploded during Covid, meaning the value of the nation’s exports became significantly larger than its imports. In other words, as commodity prices surged, benefiting Australia, AUD/USD paid more attention to the BCOM Index and less so to EEM and AU-US bond yield spreads.
What About Commodity Prices?

A Closer Look at Post-Covid

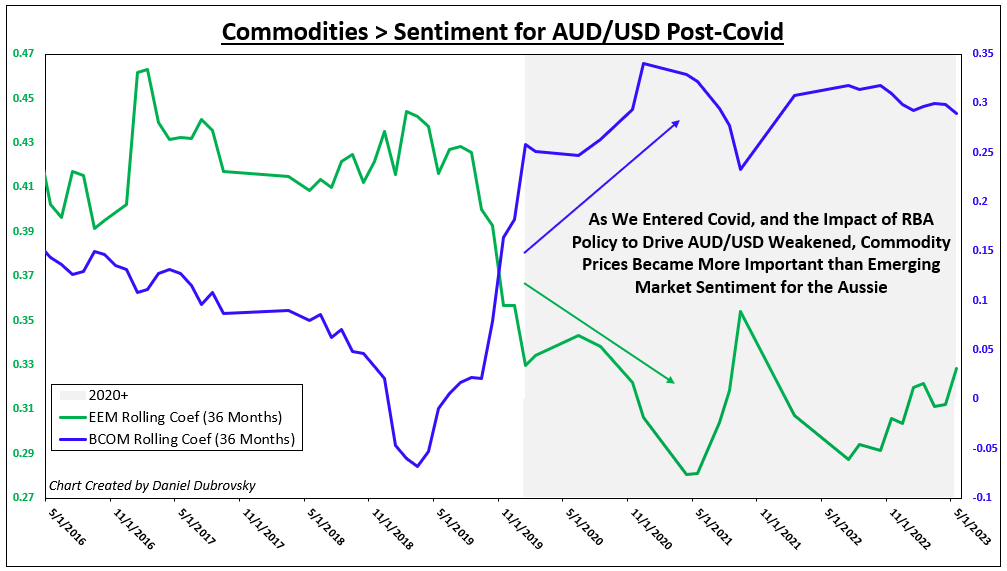
The last chart below plots the EEM and BCOM coefficients zoomed in on 2016+. The reason this was performed is to visualize the evolution of AUD/USD underlying fundamental dynamics during Covid. Specifically, you can see how entering the pandemic, commodities became a more important factor than Emerging Market sentiment for driving the Aussie exchange rate. This was likely due to the significance of how global trading and surging prices impacted Australia’s economy, and thus the exchange rate.
A Closer Look at Post-Covid

Conclusion and Study Limitations

While it is generally correct that monetary policy is a key driver of exchange rates, the truth is each currency behaves differently because of the unique traits of various economies. For the Australian Dollar, sentiment and commodity prices are other key factors that are involved in this equation.

On top of this, fundamental conditions change, and the influence of certain variables is no different. What this study has demonstrated is that for the Australian Dollar, RBA policy direction became an increasingly poorer predictor of the exchange rate in the aftermath of the 2008 financial crisis.

Instead, factors like market sentiment and commodity prices become better predictors of the exchange rate as underlying fundamental conditions evolved heading into Covid. Perhaps this could reverse course in the future, such as in a scenario where interest rates in Australia begin far outpacing those in the US.

It should be noted that this kind of modeling with rolling regressions creates many outputs, 180 to be exact in this sample. That is 180 different regressions that could each have their quirks or issues, such as creating a coefficient that is not statistically significant.

This was not considered. Instead, a general comprehensive regression of the entire dataset was thoroughly analyzed for potential issues. This included testing for correlation between control variables, residual normality, residual autocorrelation and heteroskedasticity. No major faults were identified.

 

USD/CAD recovers modest intraday losses, upside potential seems limited

USD/CAD recovers modest intraday losses, upside potential seems limited

The USD/CAD pair comes under some renewed selling pressure on Tuesday and drops to a four-day low, around the 1.3245 region during the early European session. Spot prices, however, manage to recover a major part of the intraday losses and currently trade near the 1.3275-1.3280 region, nearly unchanged for the day.

Any meaningful upside for the USD/CAD pair, however, seems elusive in the wake of sustained US Dollar (USD) selling bias and the emergence of some buying around Crude Oil prices, which tends to underpin the commodity-linked Loonie. Speculation that the Federal Reserve (Fed) is nearing the end of its policy tightening cycle led to a further decline in the US Treasury bond yields and drag the USD to a two-month low. Apart from this, signs of stability in the equity markets drag the safe-haven buck to a two-month low.

Crude Oil prices, meanwhile, inch back closer to a multi-week high touched on Monday and remain well supported by supply cuts announced by the world’s biggest oil exporters – Saudi Arabia and Russia – for August. Apart from this, hopes for a recovery in fuel demand during the second half of 2023 lend some support to the black liquid. That said, looming recession risk might keep a lid on any further gains for Oil prices. This, along with bets for a 25 bps Fed rate hike in July, could help limit losses for the USD/CAD pair.

Despite a slight miss from the headline US NFP print, the unexpected dip in the unemployment rate and persistently strong wage growth pointed to still-tight labor market conditions. Moreover, several Fed officials on Monday backed the case for further policy tightening by the US central bank. This, in turn, assists the USD/CAD pair to attract some dip-buying as traders seem reluctant to place aggressive directional bets ahead of the US consumer inflation figures on Wednesday, which will influence the USD demand in the near term.

In the meantime, the USD will take cues from the US bond yields and the broader risk sentiment in the absence of any relevant market-moving economic data. Apart from this, Oil price dynamics should provide some impetus to the USD/CAD pair and allow traders to grab short-term opportunities.

Pound Sterling faces delicate barricades, upside seems favored amid hawkish BoE bets

Pound Sterling faces delicate barricades, upside seems favored amid hawkish BoE bets

The Pound Sterling (GBP) has delivered a north-side vertical move marginally above the round-level resistance of 1.2900 as labor cost data has turned out more resilient than expected. The GBP/USD pair has picked immense strength as chances of a bulky interest rate hike from the Bank of England (BoE) have escalated, knowing the fact, that higher disposable income available to households will result in higher purchasing power, and eventually the overall demand will elevate further.

United Kingdom firms are offering higher wages to attract fresh talent amid labor shortages. Scrutiny of the Employment data indicates that the jobless rate has increased as firms have started avoiding credit due to higher interest rate attachment. It seems that the chances of a fat rate hike by the BoE will remain elevated as higher wage pressures are sufficient to offset the impact of a rise in the Unemployment Rate.

GBP/USD edges higher toward 1.2900 after UK jobs report

GBP/USD edges higher toward 1.2900 after UK jobs report

GBP/USD keeps its footing and trades at its highest level since April 2022 near 1.2900. The data from the UK showed that wage inflation was stronger than expected in May, while the Unemployment Rate rose to 4% from 3.8%.

The Relative Strength Index (RSI) indicator on the four-hour chart stays near 60 early Monday, highlighting a lack of seller interest. On the upside, 1.2850 (multi-month high, static level, mid-point of long-term ascending regression channel) aligns as first resistance ahead of 1.2900 (psychological level) and 1.2930 (upper-limit of the ascending channel).

Below 1.2800 (psychological level), GBP/USD is likely to face next support at 1.2770 (former resistance, static level) and 1.2750/40 (100-period Simple Moving Average (SMA), lower-limit of the ascending channel).

GBP/USD rose sharply on Friday and closed the week in positive territory. The pair stays relatively calm early Monday, while moving sideways in a tight range above 1.2800.

After the June jobs report from the US revealed that Nonfarm Payrolls (NFP) 209,000 to miss the market expectation for an increase of 225,000, the US Dollar (USD) came under heavy selling pressure. Consequently, GBP/USD rose sharply and touched its highest level since April 2022 at 1.2851 ahead of the weekend.

Early Monday, the cautious market stance, as reflected by falling US stock index futures, helps the USD hold its ground and doesn’t allow GBP/USD to build on Friday’s gains.

In the second half of the day, Bank of England (BoE) Governor Andrew Bailey will be delivering a speech. In an interview with BBC on Friday, “I can’t give you a date as to when interest rates start to come down because that really depends upon what happens over the period of time ahead, but getting inflation down is the most important thing that we have to do,” Bailey said. These comments failed to trigger a reaction in Pound Sterling and Bailey is unlikely to offer any fresh insights into the rate outlook.

On Tuesday, the UK’s Office for National Statistics (ONS) will release the labor market data. Investors will pay close attention to the wage inflation reading. On a yearly basis, Average Earnings Excluding Bonus are forecast to rise 7.1% in three months to May. The BoE raised its policy rate by 50 basis points to 5% in June in response to persistent inflation. Hence, a stronger-than-expected wage inflation reading could help Pound Sterling gather strength with the initial reaction, with investors pricing in additional rate hikes later this year.

Japanese Yen Soars, Sending USD/JPY Lower as Treasury Yields Soften Before CPI

Japanese Yen Soars, Sending USD/JPY Lower as Treasury Yields Soften Before CPI

The Japanese Yen outperformed its major counterparts, especially versus the US Dollar. Over the past two days, USD/JPY sank about 1.9 percent during the worst performance since May. Beyond that, the move was quite a rare event. Looking back to data since the beginning of 2000, the 1.9% drop amounted to -2.2 standard deviations from the average.

A closer look at the Yen’s price action over the past 24 hours reveals that the currency’s strength coincided with a weakening in longer-term United States bond yields. The 10-year Treasury yield dropped almost -1.8% in the worst performance since June 20th. This was despite a slew of Fedspeak where policymakers reiterated that the likely scenario ahead is for higher interest rates and perhaps for longer too.

Perhaps traders were positioning themselves for this week’s US inflation report. On Wednesday, headline inflation is seen slowing further from 4.0% y/y in May to 3.1% y/y in June. However, this is largely thanks to disinflation in food and energy prices. The far less volatile core reading is seen ticking lower to 5.0% y/y from 5.3% prior.

This is not good news for the Federal Reserve as it would suggest that underlying inflation is becoming entrenched and stickier to deal with. Perhaps investors are looking to a softer print and perhaps a less hawkish Fed. This would benefit the Japanese Yen because its fundamentals are tied to external factors due to a stagnant Bank of Japan. As such, USD/JPY is quite sensitive to Treasury yields.

Japanese Yen Technical Analysis

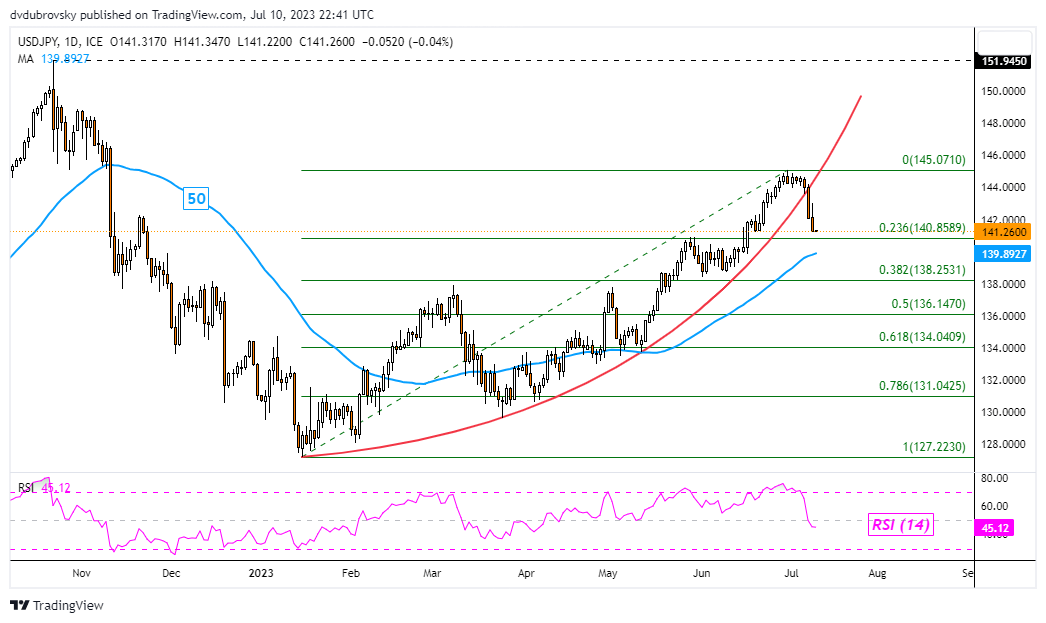
The drop in USD/JPY over the past 2 days saw the exchange rate confirm a bearish breakout from what was an increasingly faster uptrend since the beginning of this year – see chart below. That has exposed immediate support, which is the 23.6% Fibonacci retracement level at 140.85. Beyond that sits the 50-day Simple Moving Average. The latter could hold, maintaining the broader upside focus.

USD/JPY Daily Chart

image1.png

Euro Technical Outlook – Ranges Against Trends. Will EUR/USD Go Higher?

Euro Technical Outlook – Ranges Against Trends. Will EUR/USD Go Higher?

EUR/USD TECHNICAL ANALYSIS

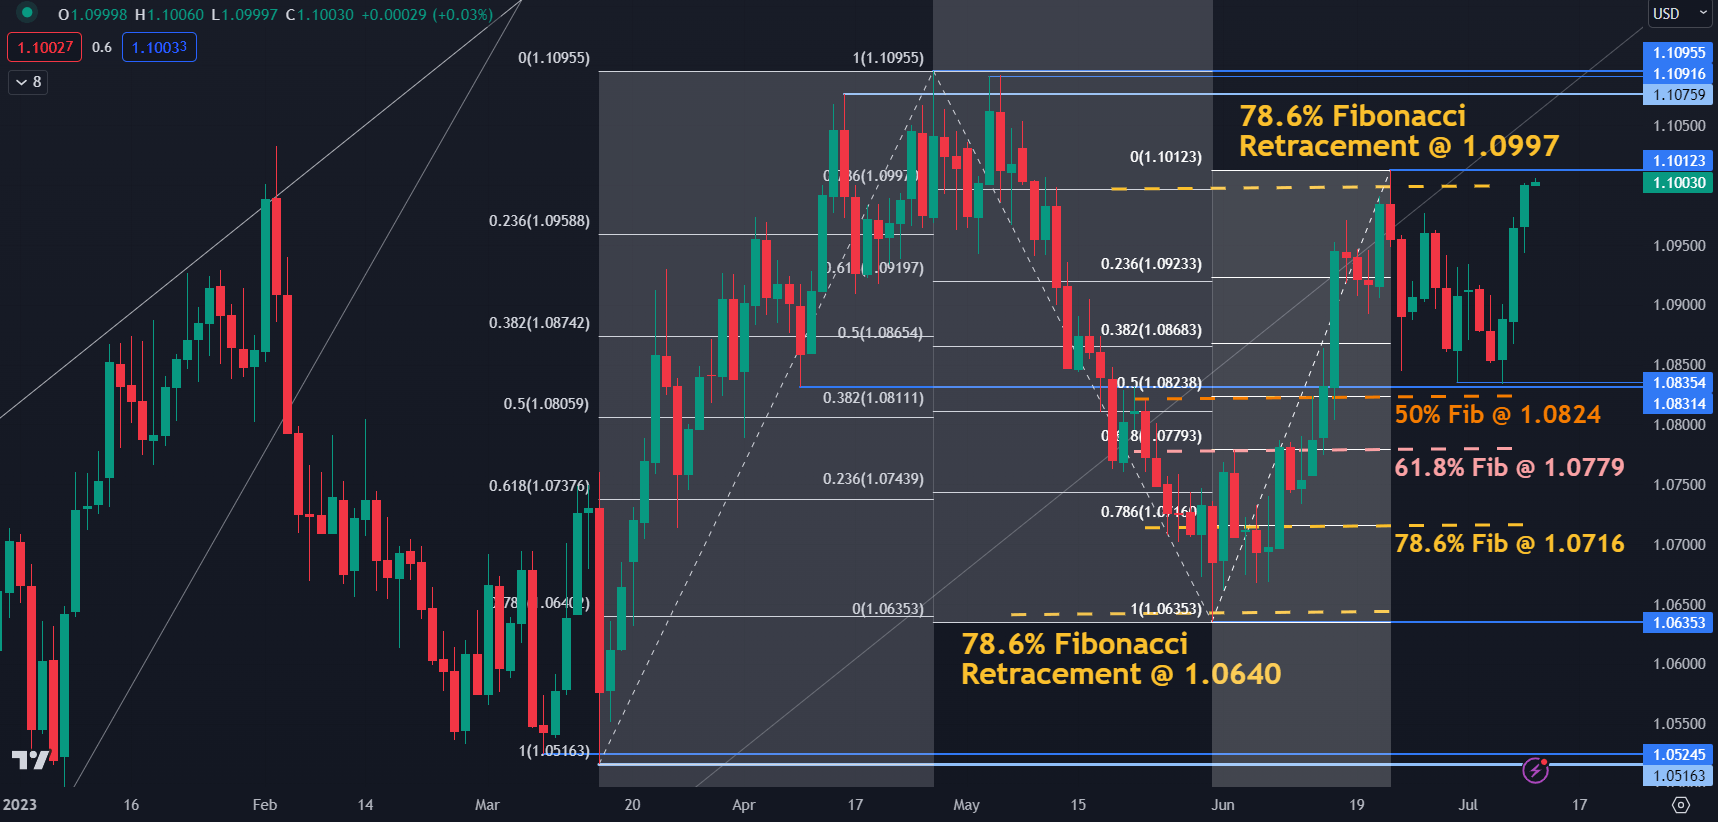
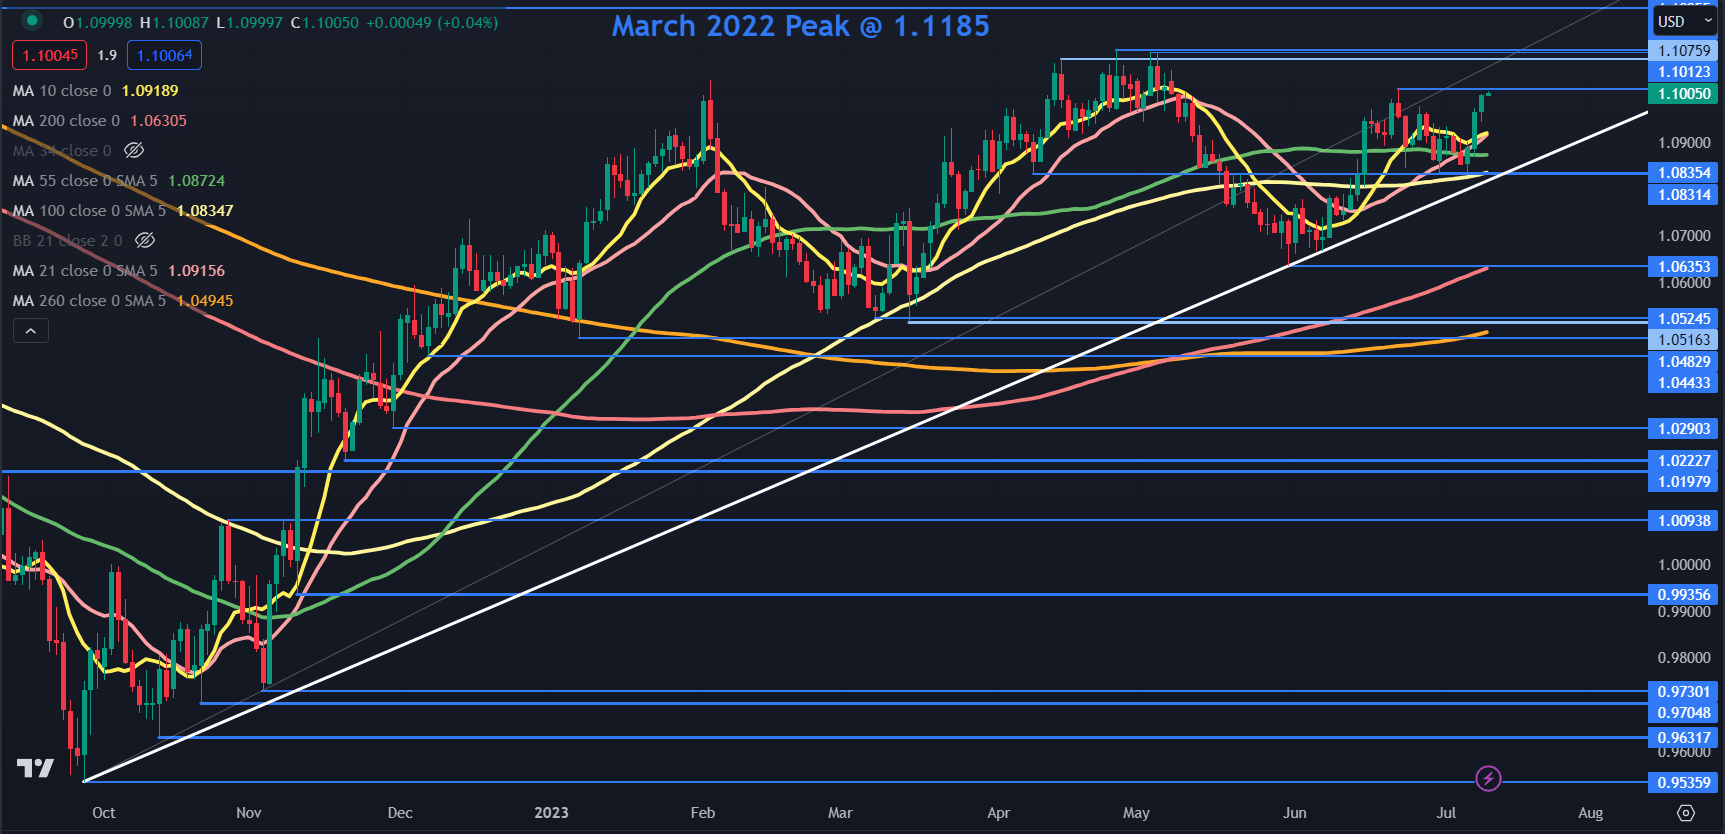
EUR/USD continues to trade in the broad seven-month range of 1.0516 – 1.1096 but it appears that it may challenge the topside after rallying through the last few sessions.

Going into Tuesday, it is testing the 78.6% Fibonacci Retracement of the move from 1.1096 down to 1.0635 at 1.0997. Although it peaked at 1.1012 last month, it was unable to sustain its strength on that occasion.

Those levels may continue to offer resistance ahead of a series of potential resistance levels in the 1.1076 – 1.1096 zone.

On the downside, support could be at the recent low of 1.0844, which is just above the breakpoint of 1.0831.

Further below those levels, there are a series of Fibonacci Retracement levels of the move from 1.0635 up to 1.1012 that might provide support. The 50% Retracement level is at 1.0824, the 61.8% at 1.0779 and the 78.6% is at 1.0716.

The late May low of 1.0635 was only a fraction below the 78.6% Fibonacci Retracement of the move from 1.0516 to 1.1096 at 1.0640. This could make the 1.0635-40 area a possible support zone ahead of the prior lows at 1.0525, 1.0516, 1.0483 and 1.0443.

EUR/USD DAILY CHART OVER THE LAST 6 MONTHS

image1.png

While the chart above highlights the range trading nature for EUR/USD of late, if we zoom out on the timeframe, the currency pair remains above an ascending trendline.

The June high of 1.1096 may offer resistance ahead of the March 2022 peak of 1.1185.

A clean break above these levels might imply that the ascending trend is intact and could see further bullishness evolve.

A bullish triple moving average (TMA) formation requires the price to be above the short-term SMA, the latter to be above the medium-term SMA and the medium-term SMA to be above the long-term SMA. All SMAs also need to have a positive gradient.

The price is currently above the 10-, 21-, 55-, 100-, 200- and 260-day simple moving averages (SMA) and all these SMAs have a positive slope. The criteria for a TMA have been met.

On the downside, a break below the ascending trend line could suggest an end to the bullish trend. Should that occur, the price will also move below a series of SMAs that may reiterate waning bullish momentum.

EUR/USD DAILY CHART OVER THE LAST 9 MONTHS

image2.png


Asia Day Ahead: Positive US Handover Has Brought Some Relief to Asia Session

Asia Day Ahead: Positive US Handover Has Brought Some Relief to Asia Session

Wall Street managed to start the new week on a positive footing, but with some slight caution ahead of the key US CPI data release tomorrow as the S&P 500 VIX saw an in-tandem rise overnight (+1.6%). Nevertheless, the DJIA has pulled ahead with a 0.6% gain versus the Nasdaq’s 0.2% and with chatters of growth sectors doing the heavy-lifting for indices since the start of the year, more participation from value sectors ahead may bode well for the broader market strength. Thus far, the DJIA has yet to reclaim its December 2022 high.

Overnight, a series of Fedspeak largely confirmed market rate expectations of what is to come at the upcoming Fed meeting – a potential 25 basis-point (bp) hike followed by a prolonged rate pause through the rest of the year. The comments from Fed official Michael Barr, Raphael Bostic and Loretta Mester called for further rate increases but also indicated that the end of the Fed’s tightening cycle is in sight. The no-surprise saw Treasury yields reacted to the downside, with a retreat in the ten-year yields from its March 2023 high while the two-year yields also declined 9 bp, overall weakening the US dollar further.

Perhaps one to keep an eye on will be the significant underperformance in US May consumer credit (+US$7.24 billion vs +US$20.25 billion consensus), which highlight downside risks of a slowing consumer outlook. But at least for now, with still some pockets of resilience in the US economy, it may have to take more to challenge hopes of a soft landing.

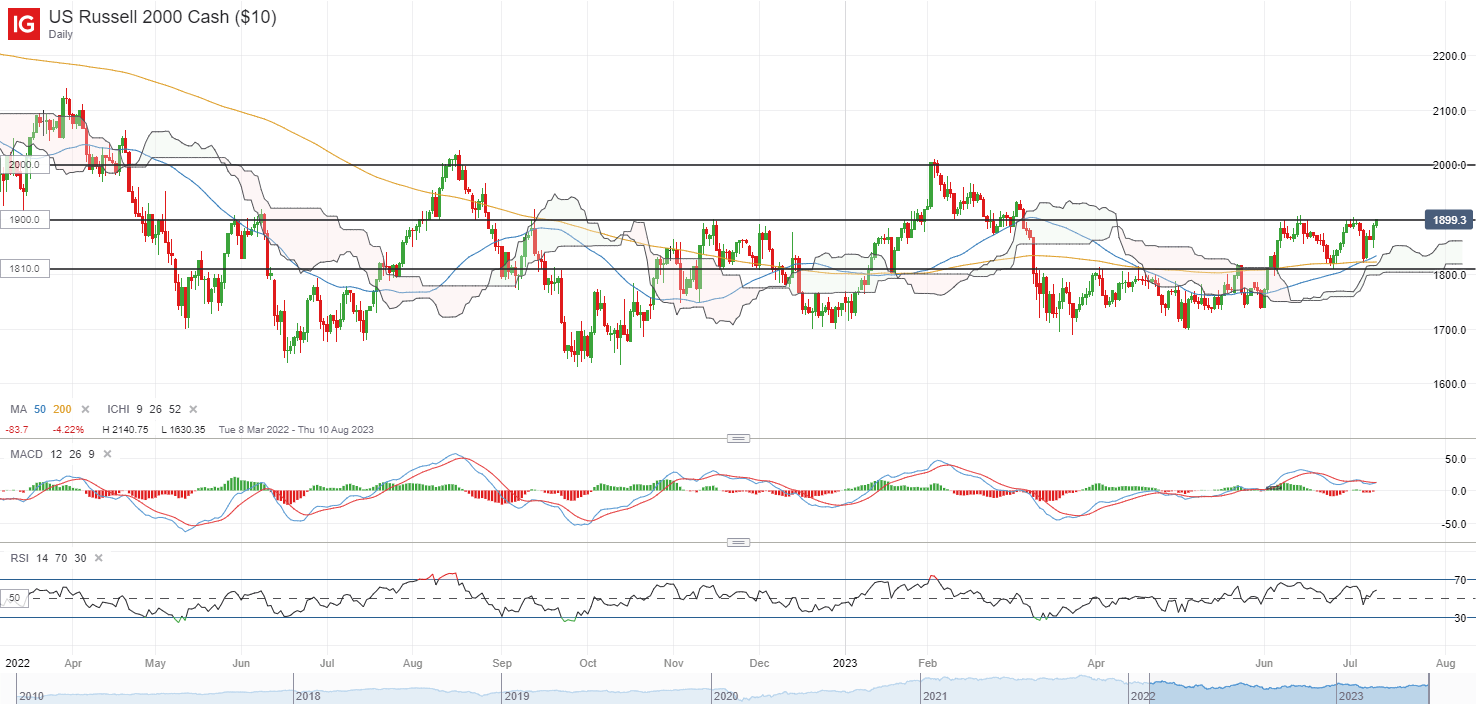
The Russell 2000 index is currently back to retest its 1,900 level of resistance for the fourth occasion since June this year. Multiple retests of resistance over a relatively short span of time may drain the supplies of sellers at that level and raise the odds of an upward break. Any successful move above the 1,900 level may pave the way to retest its year-to-date high at around the 2,000 psychological level next.

image1.png

Asia Open

Asian stocks look set for a positive open, with Nikkei +0.58%, ASX +0.88% and KOSPI +1.09% at the time of writing. Chinese equities has displayed some resilience yesterday despite a set of lacklustre inflation figures reinforcing the slowing economic outlook, as the data was perceived to provide more room for supportive measures over the coming months. There was a slight glimpse of that in its property market overnight, with China authorities extending loan relief and stepping up pressure on financial institutions to ease terms for property companies to ensure that homes construction are completed.

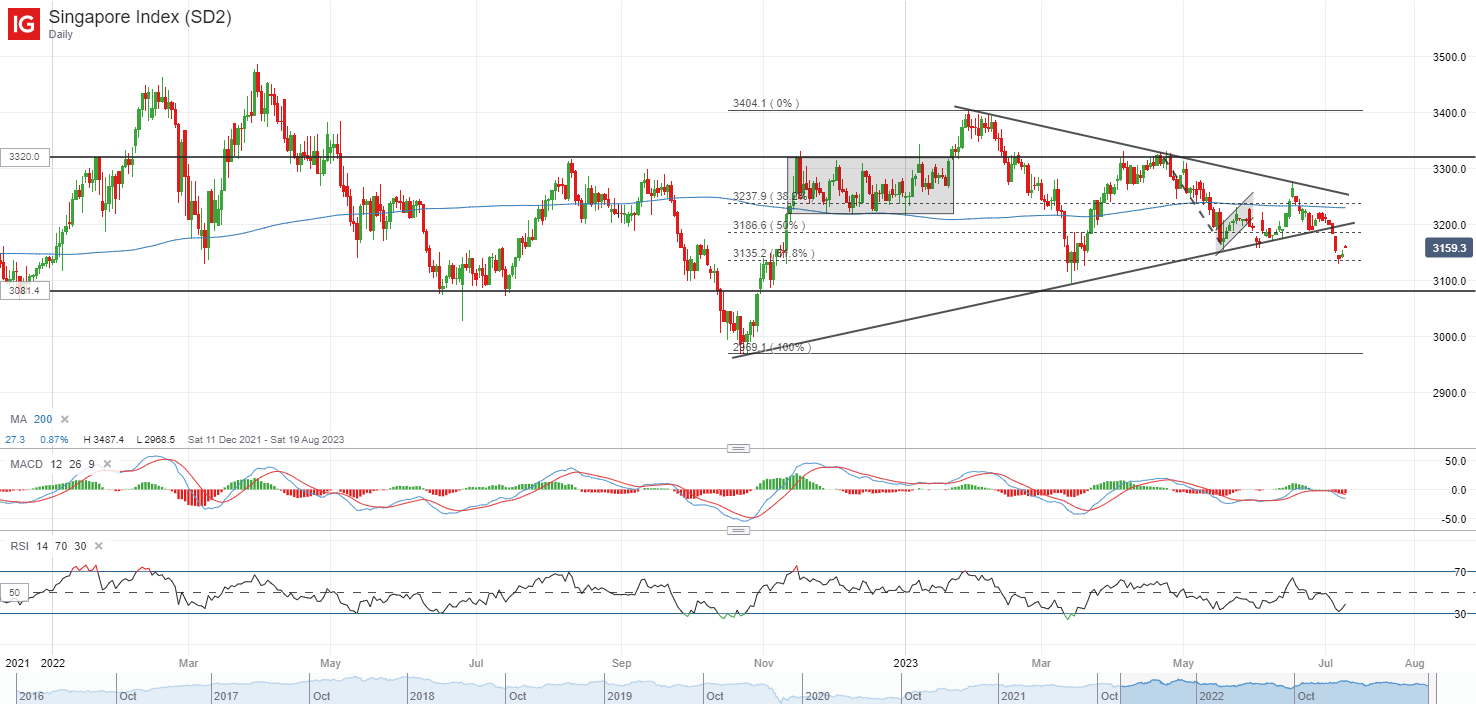
Closer to home, the latest SGX fund flow data has revealed S$109 million net outflows from institutional investors last week, bringing the past four weeks’ net outflows to S$314 million. Further paring of exposure in financial services (-S$89 million) and REITs (-S$45.1 million) were presented. On the technical chart, the lower trendline of a symmetrical triangle pattern has been broken down last week, putting sellers in control after months of indecision. While the index may attempt to tap on the broader risk environment for some intermittent bounces, the overall bias leans to the downside for now, with declining MACD below zero and RSI below the key 50 level.

image2.png

On the watchlist: USD/CAD retesting key support ahead of Bank of Canada (BoC) meeting this week

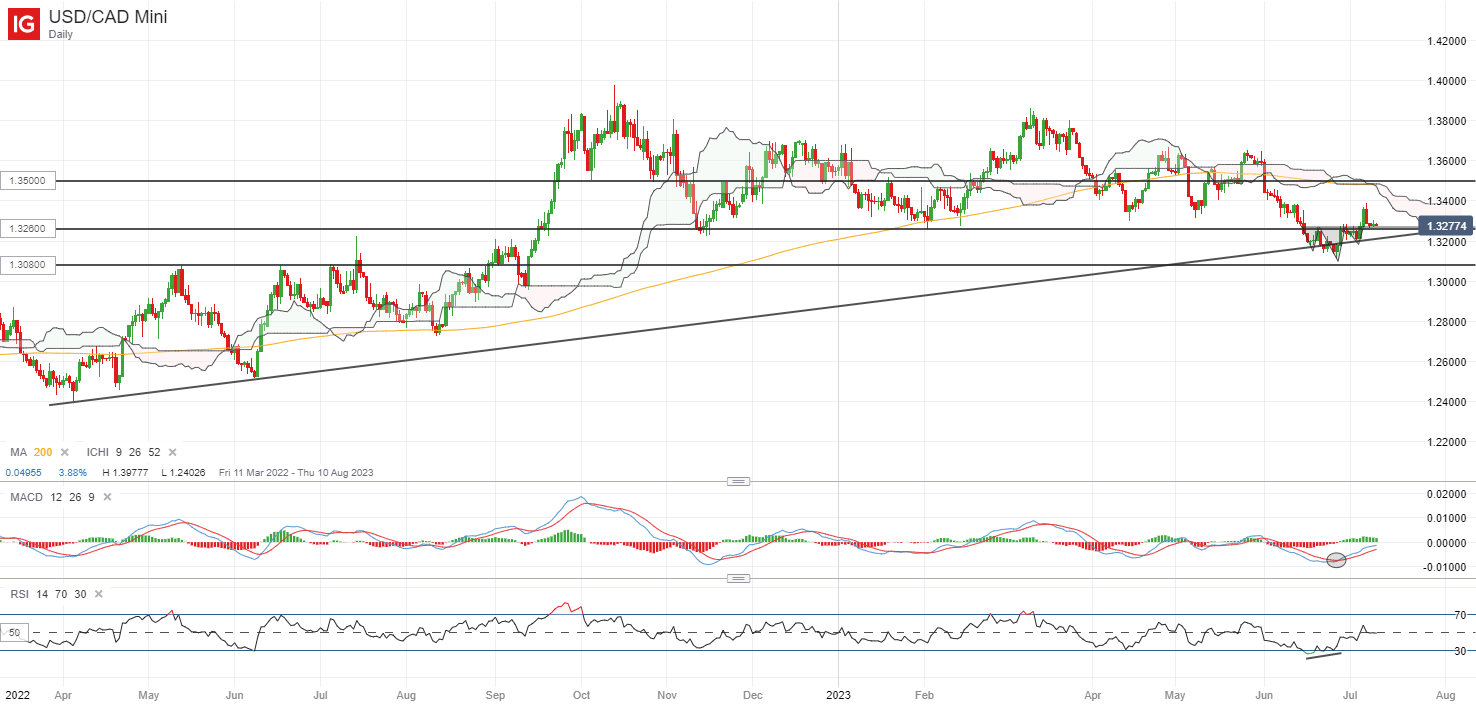
Ahead of the BoC meeting on Wednesday, the USD/CAD is hanging at its key support at the 1.326 level, with rising MACD and a reclaim of the RSI above its 50 level lately suggesting buyers’ attempt to take back some control following a 4% sell-off since June this year. Current expectations are leaning towards another 25 basis-point hike from the BoC at its upcoming meeting, but signs of a softer labour market and receding inflation have called for a prolonged rate pause thereafter. Any confirmation of the central bank heading towards a pause once more may be viewed as less hawkish, which could drive the CAD lower.

For the USD/CAD, the 1.326 level may be a crucial support to hold, where it serves as the neckline of a minor inverse head-and-shoulder formation, in coincidence with a key horizontal support. Defending this level may form a new near-term higher low and leaves the 1.350 level on watch next.

image3.png