New Zealand Dollar Flexes Muscles Ahead of RBNZ; NZD/USD, EUR/NZD, GBP/NZD Price Action

New Zealand Dollar Flexes Muscles Ahead of RBNZ; NZD/USD, EUR/NZD, GBP/NZD Price Action

The New Zealand dollar is showing signs of building a base against some of its peers ahead of the Reserve Bank of New Zealand (RBNZ) interest rate decision on Wednesday.

The RBNZ is widely expected to keep its benchmark official cash rate on hold at the 14-year high after signaled in May that NZ interest rates are at their peak. NZ’s growth outlook has deteriorated significantly since the second quarter of 2023 as the massive 525 basis points of interest rate hikes spill over to the economy.

However, given inflation is way above the NZ central bank’s target range, the bias for rates remains up if RBNZ follows the renewed hawkishness of global central banks in recent months. This could boost the underperforming NZD, especially given the neutral speculative NZD positioning.

Key focus is also on US CPI data due this week. If price pressures moderate more than expected, USD could take a backseat globally. For now, though, the rate futures market is showing a 95% of a 25-basis-point hike by the US Federal Reserve at its meeting later this month, according to the CME FedWatch tool.

NZD/USD Daily Chart
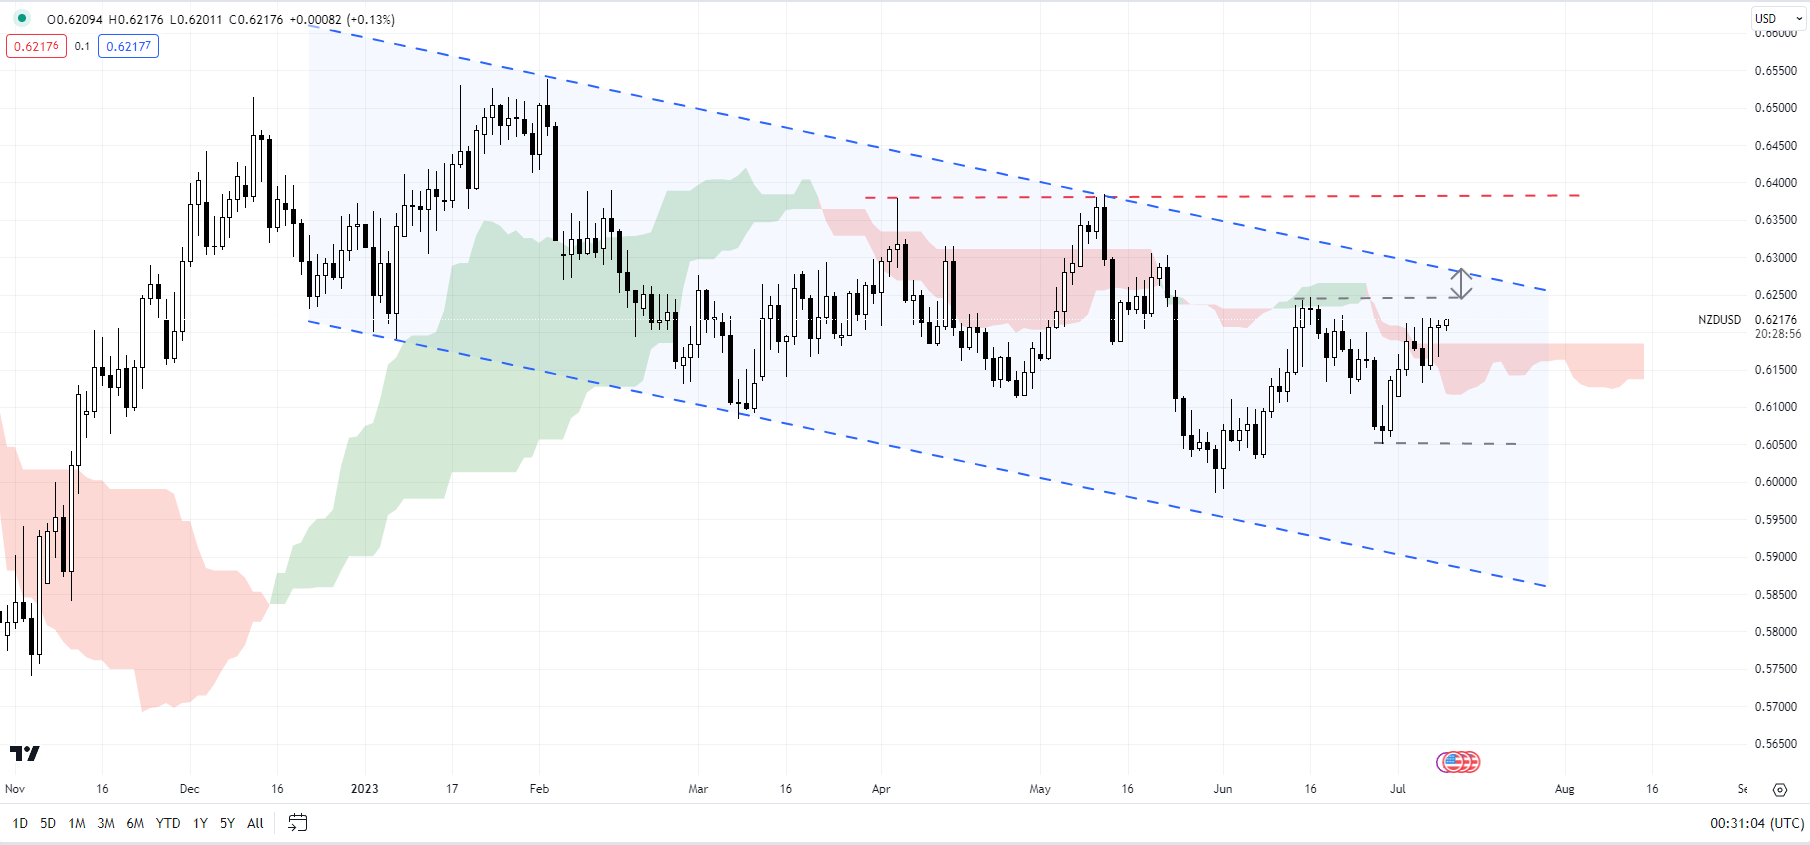
image1.png

NZD/USD: Base building?

On technical charts, within a broader downtrend channel since the start of the year, NZD/USD has created a higher low – a tentative sign that the bearish pressure could be fading. Any break above the immediate converged barrier on the upper edge of the channel, roughly around the mid-June high of 0.6250. Any break above would confirm that the downward pressure had faded, opening the way toward the May high of 0.6385. As mentioned in the previous update, a move above 0.6385 is vital for the broader bearishness to reverse. See “New Zealand Dollar Ahead of US PCE Data; NZD/USD, AUD/NZD, GBP/NZD Price Setups”, published June 28.

EUR/NZD Daily Chart
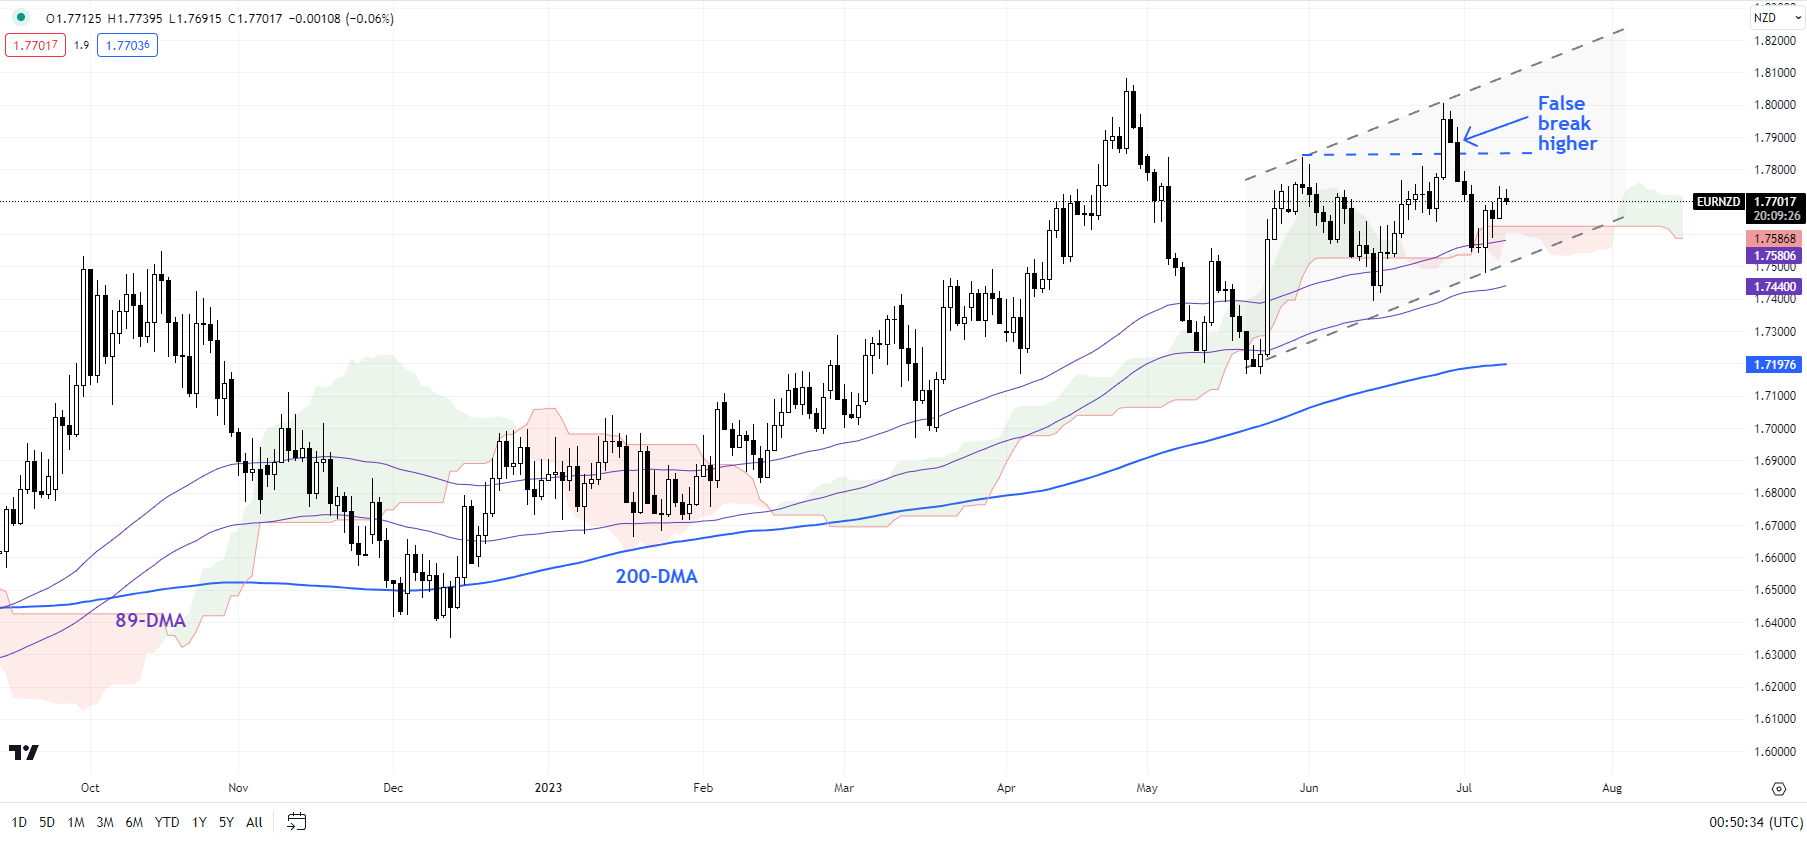
image2.png

EUR/NZD: False break higher raises downside risks

EUR/NZD attempted to break above a cap at the end-May high of 1.7835 but failed to do and subsequently pulled back from the top end of a rising channel from May. The cross has surrendered nearly all of its gains in the process, raising the odds of a fall below the lower edge of the channel (now at about 1.7500). Such a drop could open the road toward the 200-day moving average (now at about 1.7200).

GBP/NZD Monthly Chart
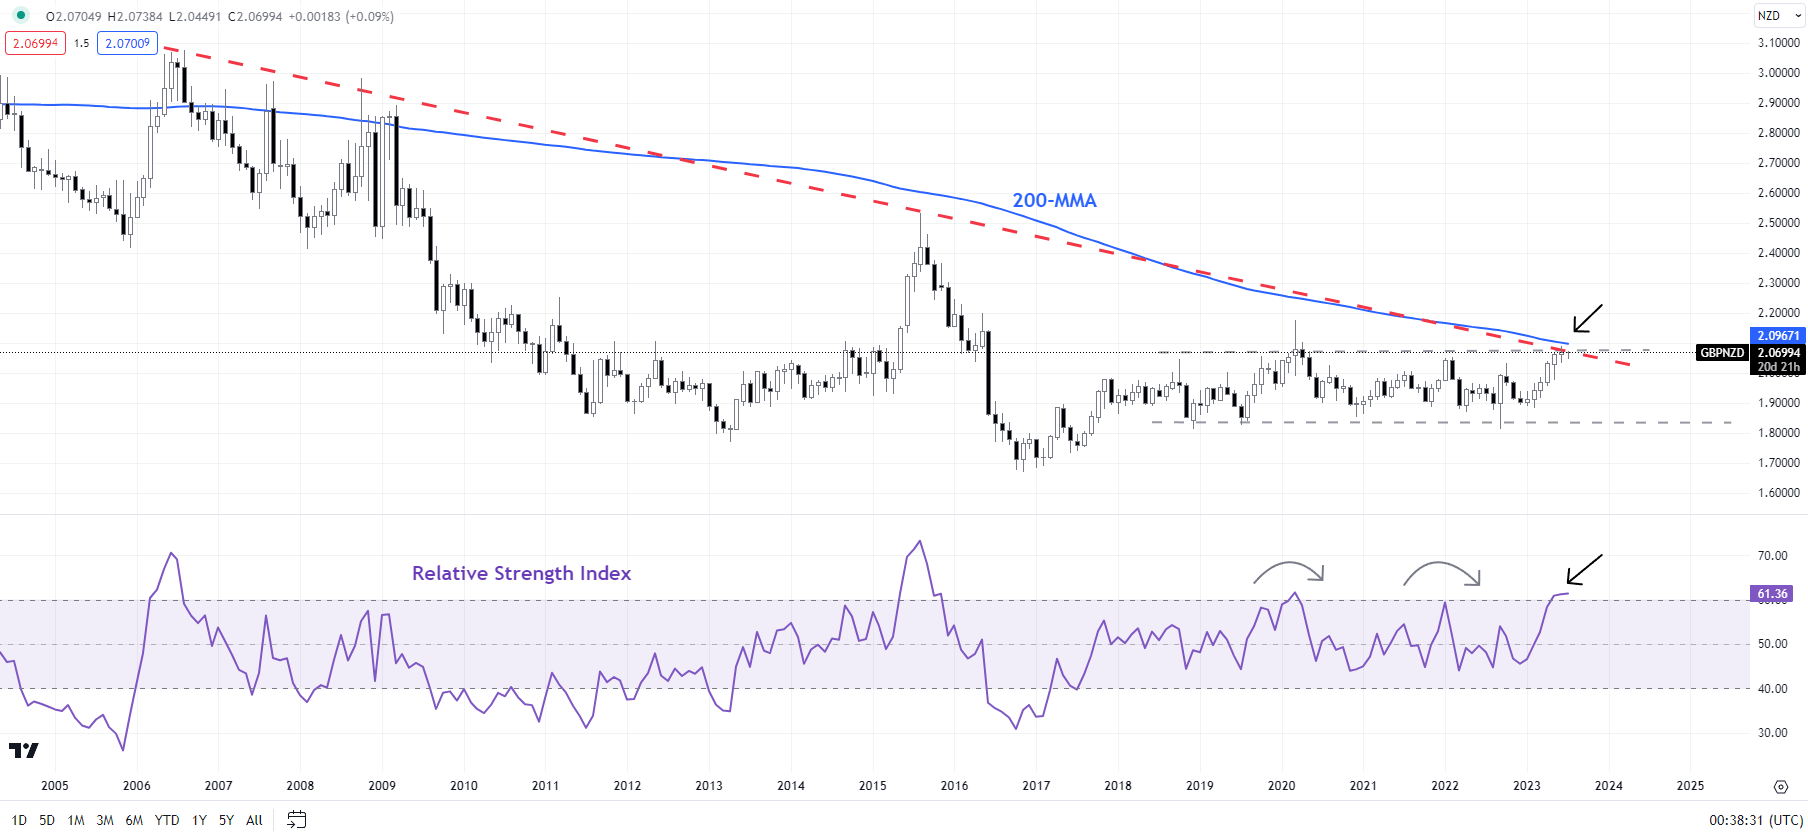
image3.png

GBP/NZD: Could find it tough to crack resistance

GBP/NZD could find it tough to crack the immediate ceiling at the early-June high of 2.0735, coinciding with the 200-month moving average. The 14-month Relative Strength Index appears to be rolling over – similar to the previous two instances in 2020 and 2022, which were associated with a retreat in the cross. While there is no sign of a reversal of the uptrend, chances are GBP/NZD may have to consolidate before it embarks on a new leg higher.

Gold Price Firms While US Dollar Eases as Treasury Yields Dip. Where to for XAU/USD?

Gold Price Firms While US Dollar Eases as Treasury Yields Dip. Where to for XAU/USD?

The gold price eked out some gains through the Asian session today as markets digest Fed commentary and Treasury yields slipping overnight.

The tighter policy chorus line included the Federal Reserve’s Vice Chair for Supervision, Michael Barr, that was joined by Cleveland Federal Reserve President Loretta Mester and San Francisco Federal Reserve President Mary Daly.

On policy tightening, their remarks swayed between ‘we’re close, we have a lot of work to do’ and ‘we’re likely to need a couple more rate hikes’.

Somewhat counterbalancing those comments, Atlanta Federal Reserve President Raphael Bostic said that the Fed can be patient, acknowledging the restrictive stance of the bank.

Overall, it seems that the market is anticipating a potentially soft US CPI number on Wednesday to allay fears of an aggressive stance by the Fed at its July 26th Federal Open Market Committee (FOMC) meeting.

Treasury yields have retreated from their highs seen last week with the benchmark 10-year note dunking under 4% after nudging up against 4.10% last Friday.

The US Dollar appears to have been undermined with the Japanese Yen continuing to see the largest gains. USD/JPY traded above 145 at the end of June and is now below 141.

Crude oil has steadied through the Asian session with the WTI futures contract near US$ 73.50 bbl while the Brent contract is a touch above US$ 78 bbl.

APAC equities are mostly higher with Hong Kong’s Hang Seng Index (HSI) and South Korea’s KOSDAQ index leading the way.

China announced some support for its property sector, and it seems to have led to expectations that more stimulatory measures might be forthcoming.

UK jobs data as well as German CPI and ZEW survey might provide some market movement. The RBNZ will be making a decision on its cash rate tomorrow.

GC1 (GOLD FUTURES) TECHNICAL ANALYSIS

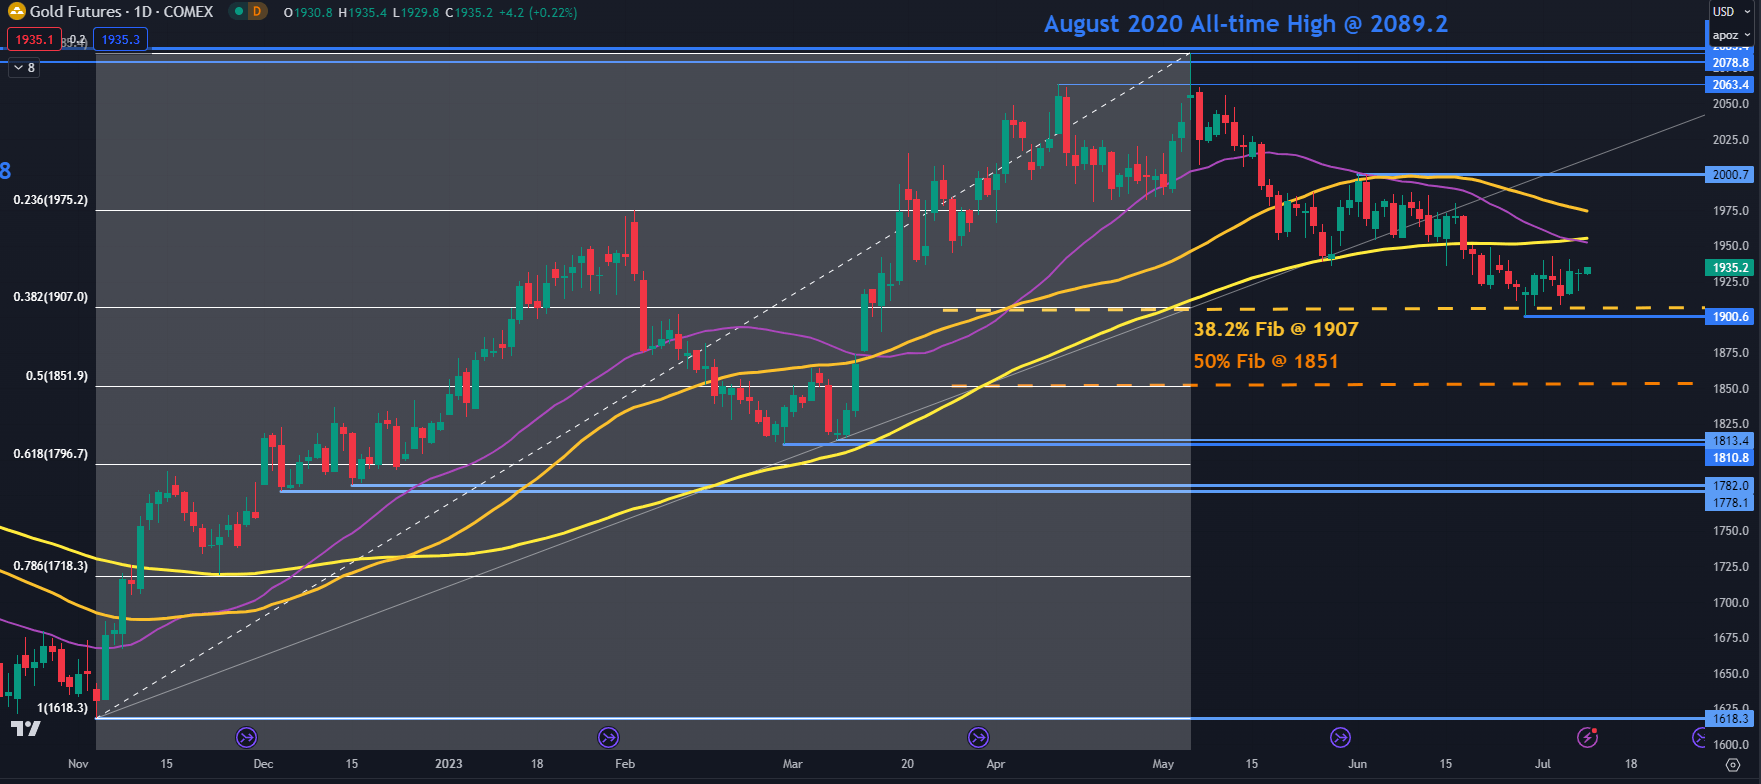
The gold price appears to be establishing a new range, trading between 1900 and 2000 for almost 2 months.

On the downside, support may lie at the Fibonacci Retracement levels of the move from 1618 up to 2085. The 38.2% retracement level is at 1907 and the 50% at 1851. The recent low 1900 might also see some support.

On the topside, resistance could be offered in the 1950 – 1975 area where the 34-, 55- and 100-day simple moving averages (SMA) reside. The peak of 200 may offer resistance ahead of a potential resistance zone in the 2060 – 2090 area.

image1.png


EUR/USD Hits Fresh 2-Month High, Time for a Pullback?

EUR/USD Hits Fresh 2-Month High, Time for a Pullback?

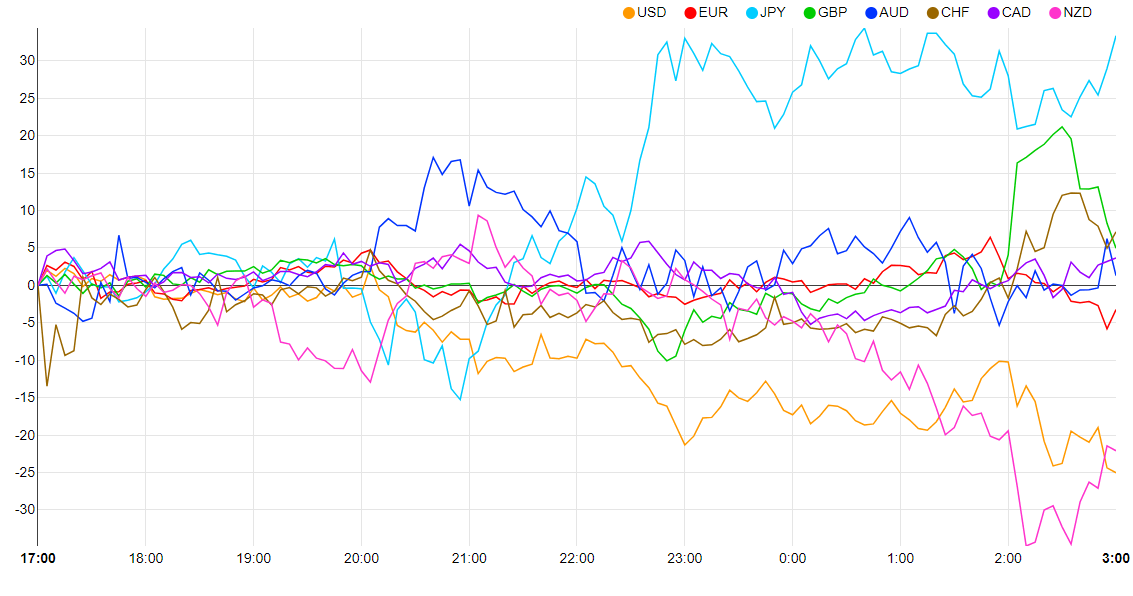
EUR/USD has breached the psychological 1.1000 handle following a resurgence in US Dollar weakness. Following a bright start to the week for the Dollar, the US session brought a renewed bout of weakness to the greenback which has continued into this morning’s European open. The currency strength chart below is a stark contrast to yesterday which saw the Dollar begin the week as one of the strongest currencies. Are we in for sustained Dollar weakness or is this just a result of positioning ahead of the US CPI release tomorrow?

Currency Strength Chart: Strongest – JPY, Weakest – USD.

image1.png

Source: FinancialJuice

FED POLICYMAKERS, GERMAN INFLATION AND ZEW SENTIMENT

Yesterday saw a host of Federal Reserve policymakers speak ahead of the Feds latest blackout period. Maintaining a hawkish rhetoric with many agreeing the Fed are not done yet, however markets seem to have latched on to the fact that many agree the hiking cycle is close to its end. This is in part a likely cause of the Dollar selloff experienced in the US session yesterday ad continued into early European trade this morning.

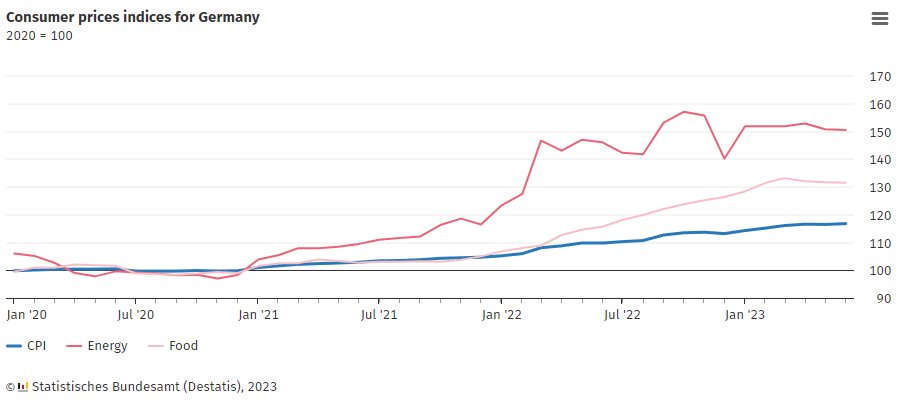
Germany saw an uptick in headline inflation this morning which increased to 6.4% from 6.1% in May. The print was however in line with estimates. The worrying factor in regard to German inflation is that food remained the biggest driver of inflation while Government relief measures from 2022 are also seen as a contributing factor. In May 2023, the consumer price index excluding energy and food stood at +5.4%, the core inflation rate therefore accelerated again in June 2023. In both April and March 2023, the rate also stood at +5.8%.

image2.png

The Euro calendar remains light in terms of risk events this week with ZEW Sentiment due out shortly with comments from ECB policymaker Villeroy expected as well. Neither of these events should have any material impact on EURUSD at this stage with market participants still pricing in two more 25bps hikes by October. On the Dollar side we also have a quiet day with Fed policymaker Bullard expected to speak before attention turns to US CPI on Wednesday.

A close-up of a white background  Description automatically generated

TECHNICAL OUTLOOK AND FINAL THOUGHTS

Looking at EURUSD from a technical perspective and we have just printed a fresh two month high after finding support at the 100 and 200-day MAs. Market structure would suggest that a pullback is in order but given the weakness in the dollar there is every chance EURUSD pushed toward the 1.1100 mark ahead of US CPI tomorrow.

As for a potential break of the range high at 1.1100, I think will be down to US CPI tomorrow with a significant miss to the downside likely to facilitate a break higher. Should the CPI come in near expectations I do fully expect the range high to hold and a potential retracement to come into play. It is worth noting that the 100-day MA is starting to hint at a potential golden cross pattern which could hint at further upside, however this is yet to occur. Given that the RSI is still approaching overbought territory a test of the range high certainly remains a possibility.
A retracement from current price faces immediate support around the 1.0950 handle before the 1.0900 level or the moving averages serving as dynamic support come into play. The 100 and 200-day MA resting at the 1.0817 and 1.0858 respectively.

EUR/USD Daily Chart – July 11, 2023

image4.png

Source: TradingView

Key Levels to Keep an Eye On

Support Levels

Resistance Levels

  • 1.1050
  • 1.1100
  • 1.1187

IG CLIENT SENTIMENT DATA

IGCSshows retail traders are currently SHORT on EURUSD, with 68% of traders currently holding SHORT positions. At DailyFX we typically take a contrarian view to crowd sentiment, and the fact that traders are short suggests that EURUSD may enjoy a short bounce toward the range high before continuing to fall.

UK Breaking News: Wage Growth Keeps Pound Bid

UK Breaking News: Wage Growth Keeps Pound Bid

GBPUSD FUNDAMENTAL BACKDROP

The British pound unusually rallied on a missed employment change figure alongside an increase in unemployment (see economic calendar below) due to yesterday’s statement by the Bank of England (BoE) Governor Andrew Bailey. The statement cited wages and prices are rising too quickly and the MPC is squarely focused on wage, inflation and price data respectively.

UK ECONOMIC CALENDAR (GMT +02:00)

image1.png

TECHNICAL ANALYSIS

GBP/USD DAILY CHART

image2.png

Chart prepared by Warren Venketas, IG

Price action on the daily cable chart above now leaves the 1.2900 psychological resistance handle exposed which has not been tested prior to April 2022. That being said, the Relative Strength Index (RSI) exhibits bearish/negative divergence whereby prices and RSI readings move in opposing directions, possibly eluding to subsequent downside to come.

Key resistance levels:

  • 1.3000
  • 1.2900

Key support levels:

  • 1.2848
  • 1.2680/Trendline support

BULLISH IG CLIENT SENTIMENT

IG Client Sentiment Data (IGCS) shows retail traders are currently net SHORT on GBP/USD with 68% of traders holding short positions (as of this writing). At DailyFX we typically take a contrarian view to crowd sentiment resulting in a short-term upside disposition.

GBP/USD Price Forecast: Pound Anxiously Eyes NFP Data

GBP/USD Price Forecast: Pound Anxiously Eyes NFP Data

GBP/USD FUNDAMENTAL BACKDROP

The British pound has started the European trading session relatively muted against the USD after yesterday’s stellar ISM services and ADP employment change releases. Initial reactions favored the greenback as the Fed’s hawkish narrative was supplemented; however, this has since fallen away most likely due to the lack of historic positive correlation between ADP and NFP figures. That being said, with such a significant ADP beat, it is more likely that the NFP print will beat estimates and should drive support for the US dollar leaving cable exposed to the downside. Unemployment is projected to tick lower while focus will be on average earnings as has been the case recently to gauge its inflationary contributions.

Earlier this morning, UK housing price data (see economic calendar below) naturally dropped once again due to the current high interest rate environment bringing into question economic growth concerns and the return of stagflation term. Markets have largely dismissed this data this far but price volatility should pick up closer to the NFP release.

Trade Smarter – Sign up for the DailyFX Newsletter

Receive timely and compelling market commentary from the DailyFX team

Subscribe to Newsletter

GBP/USD ECONOMIC CALENDAR (GMT +02:00)

image1.png

Source: DailyFX Economic Calendar

TECHNICAL ANALYSIS

GBP/USD DAILY CHART

image2.png

Chart prepared by Warren Venketas, IG

Price action on the daily cable chart above shows elevated levels but may be in for a turn lower should NFP data beat estimates with the first port of call the 1.2680 swing support zone.

Key resistance levels:

  • 1.2848

Key support levels:

  • 1.2680
  • Trendline support

BULLISH IG CLIENT SENTIMENT

IG Client Sentiment Data (IGCS) shows retail traders are currently 58% SHORT on GBP/USD (as of this writing). At DailyFX we typically take a contrarian view to crowd sentiment resulting in a short-term upside bias.

Gold and Silver Price Forecast: XAU/USD, XAG/USD May Fall Amid Bullish Retail Traders

Gold and Silver Price Forecast: XAU/USD, XAG/USD May Fall Amid Bullish Retail Traders

Gold and silver prices have been in a prolonged downtrend since topping in May. In response, retail traders have been gradually increasing upside exposure in XAU/USD and XAG/USD. This can be seen by looking at IG Client Sentiment (IGCS). IGCS typically functions as a contrarian indicator, especially in trending markets. With that in mind, could further pain be ahead for these precious metals?

Gold Sentiment Outlook – Bearish

The IGCS gauge shows that about 76% of retail traders are net-long gold. Since most of them are biased higher, this hints that prices may fall further. This is as downside exposure decreased by 13.02% and 14.63% compared to yesterday and last week, respectively. With that in mind, the combination of overall positioning and changes in recent exposure offers a stronger bearish contrarian trading bias.

Gold Client Positioning

XAU/USD Daily Chart

On the daily chart, gold has been in a near-term downtrend since May. In June, XAU/USD confirmed a breakout under the rising support line from November. That opened the door to an increasingly bearish technical bias. Since then, the price has been stabilizing around the 38.2% Fibonacci retracement level at 1903. A confirmatory downside breakout exposes the midpoint of 1848. Otherwise, near-term resistance seems to be the inflection point at 1936.9.

image2.png

Silver Sentiment Outlook – Bearish

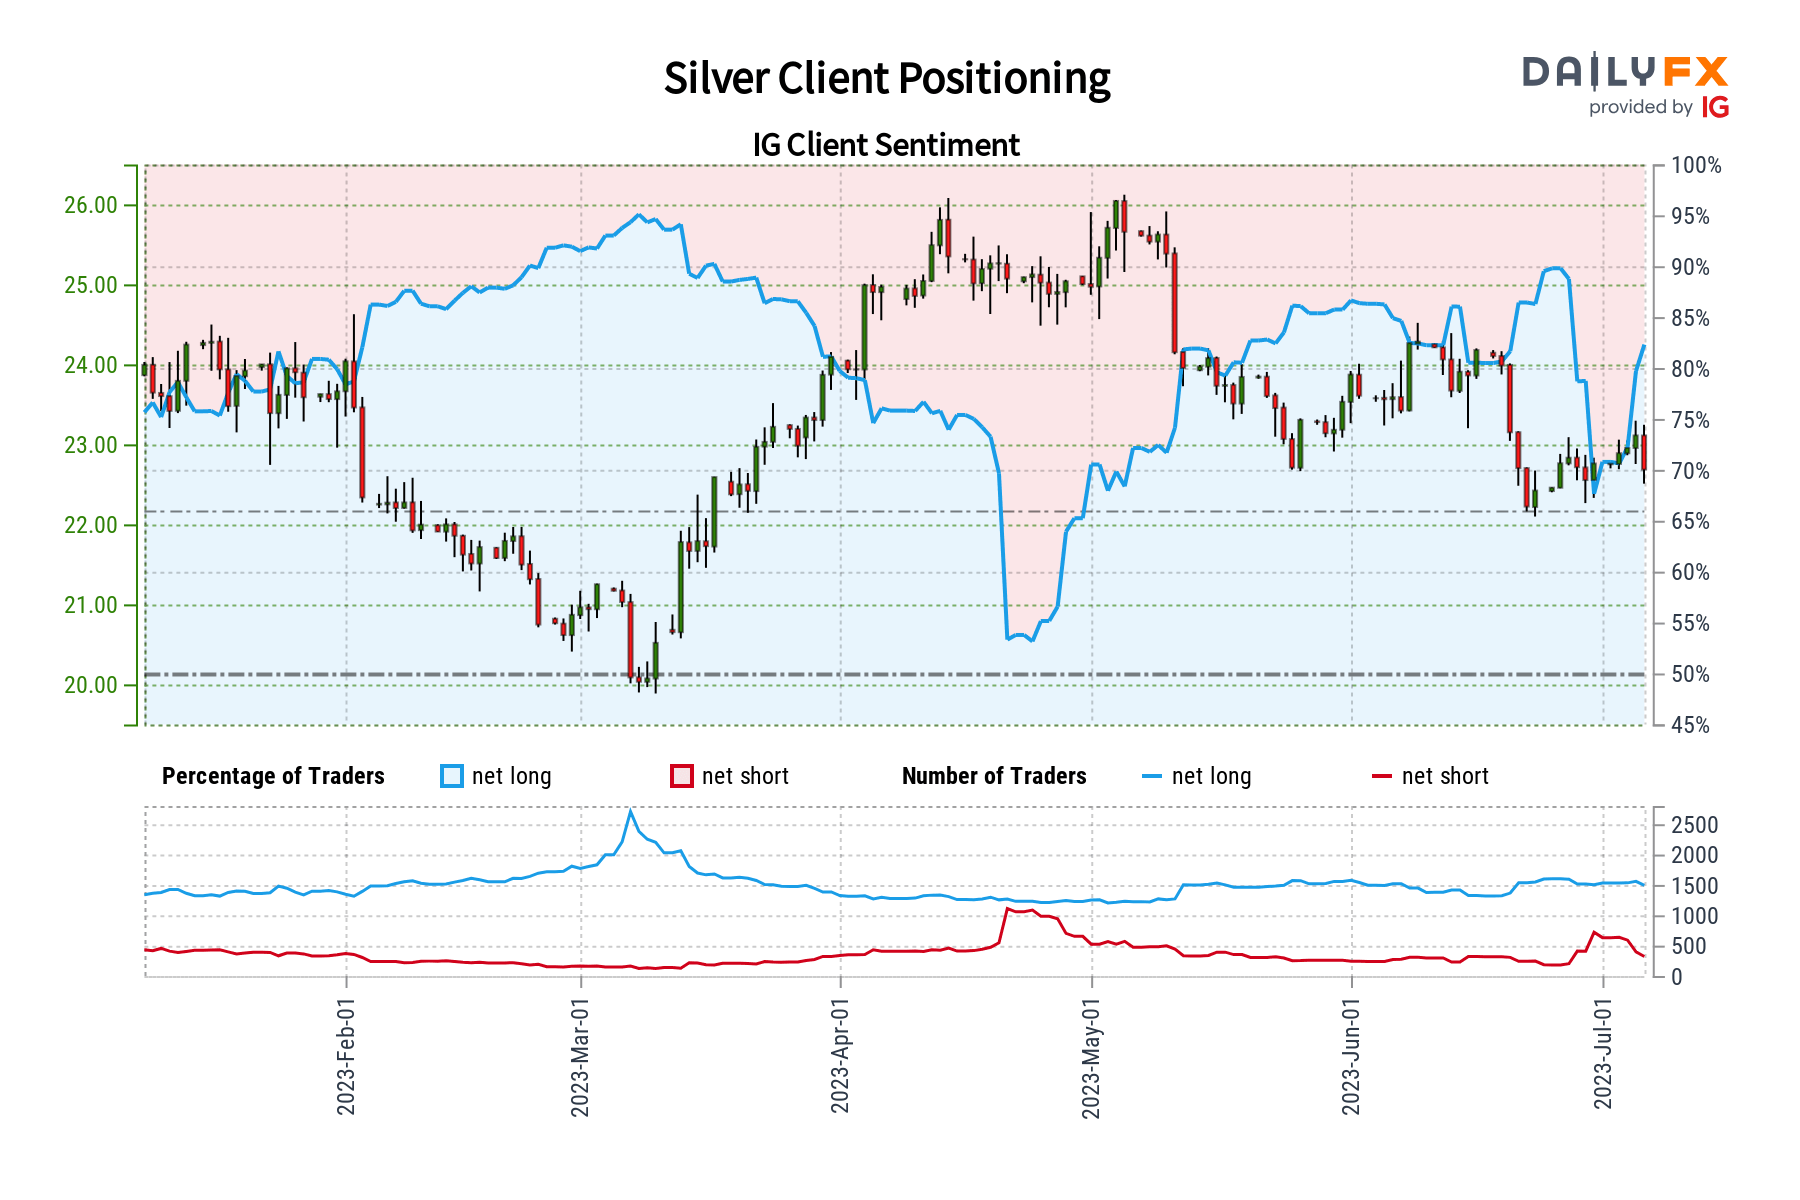
The IGCS gauge displays that roughly 85% of retail traders are net-long silver. Since the majority are biased to the upside, this hints prices may continue lower down the road. This is as downside exposure declined by 12.89% and 60.60% compared to yesterday and last week, respectively. With that in mind, the combination of recent changes and overall exposure offers a stronger bearish contrarian trading bias.

Silver Client Positioning

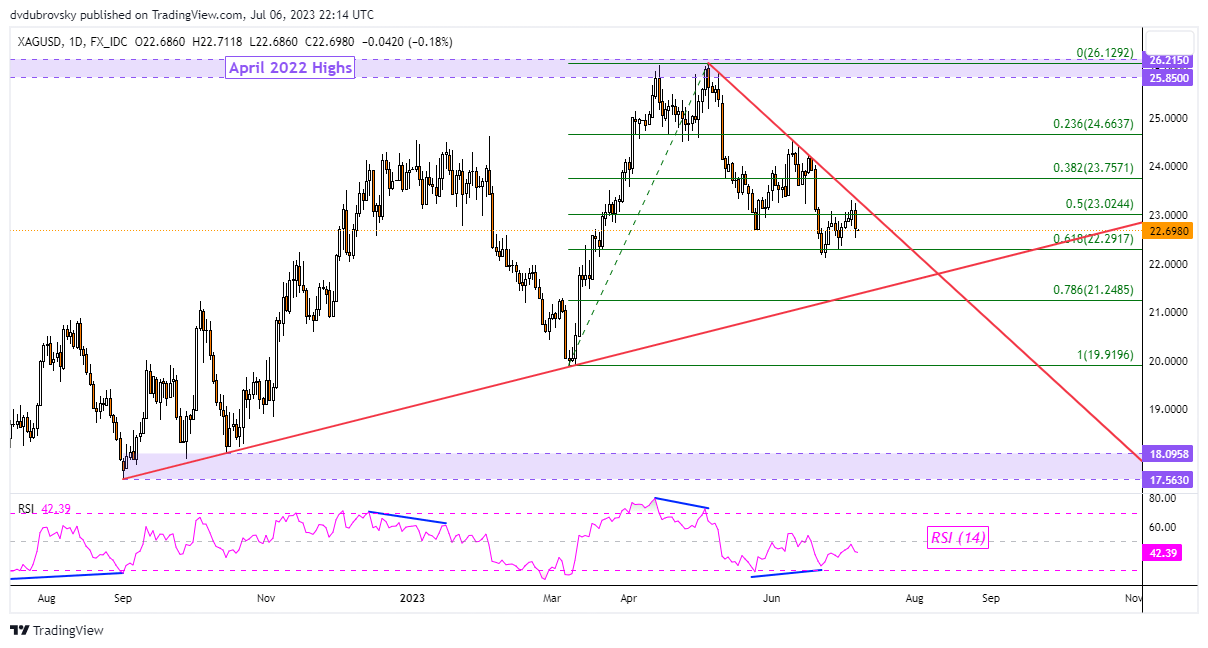
XAG/USD Daily Chart

Looking at the daily chart, silver remains in a downtrend as well. The difference with gold is that XAG/USD remains long-term biased upward by rising support from September. That said, a falling trendline from May is holding as resistance, maintaining the near-term downtrend. Immediate support as the 61.8% Fibonacci retracement level at 22.29. Clearing this price exposes rising support. Otherwise, breaking above falling resistance releases the 38.2% level at 23.75.

image4.png


Asia Day Ahead: US Data Calls for Hawkish Bias in Fed’s Policy

Asia Day Ahead: US Data Calls for Hawkish Bias in Fed’s Policy

Resilient labour market conditions and persistent services sector’s prices were not well-received by Wall Street yesterday, as the overnight data called for a hawkish bias in Federal Reserve’s (Fed) policies. A significant beat in the US ADP report (497,000 versus 228,000 forecast) was followed up with continued strength in the services sector, as the US ISM services purchasing managers index (PMI) data came in at its highest reading in four months (53.9 versus 51 forecast). Still-robust labour demand was also reinforced by a renewed expansion in the services PMI employment index (53.1 versus 49.9 forecast).

Given that the Fed has previously expressed their unease over services’ inflation, the persistence in services prices from the ISM data (54.1 versus 53.3 forecast) further challenged the pace of progress in inflation. The overall data brought about an upward surge in US Treasury yields, as rate cut bets have been facing some pushback lately from January to May next year. Notably, the US 10-year has crossed the 4% mark for the first time since March this year.

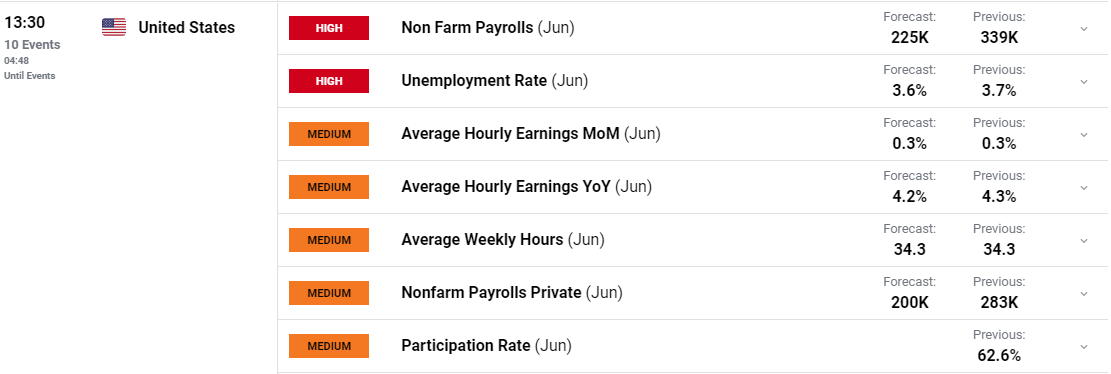
While the ADP has not been a good predictor for the US non-farm payroll historically, some signs of a resilient labour market still raises the odds for a stronger US job report today. Over the past one year, the US job report has outperformed market expectations on 11 out of 12 occasions, with a notable reacceleration viewed over the past two months. Forecasts for June are for a 200,000 increase, with unemployment rate remaining unchanged at 3.7%. Another set of better-than-expected readings may support hopes of a soft landing but could also pressure the Fed to do more, with eyes on the wage inflation figure as well.

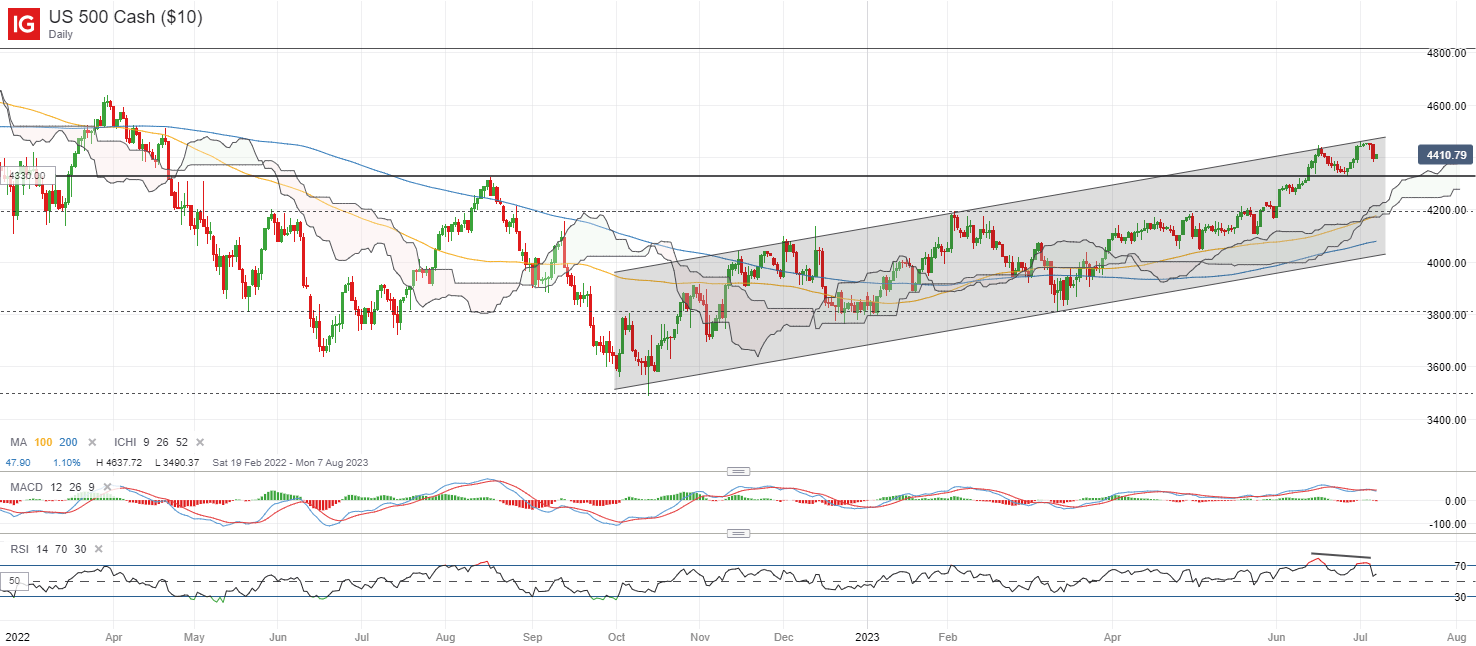
The S&P 500 has met some resistance at the upper trendline of an ascending channel pattern for now, with lower highs on daily RSI pointing to moderating upward momentum. Near-term overcrowded sentiments may be reflected with a reversion in the Fear and Greed Index back to ‘extreme greed’ territory late last week, although seasonality in July remains in favour for a continuation of the upward trend, which leave any formation of a higher low on watch. For now, further downside will likely pave the way for the formation of a double-top pattern, with the 4,330 level serving as the crucial neckline to hold for the bulls.

image1.png

Asian stocks look set for a downbeat open, with Nikkei -0.45%, ASX -1.86% and KOSPI -1.02% at the time of writing, largely tracking the negative handover from Wall Street. A 3% retreat in the Hang Seng Index in the yesterday’s session seems to reflect investors’ anxiety over China’s consumption-led recovery, further amplified by Goldman Sachs’ recent downgrade of its top lenders and some unnerves around US-China relationship. The Hang Seng Mainland Banks Index is down more than 9% over the past week.

The regional economic calendar this morning saw a surprise jump in Japan’s average cash earnings (2.5% versus 0.7% forecast) in May. With subdued wage increases looked upon as a basis for ‘transitory’ inflation by the Bank of Japan (BoJ), recent pull-ahead in wage pressures seems to renew bets for a quicker policy shift. That said, a continued contraction in real wages for the 14th consecutive month and a sharper-than-expected decline in household spending (-4% versus -2.4% forecast) may still call for some reservations.

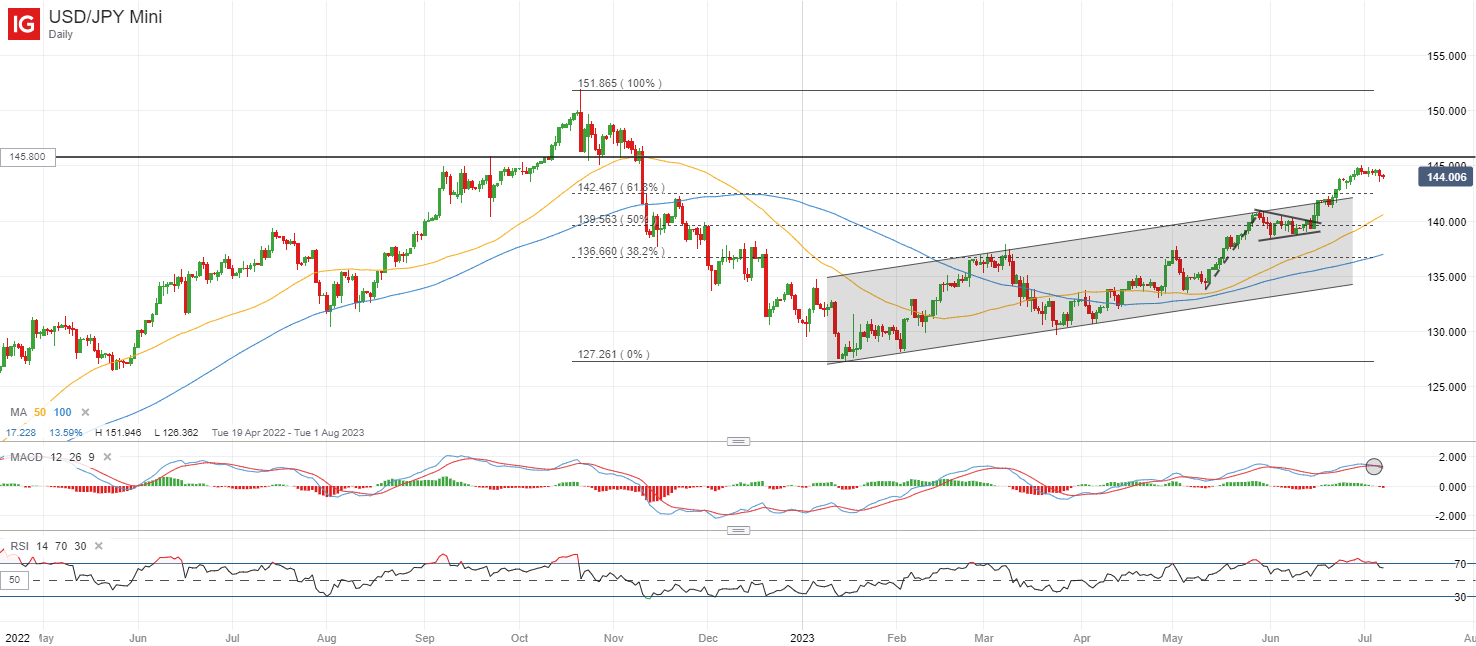
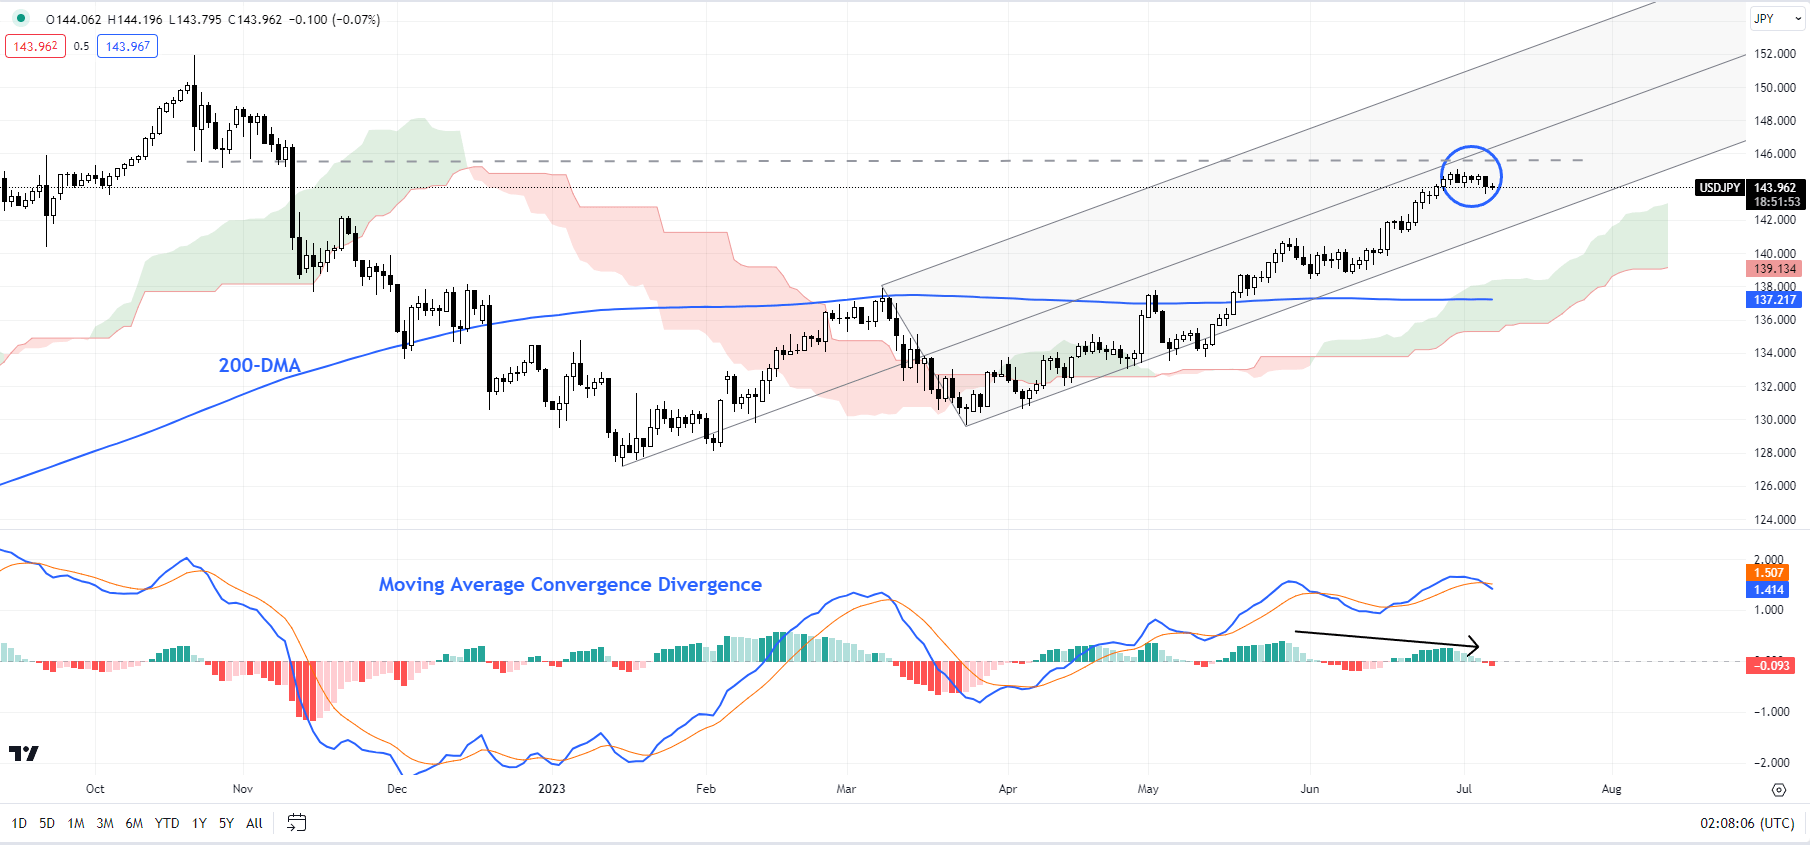
The USD/JPY has been consolidating around the 145.00 level lately, as it nears a previous level of intervention by the BoJ back in September 2022. While a bearish crossover on MACD and moderating RSI from previous overbought levels points to some near-term exhaustion, the pair tends to track the US-Japan 10-year yield differentials closely over the past year, with recent surge in the US 10-year yields to its four-month high potentially providing some support for the pair. The upward trend remains in place for now, with the formation of higher highs and higher lows since the start of the year, with any retracement placing the 142.50 level on watch as immediate support.

image2.png

On the watchlist: USD/CAD on watch ahead of US and Canada’s job report today

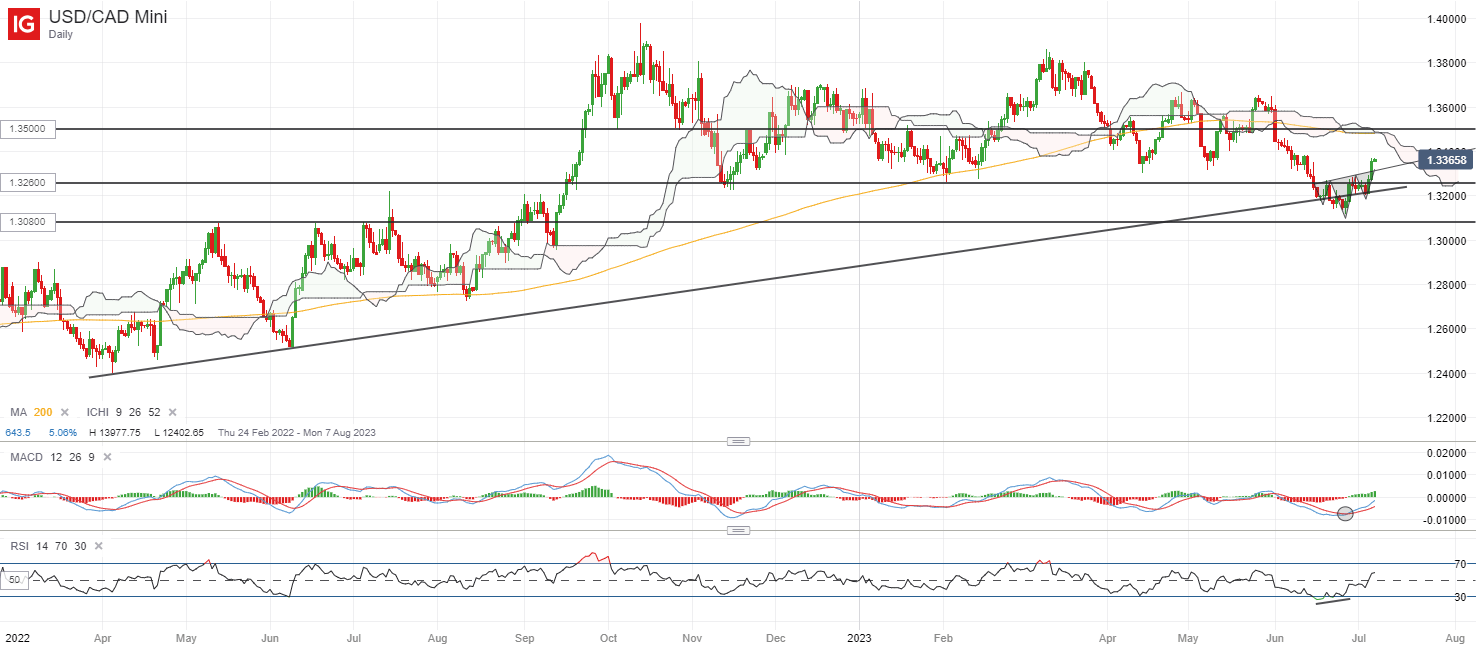
Following a brief breakdown of the 1.326 level of support last month, the USD/CAD has shown some resilience lately, gaining by 1.2% over the past week. A minor inverse head-and-shoulder formation seems to be in place since mid-June this year, with a recent break above the neckline yesterday potentially putting the 1.350 level on watch for any retest, as increasing RSI and MACD point to building upward momentum.

Much will be determined by the job report releases from both the US and Canada later today. Thus far, policymakers from both ends have expressed their unease over recent labour market resilience, which calls for a hawkish tilt in their respective policy guidance. Any divergence in labour market conditions will be on watch, with any softer labour data likely to translate to some weakness in its currency. For the USD/CAD, any downside may leave the 1.326 level back on the radar for near-term support, where an upward trendline support stands.

image3.png

Japanese Yen Aided by Jump in Japan Wages: USD/JPY, EUR/JPY, AUD/JPY Price Setups

Japanese Yen Aided by Jump in Japan Wages: USD/JPY, EUR/JPY, AUD/JPY Price Setups

The Japanese yen found some bids after Japanese wages rose significantly more than expected, lowering the hurdle for the Bank of Japan to tweak its ultra-loose monetary policy.

Japanese workers’ wages rose 2.5% in May Vs 1.2% expected, and 1.0% in April, reflecting the major labour unions’ wage negotiations this spring that resulted in the biggest increase in pay increase in decades. While many don’t expect the BOJ to adjust policy this year, a few analysts expect tweaks in the yield curve control (YCC) policy later this month.

The continued resilience of the global economy and the resulting upward pressure on bond yields could trigger an adjustment in the YCC policy. However, extreme tightening in financial conditions could cause strains in the financial system, leading to a credit crunch, forcing monetary policy to be eased instead. BOJ summary of opinions at the June policy meeting released recently quoted one board member saying the central bank should debate tweaking YCC to improve market function and mitigate its “high cost”.

USD/JPY 240-Minute Chart

image1.png

BOJ left its ultra-loose policy settings unchanged earlier this month, especially the closely watched YCC policy, in a bid to support the nascent economic recovery and sustainably achieve its inflation goal. BOJ Governor Kazuo Ueda has said the central bank would ‘patiently’ maintain the current policy as there is still some way to stably and sustainably achieve its 2% inflation target.

Meanwhile, the market remains wary of intervention by Japanese authorities as USD/JPY touched 145.00 recently, near the level that triggered an intervention last year for the first time in more than 20 years. Japan’s top officials have said they haven’t ruled out any options.

USD/JPY Daily Chart

image2.png

USD/JPY: No sign of reversal yet

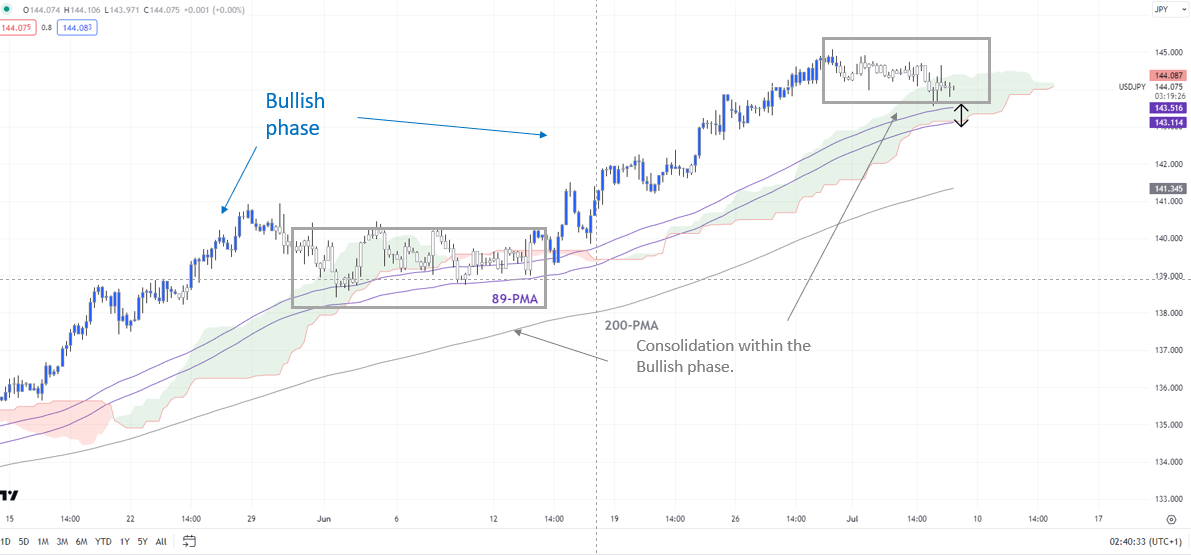
On technical charts, USD/JPY has moved to a consolidation phase within the broader bullish phase recently, as the colour-coded candlestick charts show. There is quite strong converged support on the 89-period moving average and the lower edge of the Ichimoku cloud on the 4-hourly charts. This cushion is strong as it triggered a rebound in USD/JPY last month. Hence a hold above the support can’t be ruled out. However, any break below the support could pave the way toward the 200-period moving average on the 4-hourly chart at about 141.00.

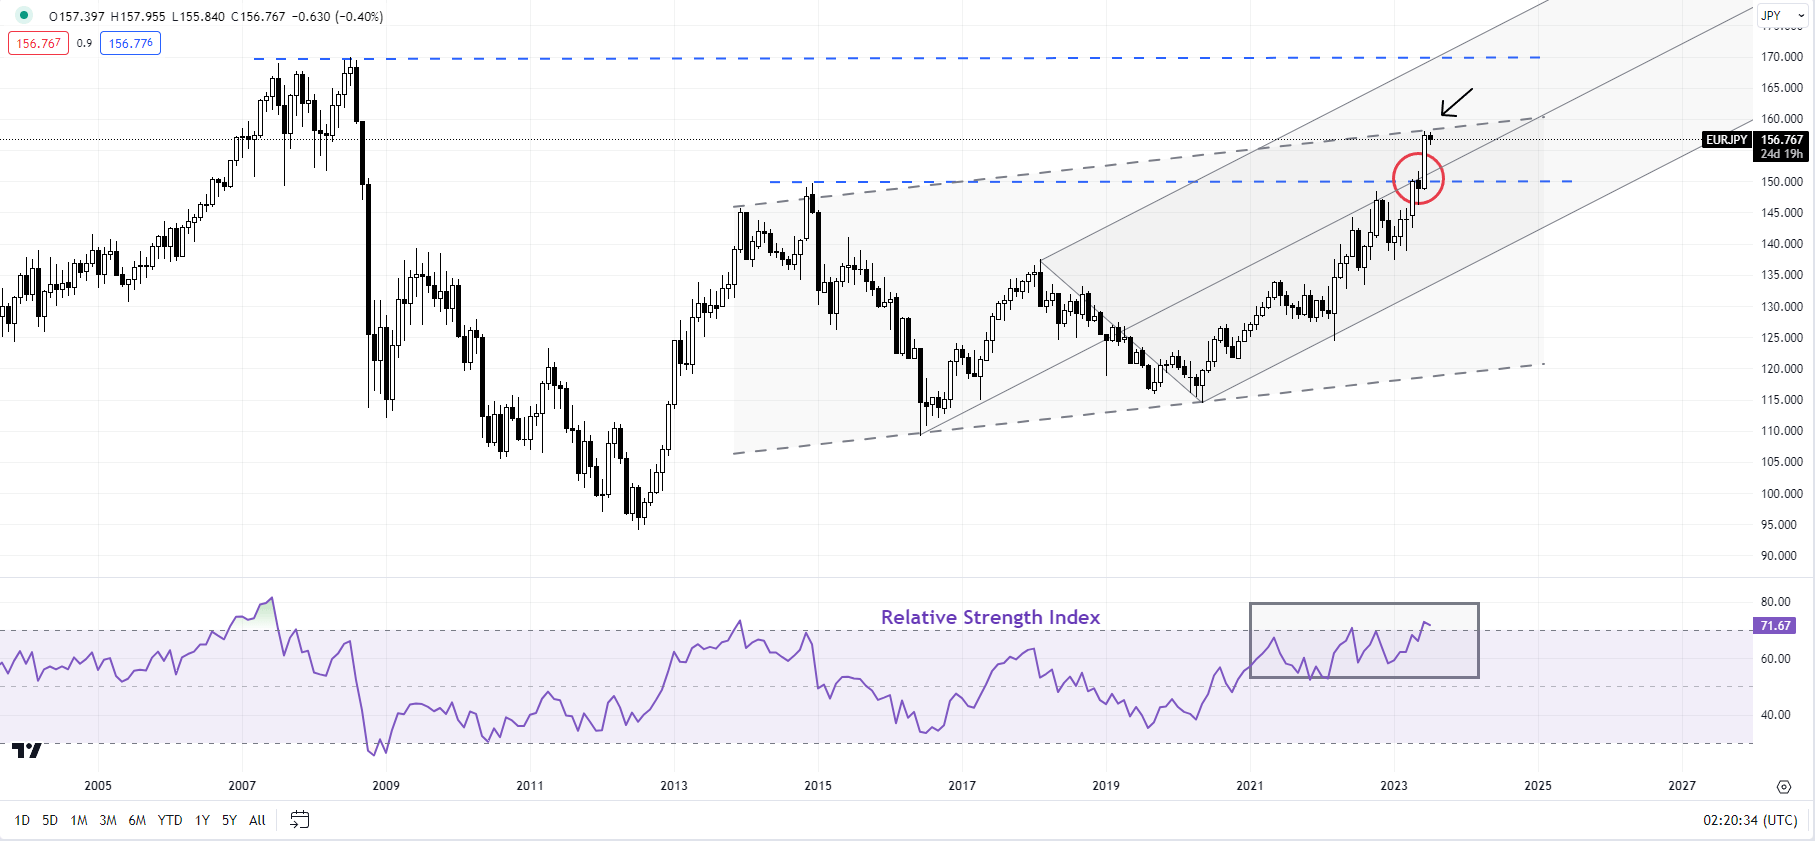
EUR/JPY Monthly Chart

image3.png

EUR/JPY: Overbought, but uptrend remains intact

EUR/JPY is looking overbought as it tests resistance on the upper edge of a slightly upward-sloping channel from 2013. Some consolidation can’t be ruled out within the broader uptrend. This follows a rise above a vital converged barrier at the 2014 high of 149.75, coinciding with the median line of a pitchfork channel from 2016. A decisive break (two monthly closes) above could open the door toward the 2008 high of 170.00.

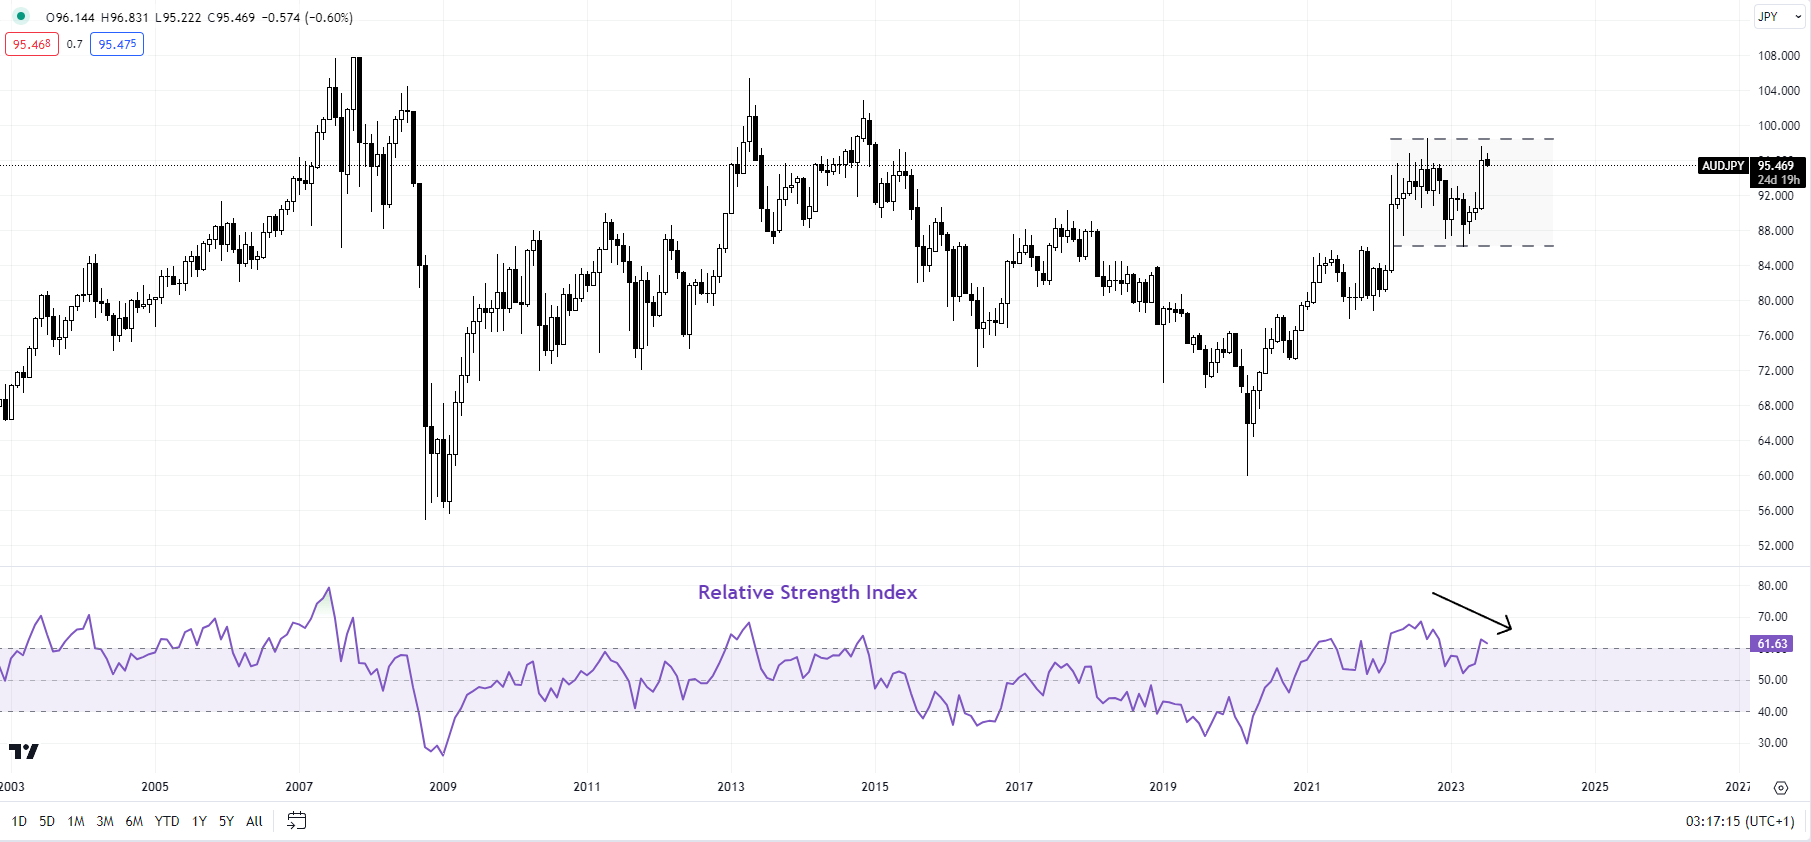
AUD/JPY Monthly Chart

image4.png

AUD/JPY: Rally looks tired for now

A negative divergence (a flattening in price associated with declining momentum) on the monthly charts suggests AUD/JPY’s rally is losing steam in the near term. There is a chance that the cross could continue to move sideways in the recently established range of 86.00-98.50. Only a break below 86.00 would indicate that the broader upward pressure had faded.

Note: The above colour-coded chart(s) is(are) based on trending/momentum indicators to minimize subjective biases in trend identification. It is an attempt to segregate bullish Vs bearish phases, and consolidation within a trend Vs reversal of a trend. Blue candles represent a Bullish phase. Red candles represent a Bearish phase. Grey candles serve as Consolidation phases (within a Bullish or a Bearish phase), but sometimes they tend to form at the end of a trend. Candle colors are not predictive – they merely state what the current trend is. Indeed, the candle color can change in the next bar. False patterns can occur around the 200-period moving average, or around a support/resistance and/or in sideways/choppy market. The author does not guarantee the accuracy of the information. Past performance is not indicative of future performance. Users of the information do so at their own risk.

Crude Oil Holds the High Ground as US Jobs Data Lights Up. Higher WTI?

Crude Oil Holds the High Ground as US Jobs Data Lights Up. Higher WTI?

Crude oil is bumping up against the top end of the recent range going into Friday’s session as robust US data lifted the outlook for economic activity in the world’s largest economy.

Stockpiles of crude reported by the US Energy Information Agency (IEA) revealed a drop of 1.508 million barrels for the week ended June 30th against 983k barrels anticipated and 9.603 fewer barrels in the prior week.

Earlier in the week, the American Petroleum Institute (API) inventory report showed a decrease of 4.382 million barrels for the same week. The shrinking reserves may hint toward a US economy continuing to thrive in the face of the Federal Reserve’s tightening measures.

Compounding this perspective was the ADP National Employment Report that showed 497k non-farm private jobs were added in June, well above estimates of 228k.

Later today, the market will be focussing on the US Bureau of Labour Statistics non-farm payroll figures. A Bloomberg survey of economists estimates that 230k jobs were added last month.

All this positive news saw Treasury yields marching higher again with the benchmark 10-year bond trading back above 4%.

The vigour in the labour market lifted the prospect of a more hawkish Fed at their meeting on the 26th of July. Wall Street finished lower in its cash session and APAC equity indices followed the lead with a sea of red across the region.

The growth-linked currencies of AUD, CAD and NZD are struggling going into the end of the week. Spot gold is also eyeing a 4-month low, trading near US$ 1,910 at the time of going to print.

After US non-farm payrolls data, ECB President Christine Lagarde will be speaking.

The full economic calendar can be viewed here.

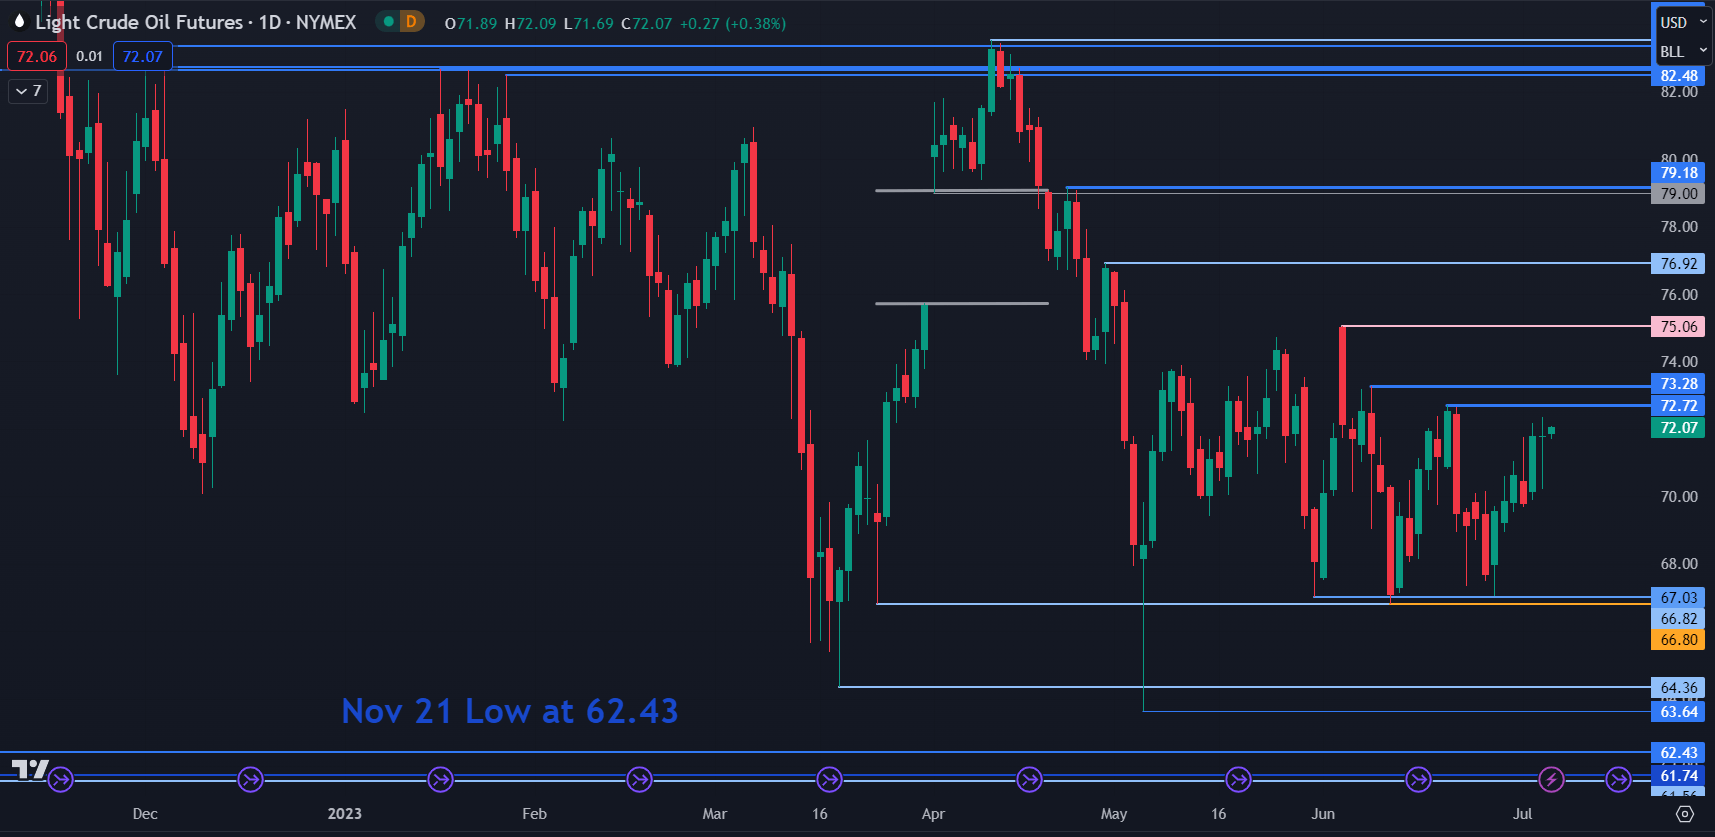
WTI CRUDE OIL TECHNICAL ANALYSIS

WTI crude continues to see range trading conditions with the price contained within 66.80 – 75.06 for more than 2 months. More broadly, it has traded between 63.64 and 83.53 since last November.

With this in mind, previous highs and lows might provide resistance and support respectively.

On the downside, support may lie at 67.03, 66.82, 66.80, 64.36, 63.64 or at the November 2021 low of 62.43.

On the topside, resistance could be at 72.72, 73.28, 75.06, 76.92 and 79.18 ahead of a cluster of breakpoints and prior peaks in the 82.50 – 83.50 area.

image1.png


Gold (XAU/USD) Prices at Risk of Freefall Heading Into NFP Day

Gold (XAU/USD) Prices at Risk of Freefall Heading Into NFP Day

US Yields Rise, Red-Hot ADP Data, NFP Ahead

Gold prices continued their recovery in the Asian session following another day probing the key $1900/0z psychological level. Yesterdays red hot data out of the US facilitated the push toward the $1900 but failing to find acceptance below once more.

US ISM services and ADP data yesterday provided further signs of the resilience of the US economy despite growing calls that a recession is on its way. Following the release market participants understandably adopted a more hawkish outlook on the potential path of the Federal Reserve on the rate hike front. Money market pricing in the immediate aftermath were pricing in roughly 36bps of hikes by November, up from the 28bps ahead of the data releases.

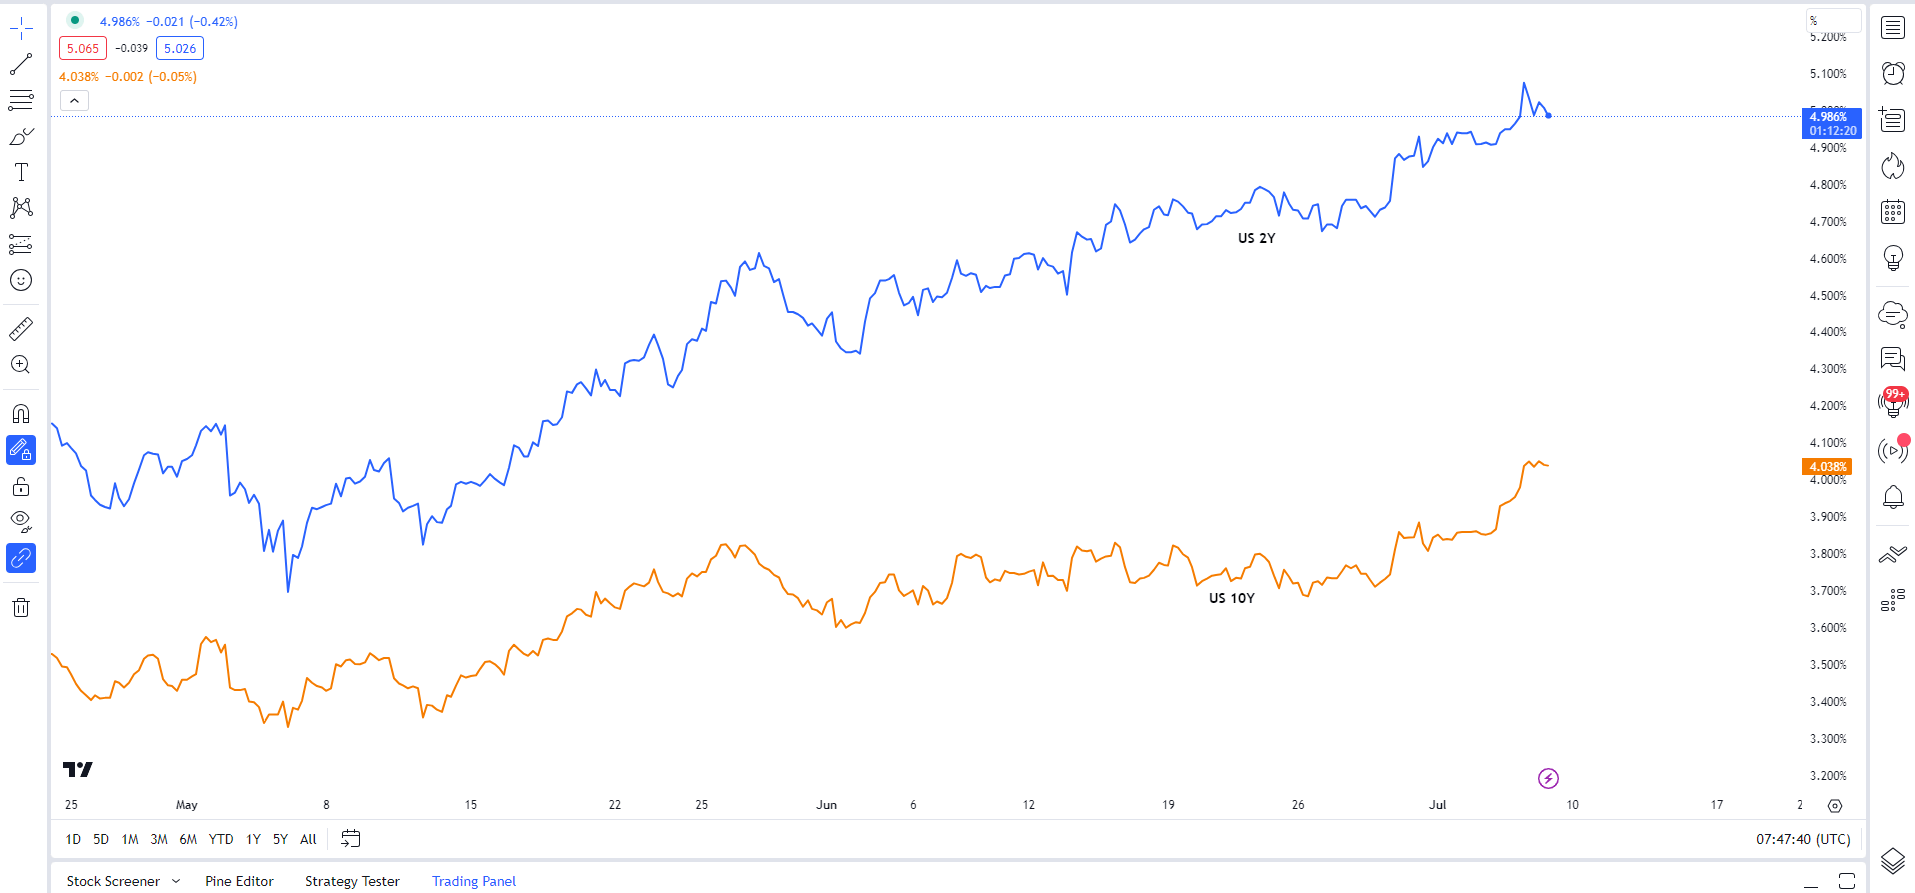
US Yields spiked higher in the aftermath of the data further weighing on gold prices as the US 2Y Yield briefly traded around the 5.12% mark, the highest since 2007. Despite this however the Dollar for some reason continues to struggle to hold onto gains with whipsaw price action seeming to be the case post data releases.

US 2Y and 10Y Yields

image1.png

Heading into today’s NFP and US jobs data, Gold bears will no doubt be hoping for another forecast beating print to finally inspire a sustained push below the $1900/oz handle. Another positive release for the US economy would undoubtedly see an increase in rate hike bets from market participants and facilitate another spike in both US Yields as well as the Dollar Index (DXY). This would in turn drag Gold prices lower and ensure a 4th successive week of losses for the precious metal.

image2.png

TECHNICAL OUTLOOK AND FINAL THOUGHTS

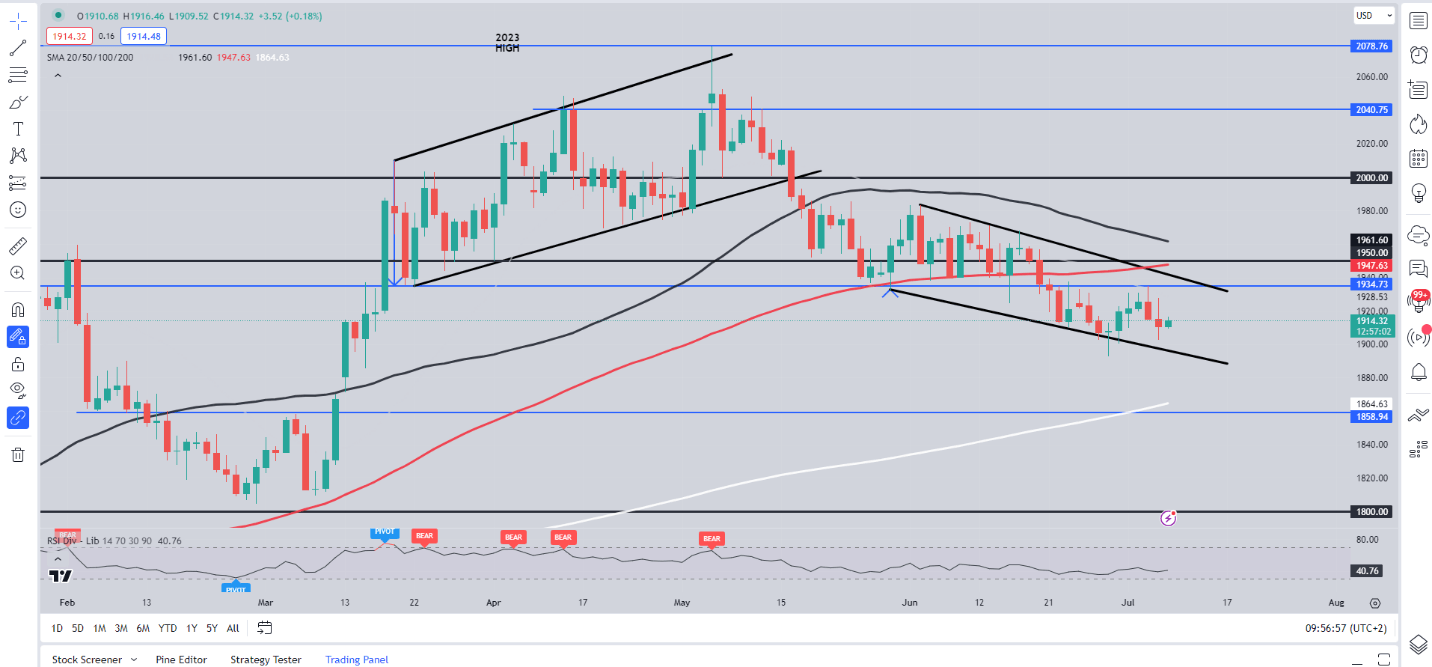
Form a technical perspective, Gold prices remain in a range between the $1890 and $1940 levels with the $1934 proving a tough nut for bulls to crack this week. Gold is currently trading in a bullish flag pattern if you will, which in theory preceded a bullish breakout. However, given the macro picture in play and the expectation of another positive NFP print, a downside breakout begins to look more appealing.

A daily candle close below the $1900 psychological level may finally see Gold make a long-awaited retest of the 200-day MA currently resting around the $1864 handle before a retest of the key $1850 support level comes into focus.

Gold (XAU/USD) Daily Chart – July 7, 2023

image3.png

IG CLIENT SENTIMENT DATA

Taking a look at the IG client sentiment data and we can see that retail traders are currently net LONG on Gold with 74% of traders holding long positions (as of this writing). At DailyFX we typically take a contrarian view to crowd sentiment meaning we could see Gold prices continue to decline following a short upside rally.