Australian Dollar Breaks Range but Lacks Follow Through. Will AUD/USD Reverse?

Australian Dollar Breaks Range but Lacks Follow Through. Will AUD/USD Reverse?

The Australian Dollar remains buoyed on Tuesday despite some soft domestic data. Building approvals for April fell 8.1% month-on-month, below estimates of a 2% rise and -1.0% prior.

The data may support the interest rate markets’ view that the RBA will leave rates unchanged at its monetary policy meeting next week.

AUD/USD TECHNICAL ANALYSIS

AUD/USD broke out of the 0.6565 – 0.6818 range that it had been in for 3 months on its way to making a 6-month at 0.6490 last week.

Prior to piercing the lower edge of that range, the Aussie had several attempts to break the topside but failed. These false breaks can be frustrating for traders trying to play the range.

The run lower also saw the price move below the lower bound of the 21-day Simple Moving Average (SMA) based Bollinger Band.

A break like this is sometimes viewed as a volatility breakout and the price action following such a move can provide clues for near-term direction.

If the price remains outside the band, it might suggest that momentum is evolving in that direction, in this case, bearishness.

However, a close back inside the band may indicate that there is a pause in the bear run or a possible reversal. AUD/USD closed back inside the band on Friday and saw modest gains to start this week.

What is clear is that realised volatility has increased as evidenced by the widening of the Bollinger Band.

Looking at the 1-month At-The-Money (ATM) implied volatility options price, the market has barely moved, currently trading a touch over 10%. This may suggest that currency markets are not overly concerned with this dip in the Aussie.

Support could be at the recent low of 0.6490. Further down, support may lie at the prior low of 0.6387 and the nearby Fibonacci level of 0.6381. The latter is the 78.6% Fibonacci Retracement of the move from the low of 0.6170 to the peak of 0.7158.

On the topside, resistance could be at the nearby breakpoints of 0.6565 and 0.6575 or the previous peaks of 0.6675 and 0.6710. Further up, the 0.6780 – 0.6820 area might offer a more significant resistance zone with several prior highs and breakpoints.

image1.png


Ahead of Euro Area Inflation: EUR/USD, EUR/GBP, EUR/AUD Price Setups

Ahead of Euro Area Inflation: EUR/USD, EUR/GBP, EUR/AUD Price Setups

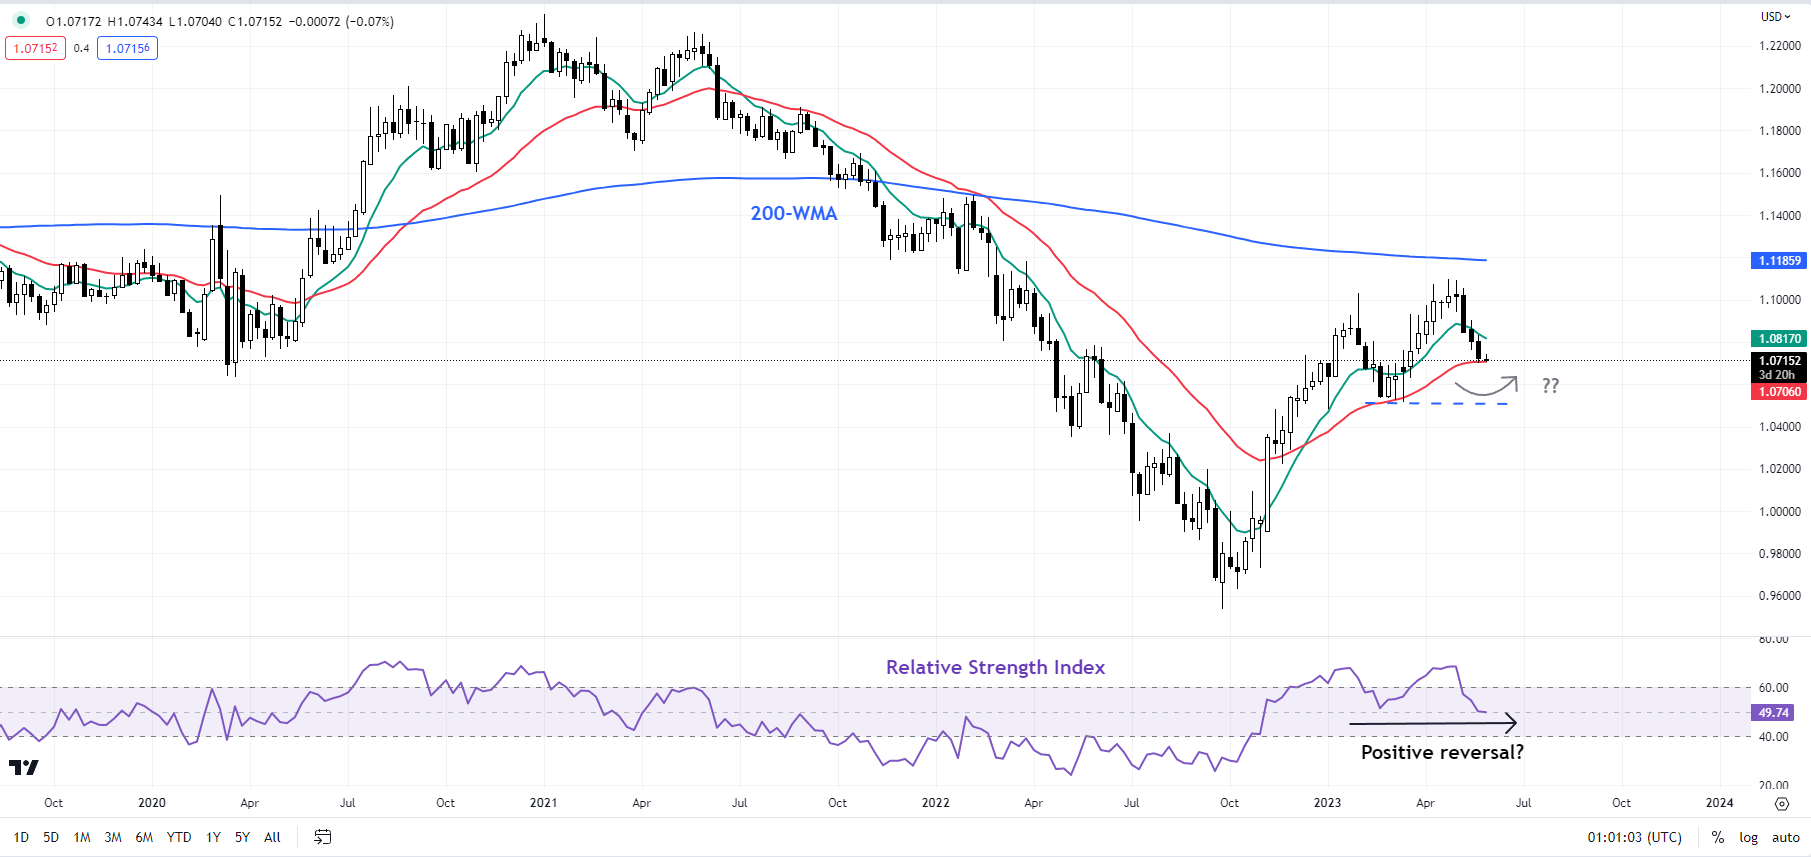
The euro is beginning to look a bit oversold at least against the US dollar ahead of key Euro area inflation data, opening the door for a minor rebound. However, the pace and the extent of the fall this month have raised the bar for a sustained move higher in the single currency.

Overbought conditions, stretched positioning, and hawkish repricing in US rates triggered a pause in the euro’s two-month rally against the US dollar. See “To What Extent Euro Could Fall? EUR/USD, EUR/GBP, EUR/JPY Price Setups”, published May 16.

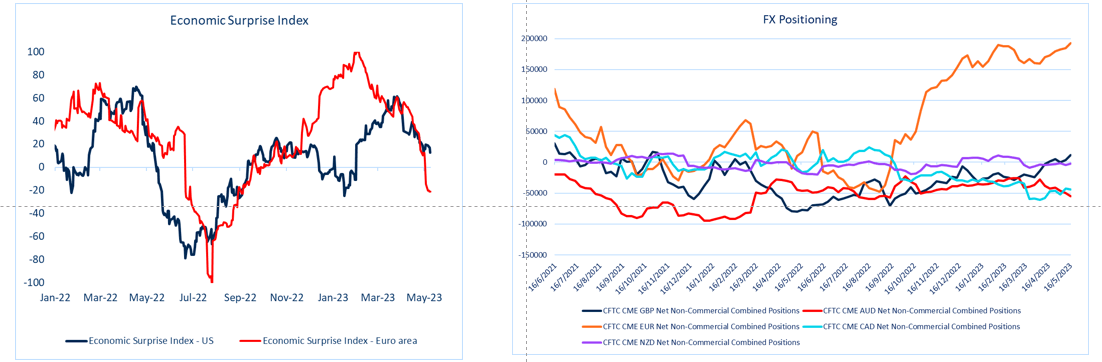
Economic Surprise Index and FX Positioning

image1.png

Source Data: Bloomberg; chart prepared in Microsoft Excel.

While overbought conditions have reversed, positioning remains unchanged. Despite the recent slide, long speculative EUR positioning is running around the highest since 2020 and within the major currency space (see chart), suggesting continued overcrowded conditions for the single currency.

EUR/USD Daily Chart

image2.png

Chart Created by Manish Jaradi Using TradingView; Notes at the bottom of the page.

From a macro perspective, Euro area macro data have been underwhelming, further weighing on EUR. The Economic Surprise Index (ESI) for the Euro area continues to slide, even as the ESI for the US appears to have stabilized recently (see chart). Key focus is now on German inflation data due on Wednesday and Euro area figures on Thursday, and US jobs data on Friday.

EUR/USD Weekly Chart

image3.png

Chart Created by Manish Jaradi Using TradingView

Money markets are pricing in more than two rate hikes while pushing back a peak in rates to December. In this regard, Irish central bank chief Gabriel Makhlouf said last week that more than two ECB rate hikes this year are possible given stubborn inflation. In contrast, markets are pricing in a 63% chance of a 25 bps Fed rate hike at the June meeting up from 25% a week ago, according to the CME FedWatch tool.

EUR/USD Daily Chart

image4.png

Chart Created by Manish Jaradi Using TradingView

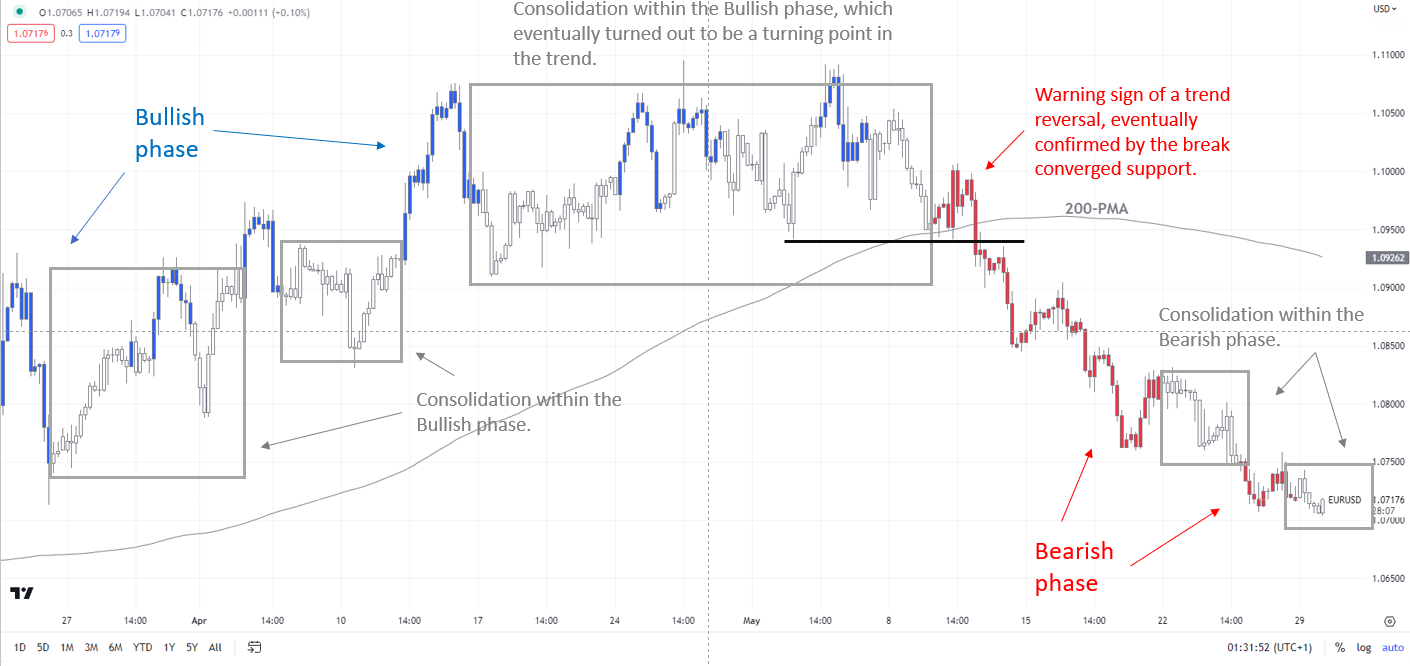
EUR/USD: Short-term trend is down

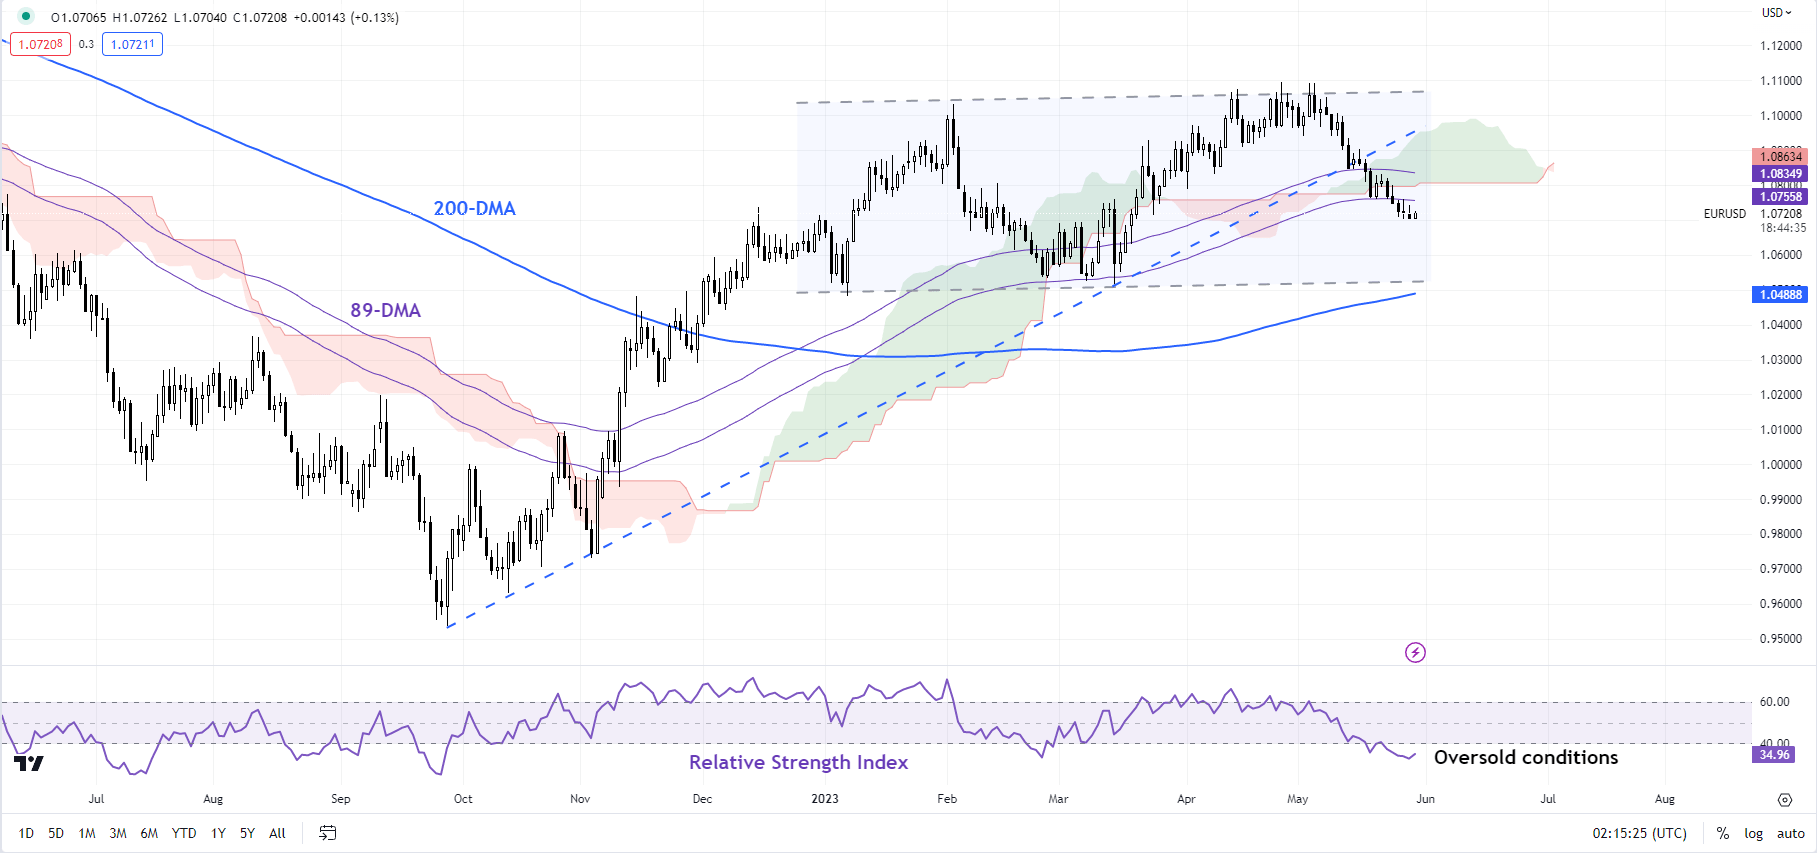
As the colour-coded candlestick 240-minute charts show, based on trending/momentum indicators, EUR/USD is in a bearish phase. However, on the daily charts, EUR/USD has moved to a consolidation phase within the bullish structure that started in late 2022 – a risk highlighted in early May. See “Did ECB Just Put Brakes on Euro’s Rally? EUR/USD, EUR/AUD, EUR/JPY”, published May 5.

EUR/USD’s drop below the lower edge of the Ichimoku cloud on the daily chart is a signal that the upward pressure has faded slightly in the short term. A stronger cushion is at the March low of 1.0510, near the 200-day moving average, which could contain the current downtrend.On the upside, the mid-May high of 1.0900 could pose stiff resistance.

EUR/GBP Daily Chart

image5.png

Chart Created by Manish Jaradi Using TradingView

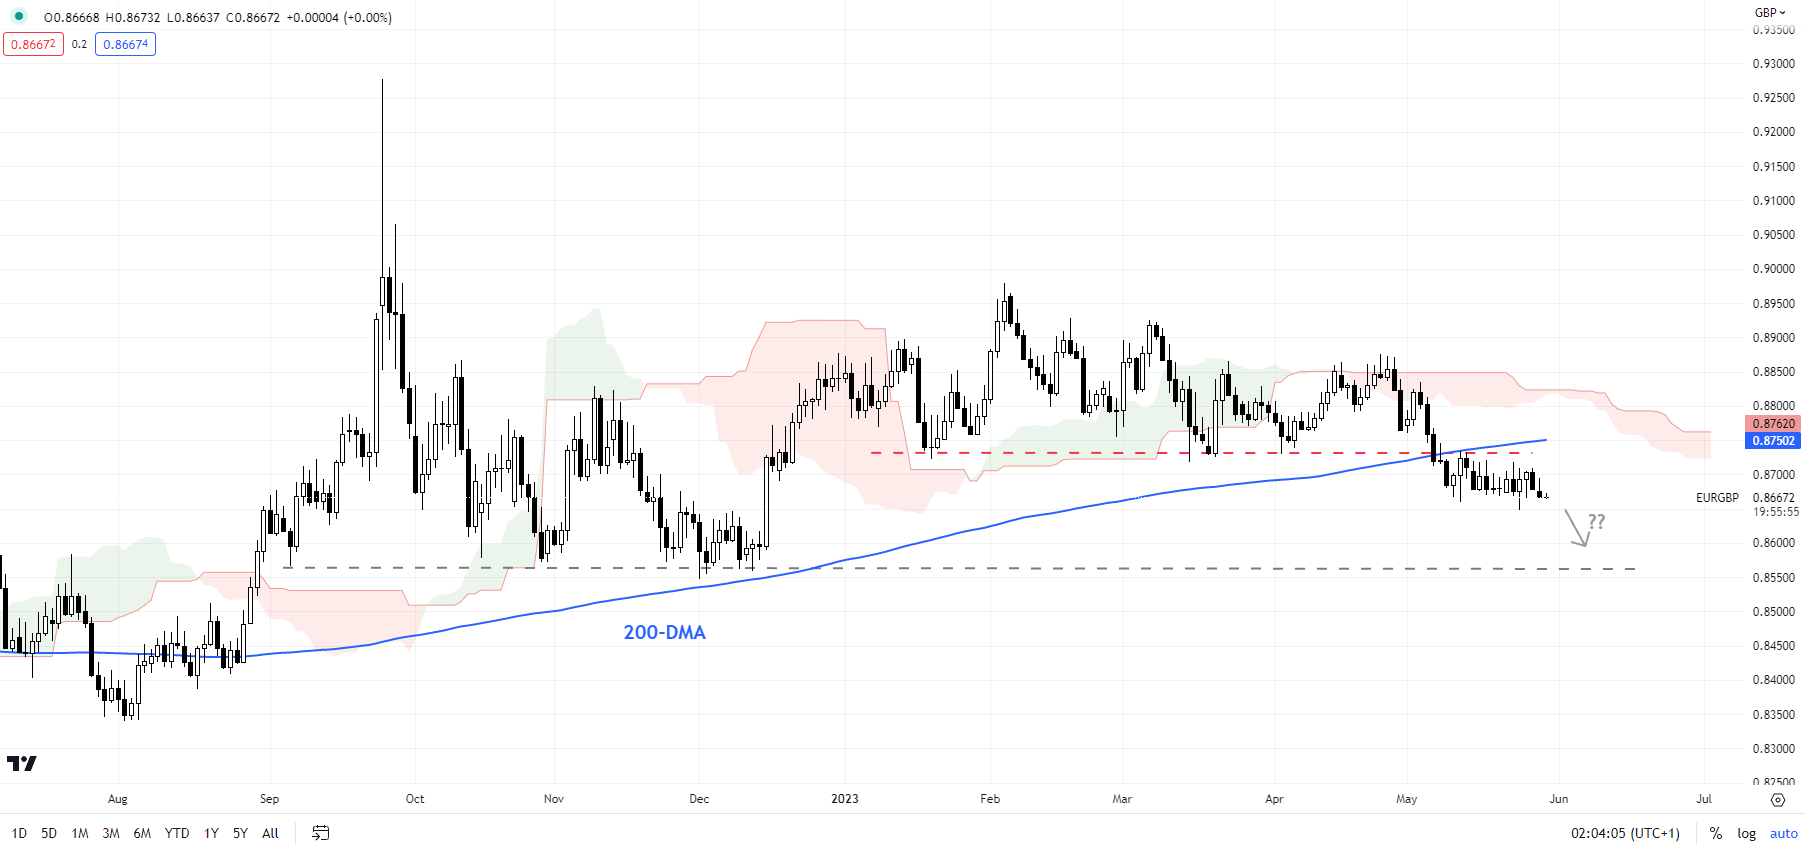
EUR/GBP: Bias remains down

The stall in the downtrend could be a sign of delayed decline, rather than a reversal inEUR/GBP’s fortunes. The cross would need to rise above immediate resistance at 0.8750 for the bearishness to fade. Until then, the bias remains for a move toward the December low of 0.8545.

EUR/AUD Daily Chart

image6.png

Chart Created by Manish Jaradi Using TradingView

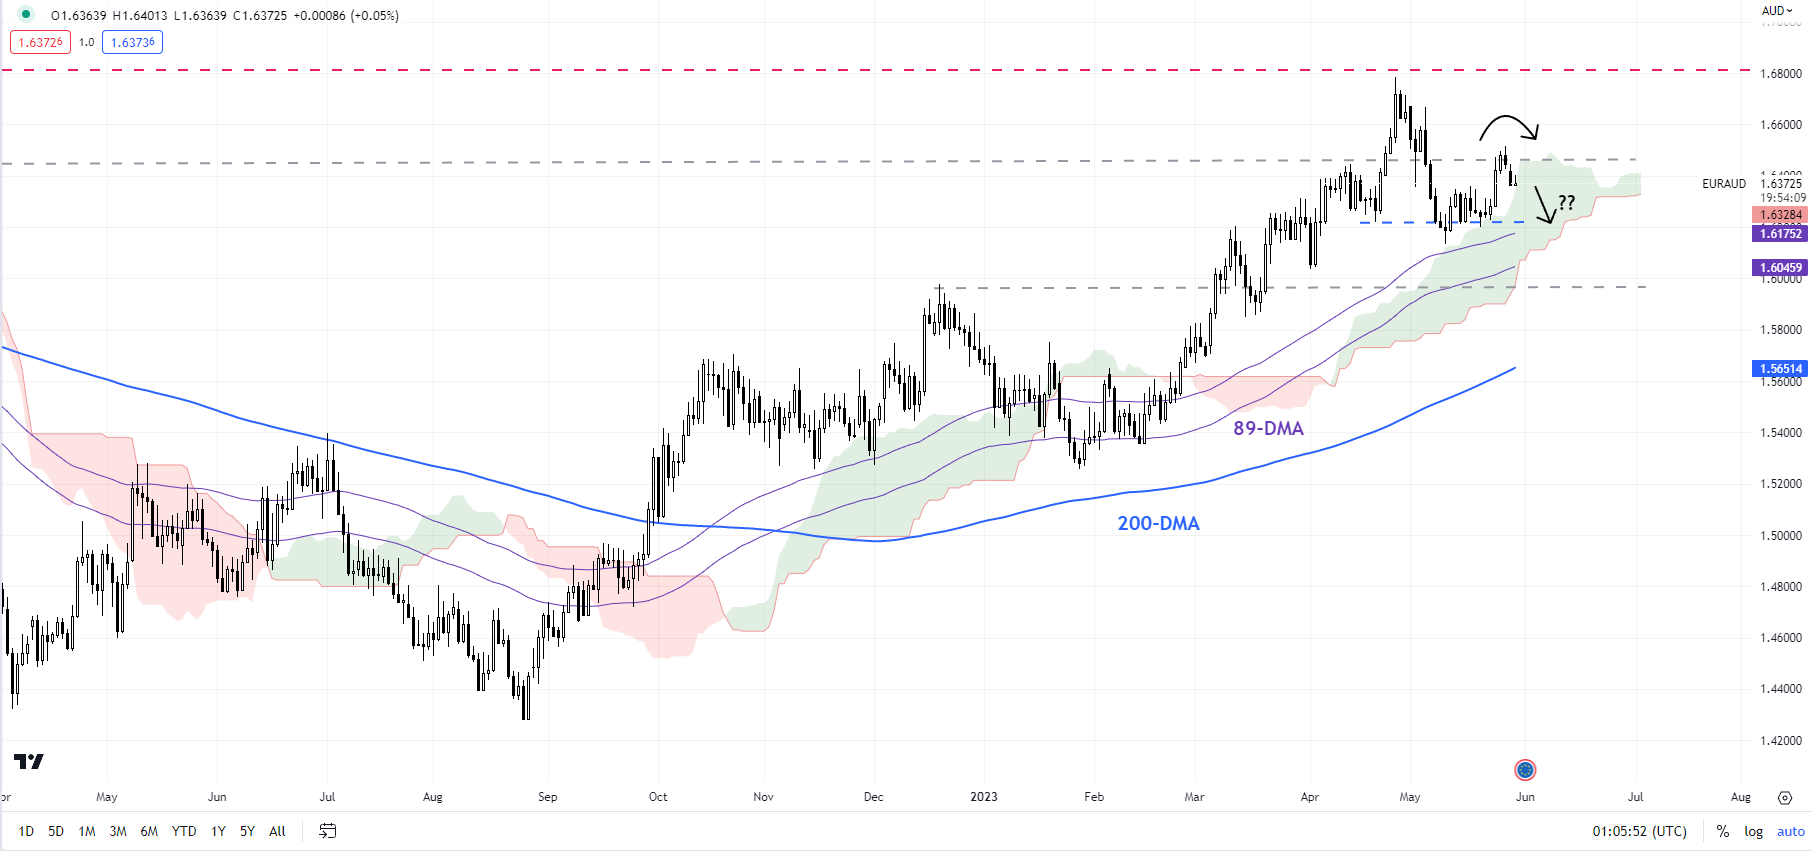
EUR/AUD: Upside could be capped for now

EUR/AUD risks a retest of the 1.5950-1.6050 area (including the December high and the 89-day moving average). This follows a retreat last month from a tough barrier at the October 2020 high of 1.6825. For more discussion see “Australian Dollar Ahead of Budget: AUD/USD, AUD/JPY, EUR/AUD Price Setups”, published May 9.

Note: In the above colour-coded candlestick charts, Blue candles represent a Bullish phase. Red candles represent a Bearish phase. Grey candles serve as Consolidation phases (within a Bullish or a Bearish phase), but sometimes they tend to form at the end of a trend. Note: Candle colors are not predictive – they merely state what the current trend is. Indeed, the candle color can change in the next bar. False patterns can occur around the 200-period moving average, or around a support/resistance and/or in sideways/choppy market. The author does not guarantee the accuracy of the information. Past performance is not indicative of future performance. Users of the information do so at their own risk.

Crude Oil Dips as US Dollar Steadies with a Pending Debt Deal Vote. Where to for WTI?

Crude Oil Dips as US Dollar Steadies with a Pending Debt Deal Vote. Where to for WTI?

The crude oil price slipped on Tuesday but remains within a range despite the prospect of the debt ceiling issue being resolved this week.

It is being reported that US President Joe Biden and House Speaker Kevin McCarthy are actively encouraging lawmakers to vote in favour of the debt ceiling agreement when it is presented to the floor on Wednesday.

Markets have breathed a sigh of relief, most notably at the very short end of the debt market. The T-Bill maturing on the 6th of June is back to where it was prior to the debt ceiling concern alarming markets. It traded as high as 7.10% last week but it is around 5.15% today.

The US Dollar has steadied so far today and has made ground against the Aussie and Kiwi Dollars.

Australian building approvals for April were a big miss at -8.1% month-on-month while Japan’s jobless rate eased lower to 2.6% for the same month, down from 2.8% prior and estimates of 2.7%.

Bank of Japan Governor Kazuo Ueda appeared before Parliament today and said that the ultra-loose monetary policy stance will remain for now but hinted toward a change in tack if inflation was to fall toward 2% later this year.

USD/JPY has pulled back from yesterday’s 6-month peak, trading near 140 at the time of going to print.

The geopolitical space remains somewhat murky this week with China declining an invitation from Washington for their respective defence ministers to meet.

APAC equity indices are generally in the red although South Korea’s KOSPI index is in the green. Wall Street futures are pointing toward a slightly positive start to their cash session as they return from yesterday’s Memorial Day holiday.

Crude oil market traders are starting to focus on the OPEC+ meeting that will start on June 4th.

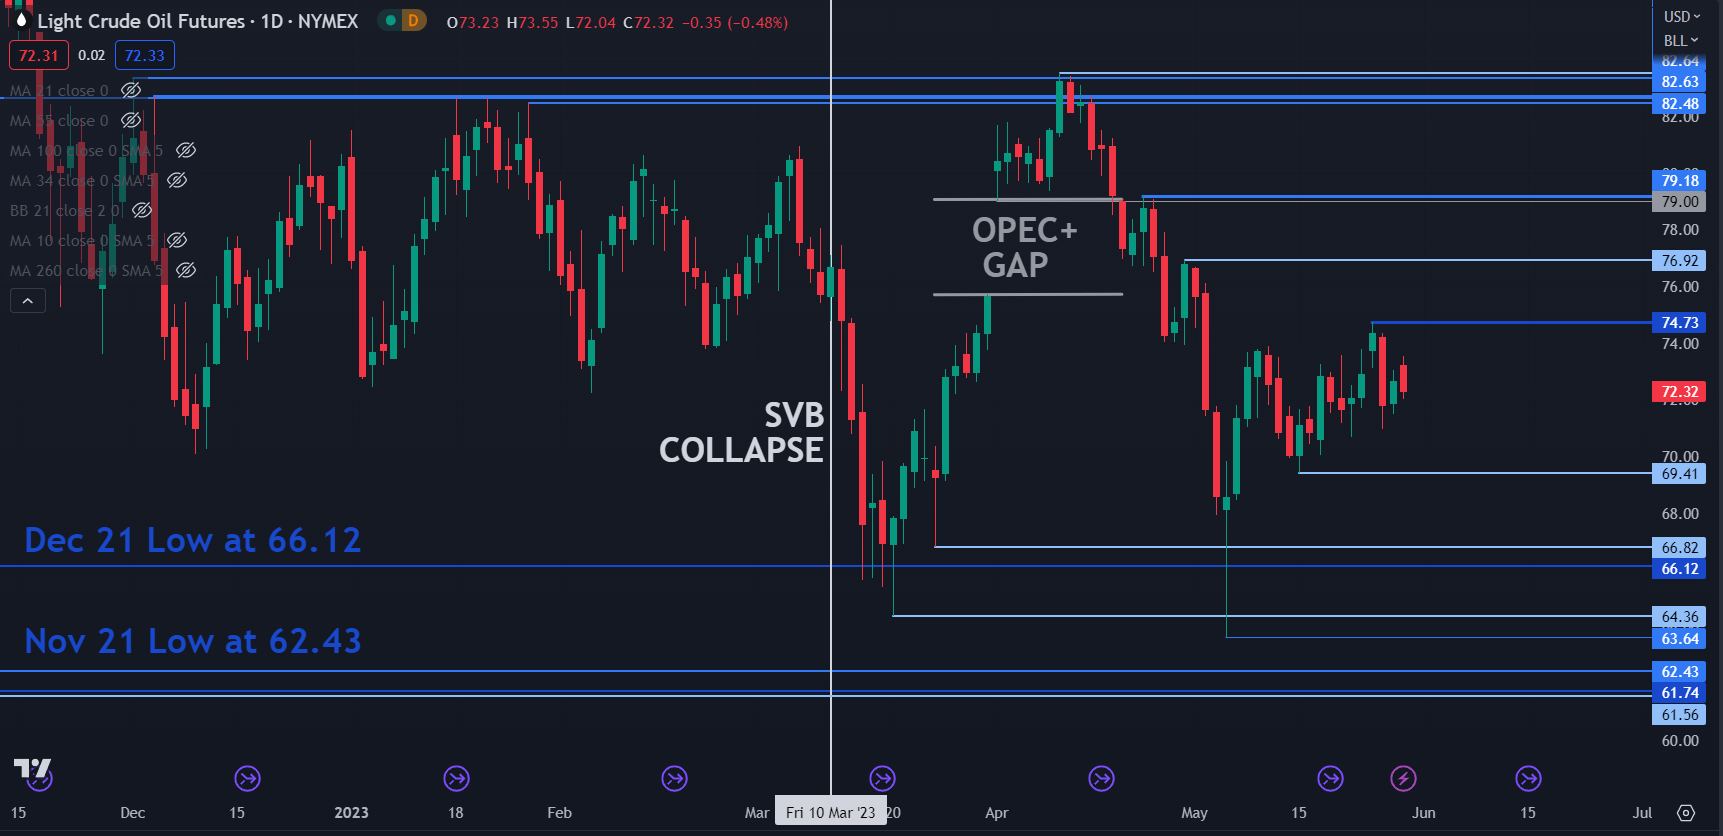
There have been some mixed messages from member states but there is speculation that another cut in production might be in the offering. When they cut in early April, the oil price gapped higher. See the chart below.

Today, the WTI futures contract is under US$ 72.50 bbl while the Brent contract is a touch above US$ 76.50 bbl. Elsewhere, spot gold is slightly softer, trading near US$ 1,940.

Looking ahead, after Swiss GDP figures, the Eurozone and the US will see consumer confidence data.

WTI TECHNICAL ANALYSIS

WTI crude oil has remained in a 69.41 – 74.73 range for three weeks which is well within the broader range seen over the last six months.

This range trading environment has been tricky for traders with several false breaks. That is when a new high or low is made, only for the price to abruptly move back inside the range.

Resistance could be at the prior peaks of 74.73, 76.92 and 79.18. On the downside, support might be at the previous lows of 69.41, 66.82, 66.12, 64.36, 63.64 and 62.43.

image1.png

Chart created in TradingView

Bitcoin & Ethereum Week Ahead: Upside Capped For Now?

Bitcoin & Ethereum Week Ahead: Upside Capped For Now?

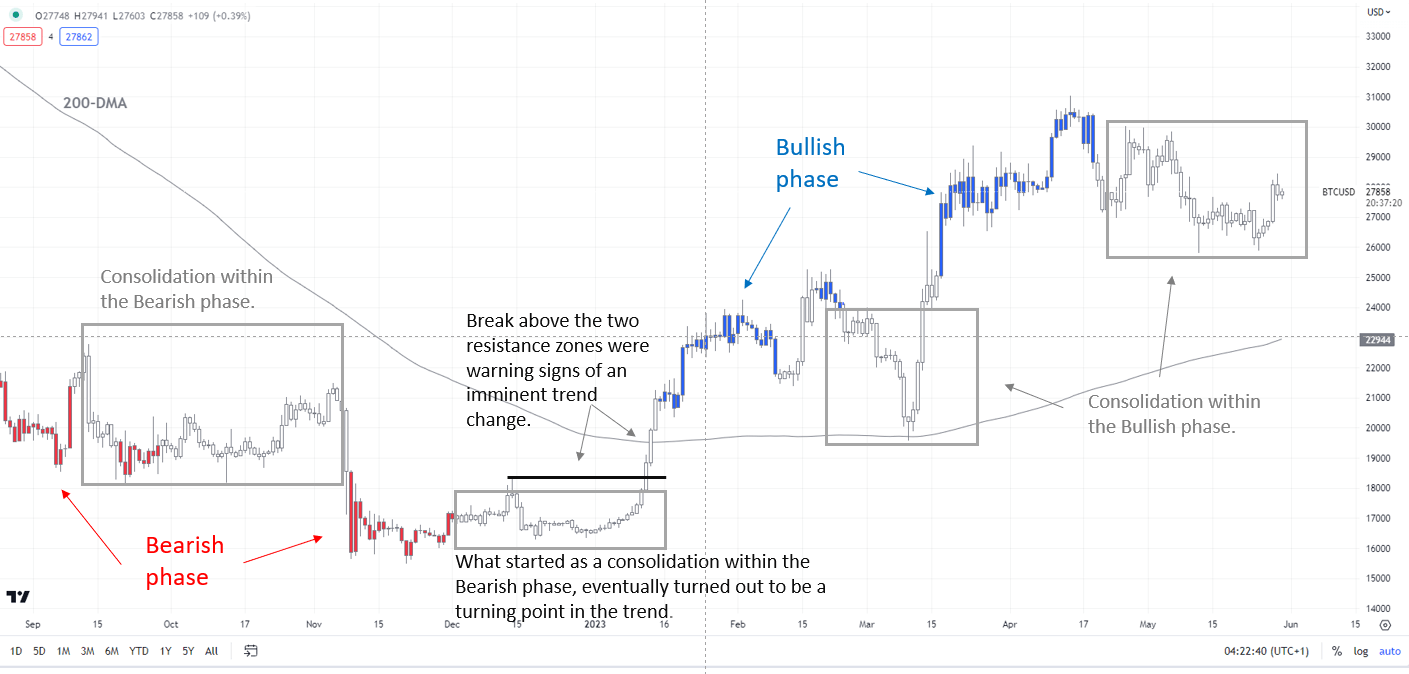
Developments on higher timeframe charts suggest the recent rebound is not a sign of the resumption of the multi-week uptrend. Indeed, chances are that cryptocurrencies could be settling in a range in the interim.

BTC/USD Daily Chart

image1.png

Chart Created by Manish Jaradi Using TradingView

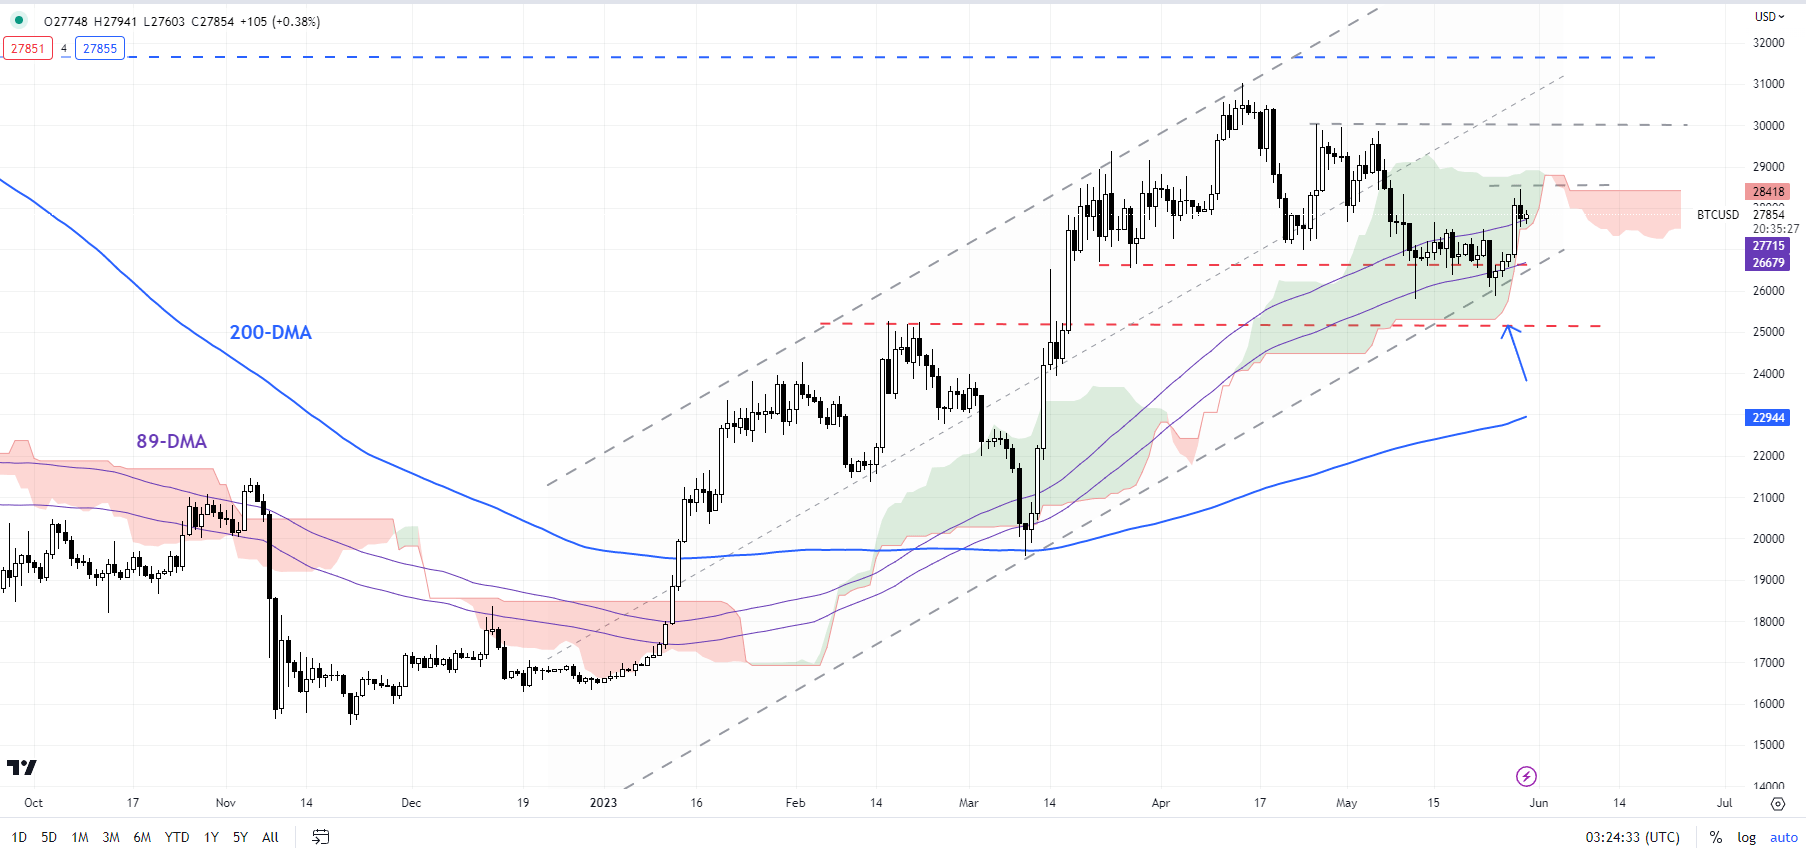
BITCOIN: Consolidation within the uptrend

BTC/USD has managed to hold above quite strong converged support around 25300-26000 (including the 89-day moving average and the February 2023 high), highlighted in the previous update. See “Bitcoin & Ethereum Week Ahead: Cracks in the Rally?”, published May 15. The rise on Monday above the initial cap at the mid-May high of 27675 has reduced the downward pressure somewhat. However, unless BTC/USD clears the 30000 mark, the path of least resistance is sideways to slightly down.

BTC/USD Daily Chart

image2.png

Chart Created by Manish Jaradi Using TradingView; Refer to notes at the bottom

As highlighted in the previous update, the broader trend in BTC/USD remains bullish, notwithstanding the recent consolidation, as the colour-coded candlestick charts based on trending/momentum indicators show (first highlighted in January – see “Bitcoin Technical Outlook: BTC/USD Turns Bullish”, published January 18). Subsequently, the early May update outlined the prospects of some softness in cryptocurrencies. See “Bitcoin & Ethereum Price Action: Is the Rally Over?” published May 8.


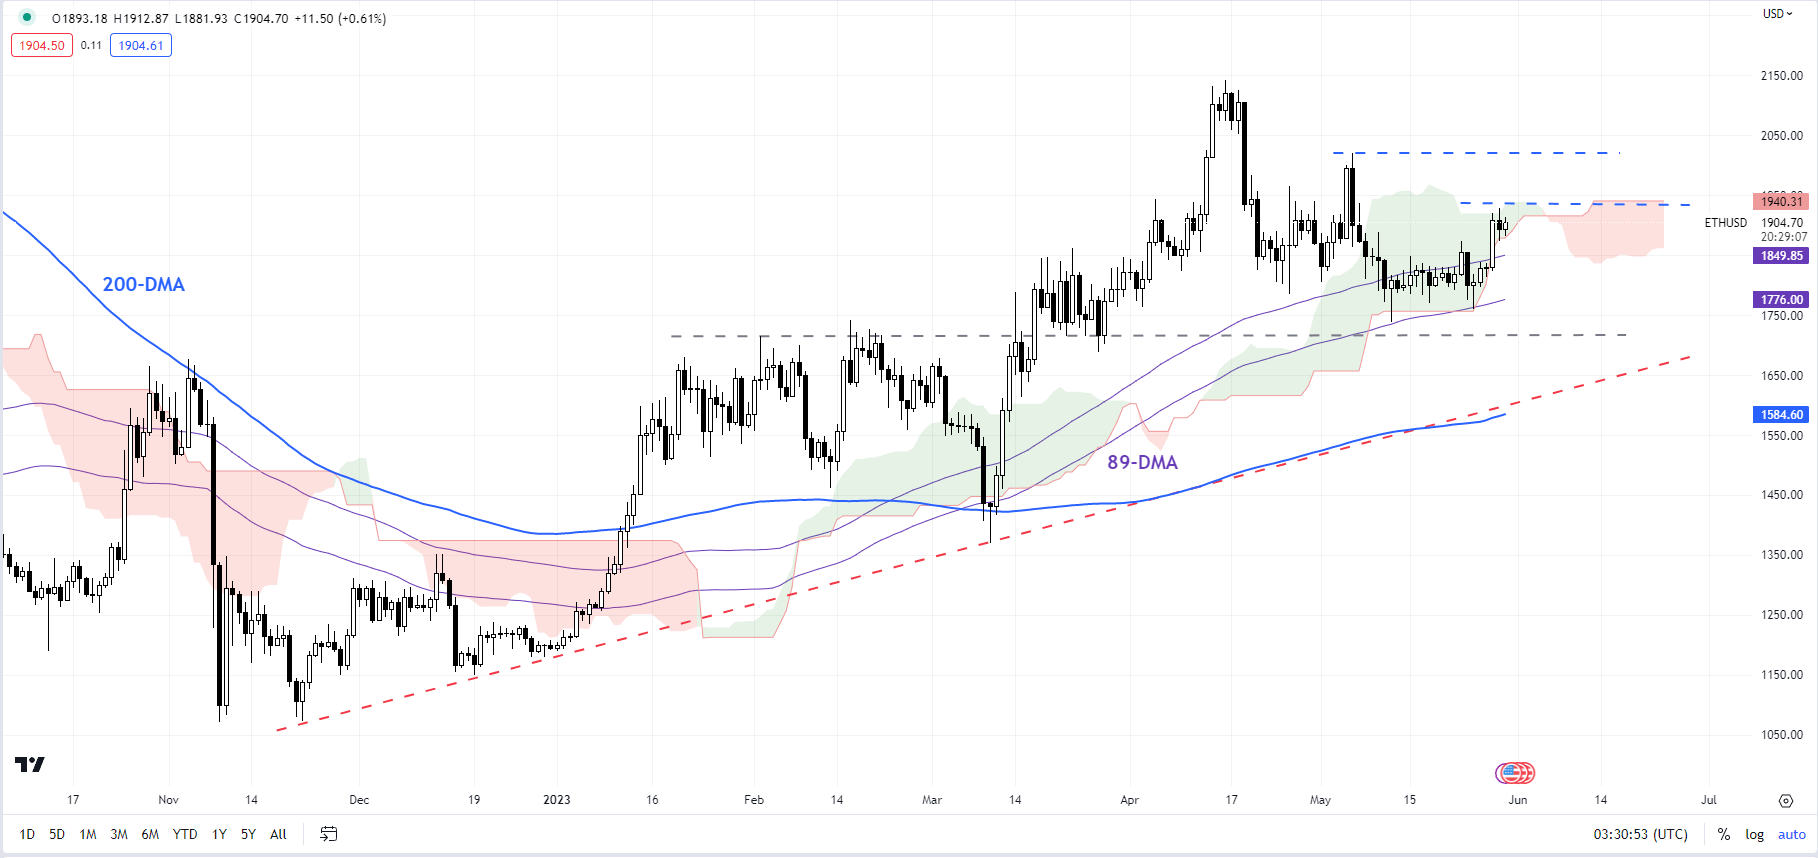
ETH/USD Daily Chart

image3.png

Chart Created by Manish Jaradi Using TradingView

ETHEREUM: An extended consolidation?


ETH/USD has crossed above the immediate hurdle at last week’s high of 1872, suggesting that the downward pressure has eased a bit. However, ETH/USD needs to break above the May 6 high of 2019 for the downside risks to be eliminated.

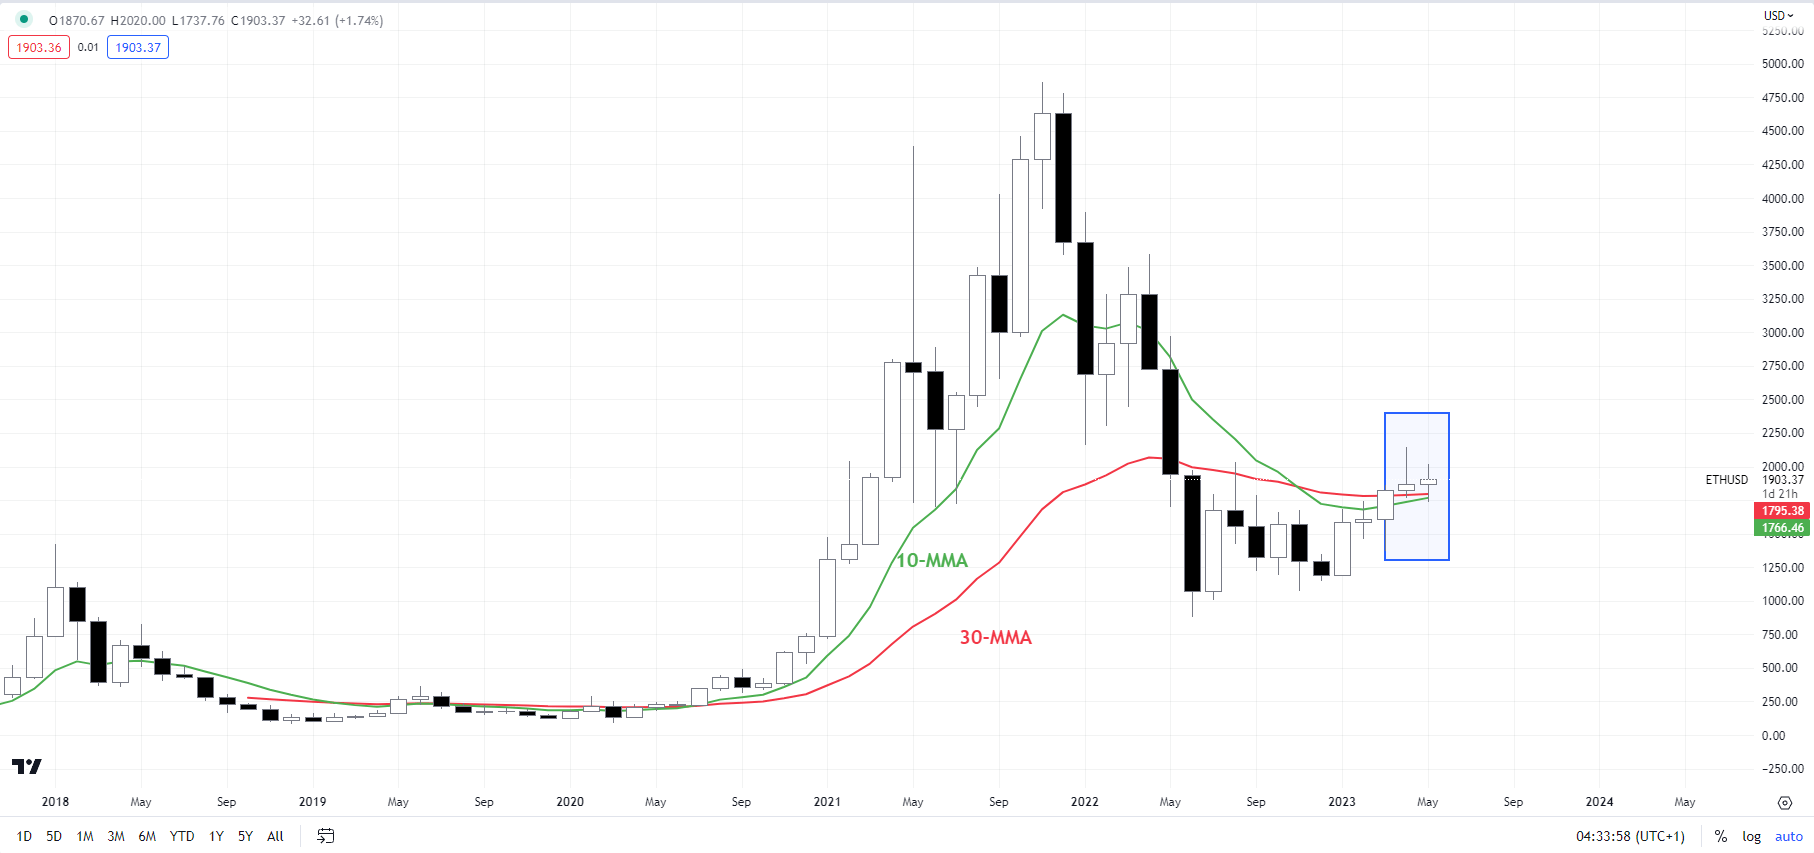
ETH/USD Monthly Chart

image4.png

Chart Created by Manish Jaradi Using TradingView; Refer to notes at the bottom

ETH/USD has so far held above crucial cushion at the February highs of 1710-1740 (including the 89-day moving average) amid a broader bullish outlook. However, ETH/USD’s fall earlier this month below horizontal trendline support at 1780 could be the start of a broader consolidation/sideway range. Moreover, on the monthly charts, ETH made a lower low this month compared with the April low, suggesting a soft bias.

Note: In the above colour-coded candlestick charts, Blue candles represent a Bullish phase. Red candles represent a Bearish phase. Grey candles serve as Consolidation phases (within a Bullish or a Bearish phase), but sometimes they tend to form at the end of a trend. Note: Candle colors are not predictive – they merely state what the current trend is. Indeed, the candle color can change in the next bar. False patterns can occur around the 200-period moving average, or around a support/resistance and/or in sideways/choppy market. The author does not guarantee the accuracy of the information. Past performance is not indicative of future performance. Users of the information do so at their own risk.

GBP/USD Price Forecast: Pound Faces Uphill Battle Despite Debt Ceiling Optimism

GBP/USD Price Forecast: Pound Faces Uphill Battle Despite Debt Ceiling Optimism

GBPUSD FUNDAMENTAL BACKDROP

The British pound currently reflects the external environment as the US debt ceiling theme holds sway. Although there has been some progress by way of a deal, uncertainty has crept back in to global markets as several Republicans have stated that they would resist the deal within the Republican dominated House. That being said, the majority seem to be in favor of a successful passing of a deal through but markets remain cautious for now.

Interest rate probabilities for the Bank of England (BoE) reflect roughly 100bps in cumulative hikes by year end whereas the Federal Reserve has been ‘hawkishly’ repriced to of recent giving the USD added support. From a UK perspective, the below seems slightly optimistic from money markets leaving the pound exposed to further weakness against the greenback.

BANK OF ENGLAND INTEREST RATE PROBABILITIES

image1.png

Source: Refinitiv

The economic calendar is very much US centric and will be focused on the CB consumer confidence. If forecasts are accurate, this could be the first reading since July 2022 below 100 (a benchmark based on levels of optimism in 1985). The week ahead should add more clarity to the US economic outlook with Non-Farm Payroll (NFP) data being the focal point.

ECONOMIC CALENDAR

image2.png

TECHNICAL ANALYSIS

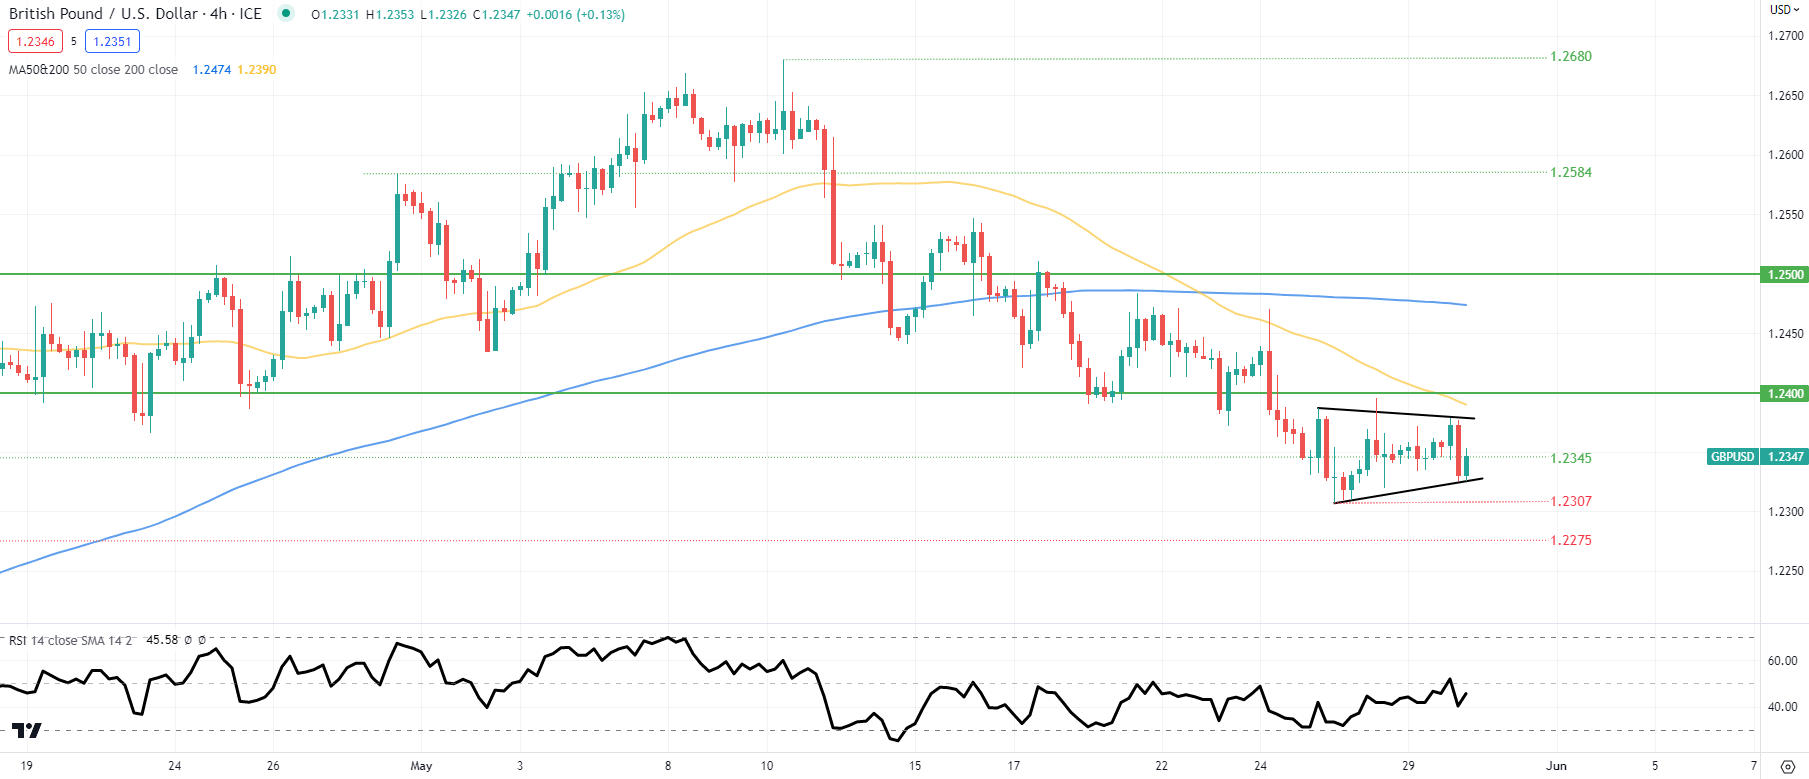
GBP/USD 4-HOUR CHART

image3.png

Chart prepared by Warren Venketas, IG

The 4-hour cable chart shows a clearer view of the short-term picture facing GBP/USD traders. There is a definitive consolidation of recent forming a pennant chart pattern. More specifically, a bearish pennant due to the preceding downside trend. With prices trading below both moving averages as well as the Relative Strength Index (RSI) under the midpoint, momentum favors more downside to come. A break below pennant support could spark a move lower while a close above pennant resistance will likely invalidate the pattern.

Key resistance levels:

  • 1.2400
  • 50-day MA (yellow)
  • Pennant resistance
  • 1.2345

Key support levels:

  • Pennant support
  • 1.2307
  • 1.2275

BEARISH IG CLIENT SENTIMENT

IG Client Sentiment Data (IGCS) shows retail traders are currently net LONG on GBP/USD with 57% of traders holding long positions (as of this writing). At DailyFX we typically take a contrarian view to crowd sentiment resulting in a short-term downside disposition.

As China and the U.S. redefine geopolitics, Europe faces a win-win situation

As China and the U.S. redefine geopolitics, Europe faces a win-win situation

As the United States look at disengaging from China, Europe could soon find itself in a sweet spot.

U.S. President Joe Biden has, for most of his term so far, adopted a harsh tone on China, calling the world’s second-largest economy the most serious competitor to America. Diplomatic dialogue between the two hit a rockier patch earlier this year when Washington accused Beijing of using a spy balloon to obtain intelligence from U.S. military sites.

“The U.S.′ hawkish policy stance towards China means that China needs to improve relations with Europe to mitigate the impact of export controls. Therefore, China has an incentive to work hard on improving EU relations,” Anna Rosenberg, head of geopolitics at Amundi Institute, told CNBC via email.

Officials in Europe have adopted a slightly different approach from the Biden administration, preferring to take a softer stance with Beijing, recognizing its importance to the European economy. Data from Europe’s statistics office shows that China was the third largest buyer of European goods during 2021.

“The EU is in a very different situation than the U.S., which is clearly pursuing policy-led disengagement with China,” Jacob Kirkegaard, a nonresident senior fellow at the Peterson Institute for International Economics, said via email.

“Viewed from China, the EU is the most important high-income market that it still has largely unfettered access to. This in turn makes it far less likely that China will actively try to limit trade with the EU,” he said, adding China “has quite a lot to lose from a trade war with the EU.”

European Commission President Ursula von der Leyen has, in recent months, pushed for a policy of de-risking from Beijing — reducing dependency on the country in critical sectors such as raw materials and semiconductors. However, European officials aren’t anywhere near supporting a total breakup in economic and diplomatic ties.

“The political need to de-risk the EU-China relationship is completely different from US-China relations. In a world characterized by U.S.-China rivalry, the EU is the most important economic partner for both — this gives the EU significant political benefits versus both Beijing and Washington,” Kirkegaard also said.

The EU’s single market, where goods and services move freely across borders, is home to 23 million companies and over 450 million consumers, according to data from the European Council.

“We don’t want to feed the U.S.-China rivalry,” an EU official, who did not want to be named due to the sensitive nature of situation, told CNBC. “We prefer to calm things down … without being naïve,” the same official said.

The American rhetoric toward China eased slightly following a meeting of G7 leaders over the weekend, with Biden warming to the concept of de-risking, rather than completely detaching the two largest economies in the world.

Beijing wouldn’t have relished the idea of G7 leaders coming together to criticize China’s policies. In the wake of the gathering, China imposed a ban on its companies buying from American chipmaker Micron.

Alicia García-Herrero, a senior fellow at European thinktank Bruegel, said Europe might not find itself in an easy position amid these U.S.-China tensions.

“I actually very much doubt that will happen,” she said regarding the prospect of Washington and Beijing both looking to Europe for its economic ties.

“China is taking a lot of retaliation action against Europe in many ways and the sense that Europe is increasingly dependent on China — this kind of strategic dependence for green energy is becoming increasingly clear,” she said, noting Beijing is aware of the leverage it holds as Europe looks to develop a more sustainable economy. China is the largest supplier of several critical raw materials in the world, according to a study published by the European Commission, which are used in products like electric vehicles.

Japan finance minister says markets should set FX rates after yen weakens

Japan finance minister says markets should set FX rates after yen weakens

TOKYO :Japanese Finance Minister Shunichi Suzuki said on Friday after the yen fell to a six-month low against the dollar that currency rates should be set by markets based on economic fundamentals.

“Currency rates should be determined by markets based on fundamentals,” Suzuki told a news conference after a regular cabinet meeting.

“We will continue to watch market moves closely.”

The Japanese currency earlier weakened beyond 140 yen to the dollar, its lowest since late November.

Suzuki’s remarks were softer than warnings Japanese authorities typically issue when they see yen moves as excessive, suggesting Tokyo is for now taking a cautious approach to the latest slide in the currency.

The yen’s overnight depreciation was far milder than last year’s fall to nearly 152 yen against the dollar, a 32-year low. That prompted currency authorities to step in and warn they would take decisive action to halt the decline.

While a weak yen gives Japan’s exporters a boost, it hurts households and retailers by pushing up the cost of already high raw material imports.

Suzuki declined to comment further on Friday, saying any “careless comment” may cause confusion in the currency market.

When will energy bills fall by and how much? Ofgem price cap to drop £426 below the energy price guarantee – but average home will still pay £2,074

When will energy bills fall by and how much? Ofgem price cap to drop £426 below the energy price guarantee – but average home will still pay £2,074

Households will save £426 a year on their energy bills from this summer, regulator Ofgem says, offering hope to millions struggling with £2,500-a-year tariffs.

However, experts have warned the typical energy bill will likely remain at around £2,000 for the rest of this year, with no further Government energy bill rebates on offer.

The Ofgem price cap will fall in July to £2,074 a year for an average household, the energy regulator said today.

Crucially, this is below the current £2,500 energy price guarantee and so households will finally see their bills fall. We explain what it means for you and your bills.

The energy price cap currently sets energy bill prices for more than 80 per cent of British homes, controlling the maximum level of standard variable rate tariffs.

This has happened as the bulk of households either started off on variable rate deals or rolled off fixed deals onto them, as they were unable to find new better offers due to the energy price spike and collapse in switching.

The energy price cap will be cut from 1 July to £2,074, watchdog Ofgem revealed today. This is a big drop from its current level of £3,280 set from 1 April to the end of June.

But in practice household energy bills are actually capped at £2,500 a year for typical use.

That is due to the Government’s Energy Price Guarantee, which sees the state pick up some of the tab for consumer gas and electricity bills to protect households as the price cap spiked to more than £4,000.

Our calculator lets you work out how much your home will pay for energy when the price cap changes.

Natalie Mathie, energy expert at Uswitch, said: ‘The average household can expect monthly direct debits to be set at £173, although typical seasonal usage may only see you spend £110 a month over the summer.

‘While this is good news, the majority of homes are on standard variable tariffs and now subject to the volatility of price cap changes every three months.’

Since last autumn, the main current Government help for households has been the Energy Price Guarantee, which caps energy bills at £2,500 a year for average use.

Because of this, the Ofgem price cap has been meaningless for most households, unless they use large amounts of energy.

But that is all changing from July, when the energy price cap finally falls below the guarantee level.

The energy price guarantee was due to rise from £2,500 to £3,000 at the start of April but this was pushed back to the start of July in the Spring Budget. That is still due to happen, but the price cap will be below this meaning the rise will have no impact on consumers.

The government’s £3,000 Energy Price Guarantee will last until April 2024, so if prices spike back up consumers should be protected.

The Government has no plans to extend it past that point, meaning households will have to pay full energy bills from next April onwards.

Last year households also got a £400 energy bill rebate, which ended in March 2023 and is not being repeated.

This was applied as a set of six discounts per month of £67 to bills for customers with a standard meter and as vouchers for homes with pre-payment meters.

When will cheap fixed rate deals return?

Historically, the cheapest energy deals have been fixed-rate tariffs, with variable-rate deals normally reserved for households that had reached the end of their cheap tariff and not switched to a new one.

But energy firms all pulled these low-cost fixed deals when energy prices started rising in October 2021, leaving consumers with no choice but variable rates.

Without cheap fixed-rate energy deals, customers are at the mercy of bills dictated by the Ofgem price cap.

But households could still make major savings if energy firms bring back cheaper fixed-rate deals.

Experts believe the falling price of energy could spur providers to relaunch cheaper deals at around the £2,000 mark.

However, this would still only be around the level of the Ofgem price cap for the rest of this year, meaning households might be no better off taking a fixed rate.

Some may like the certainty that this brings but consumers will need to be careful they do not lock in to a fixed deal that later turns out to be uncompetitive, if the price cap declines by more than forecast.

Uswitch’s Mathie said: ‘This is a watershed moment for energy suppliers who can now look to start offering fixed deals again, given the market conditions – and would help to encourage genuine competition in the retail energy market.

‘We see no reason why energy suppliers cannot offer competitive fixed deals around the £2,000 level.’

AUD/USD bounce off six-month low towards 0.6550 on US Dollar’s retreat, ignores Aussie data

AUD/USD bounce off six-month low towards 0.6550 on US Dollar’s retreat, ignores Aussie data

AUD/USD prints the first daily gain in four as it rebounds from the yearly low to 0.6515 heading into Friday’s European session. In doing so, the Aussie pair pays little heed to the downbeat Australian data while cheering the US Dollar’s pullback.

Australia’s Retail Sales growth dropped to 0.0% in April versus 0.2% market forecasts and 0.4% prior.

It should be noted that the US Dollar Index (DXY) retreats from a 2.5-month high to 104.17 by the press time as US policymakers’ inability to clinch a deal on the US debt ceiling extension contrasts with the chatters suggesting a $70.0 billion gap left to be filled by the negotiators to get the much-awaited deal. Recently, US House Speaker Kevin McCarthy announced no agreement on the debt deal, as well as the continuation of talks by saying, “It’s hard. But we’re working and we’re going to continue to work until we get this done.”

An impressive tone of the Federal Reserve (Fed) officials, despite upbeat US data, prods the US Dollar bulls ahead of another round of key statistics.

On a different page, China’s FX intervention and slightly positive mood in the Asia-Pacific region, despite doubts about the Reserve Bank of Australia’s (RBA) hawkish moves, also underpin the AUD/USD pair’s corrective bounce.

That said, the second estimation of the US Annualized Gross Domestic Product (GDP) for Q1 2023 was revised up to 1.3% versus 1.0% first forecasts. Further, the Chicago Fed National Activity Index for April improved to 0.07 from -0.37 prior and -0.02 market estimations. On the same line, Kansad Fed Manufacturing Activity improved to -2 for May compared to -21 previous readings and analysts’ estimations of -11. It’s worth noting that the US Pending Home Sales for April improved on YoY but eased on MoM whereas Core Personal Consumption Expenditures also rose to 5.0% during the preliminary readings versus 4.9% prior.

Following the data, Richmond Fed President Thomas Barkin said, “Fed is in a test and learn situation to determine how slowing demand lowers inflation.” On the different front, Boston Federal Reserve President Susan Collins said on Thursday that the Fed “may be at or near” the time to pause interest rate increases, as reported by Reuters.

Against this backdrop, the US stock futures print mild losses while the Asia-Pacific equities edge higher. Further, the US Treasury bond yields retreat from the multi-day top.

Looking ahead, market sentiment dwindles and allows traders to brace for the key data including the US Durable Goods Orders for April and the Core Personal Consumption Expenditure (PCE) Price Index for the said month, known as the Fed’s preferred inflation gauge.

Technical analysis

A downward-sloping support line from December 2022, close to 0.6495 at the latest, puts a floor under the AUD/USD prices amid an oversold RSI (14). The pair’s recovery, however, remains elusive unless crossing March’s low of around 0.6565.