GBP to USD Forecasts: Sub-$1.23 in View on US Inflation and Fed Bets

GBP to USD Forecasts: Sub-$1.23 in View on US Inflation and Fed Bets

It is a busy Friday session for the GBP/USD. UK retail sales figures for April will be in focus. Following the pickup in core inflation, we expect increased sensitivity to the retail sales figures. A larger-than-expected increase in retail sales would fuel inflationary pressure and give the Bank of England more reason to take a more hawkish policy outlook.

While the retail sales figures will influence, market sentiment toward the US debt ceiling crisis will remain the key driver.

Trading Derivatives carries a high level of risk to your capital and you should only trade with money you can afford to lose. Trading Derivatives may not be suitable for all investors, so please ensure that you fully understand the risks involved, and seek independent advice if necessary. A Product Disclosure Statement (PDS) can be obtained either from this website or on request from our offices and should be considered before entering into a transaction with us. Raw Spread accounts offer spreads from 0.0 pips with a commission charge of USD $3.50 per 100k traded. Standard account offer spreads from 1 pips with no additional commission charges. Spreads on CFD indices start at 0.4 points. The information on this site is not directed at residents in any country or jurisdiction where such distribution or use would be contrary to local law or regulation.

Investors should also consider central bank chatter today and the reaction to the inflation and retail sales numbers. However, with no Monetary Policy Committee members on the calendar to speak today, commentary with the media would move the dial.

GBP to USD Price Action

This morning, the GBP/USD was up 0.06% to $1.23282. A mixed start to the day saw the GBP/USD fall to an early low of $1.23109 before rising to a high of $1.23365.

GBP to USD finds early support.

Technical Indicators

Resistance & Support Levels

R1 – $ 1.2369 S1 – $ 1.2291
R2 – $ 1.2418 S2 – $ 1.2260
R3 – $ 1.2497 S3 – $ 1.2181

The Pound needs to move through the $1.2339 pivot to target the First Major Resistance Level (R1) at $1.2369 and the Thursday high of $1.2387. A return to $1.2350 would signal an extended breakout session. However, the Pound would need economic indicators and US debt ceiling-related news to support a breakout session.

In the event of an extended rally, the GBP/USD would likely test the Second Major Resistance Level (R2) at $1.2418. The Third Major Resistance Level sits at $1.2497.

Failure to move through the pivot would leave the First Major Support Level (S1) at $1.2291 in play. However, barring another risk-off-fueled sell-off, the GBP/USD should avoid sub-$1.2250. The Second Major Support Level (S2) at $1.2260 should limit the downside. The Third Major Support Level (S3) sits at $1.2181.

GBP to USD support levels in play below the pivot.
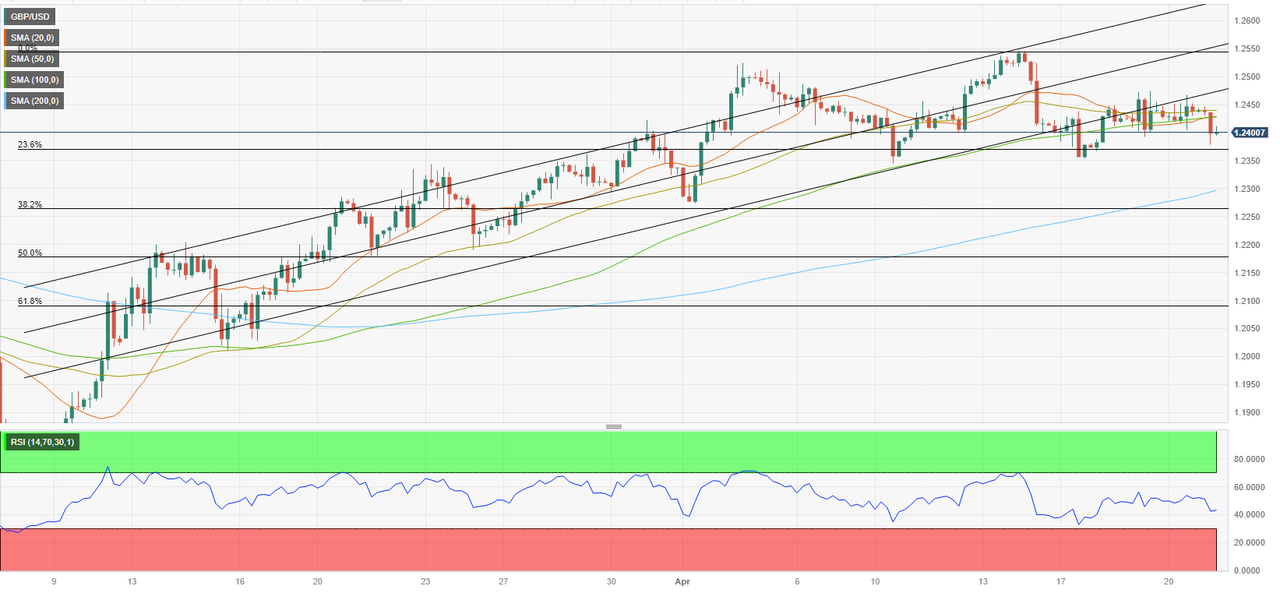
GBPUSD 260523 Hourly ChartLooking at the EMAs and the 4-hourly chart, the EMAs send bearish signals. The GBP/USD sits below the 50-day EMA, currently at $1.24204. The 50-day EMA pulled back from the 200-day EMA, with the 100-day EMA narrowing to the 200-day EMA, delivering bearish signals.

A move through R1 ($1.2369) would give the bulls a run at R2 ($1.2418) and the 50-day EMA ($1.24204). However, failure to move through the 50-day EMA ($1.24204) would leave S1 ($1.2291) in view. A move through the 50-day EMA would send a bullish signal.

EMAs are bearish.
GBPUSD 260523 4-Hourly Chart

The US Session

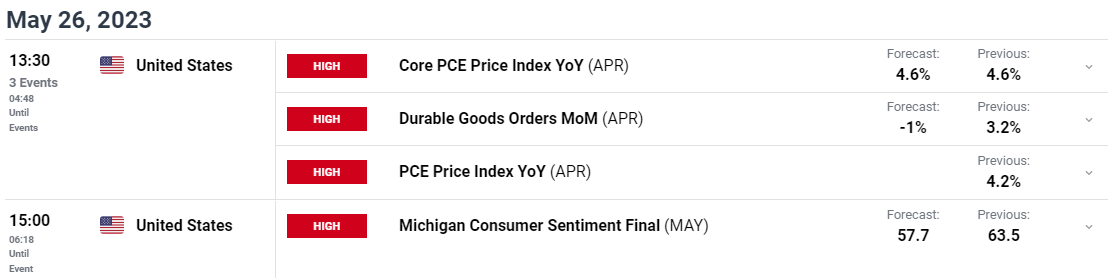
Looking ahead to the US session, it is a busy day on the US economic calendar. Core durable goods orders, Core PCE Price Index, personal spending/income, and Michigan consumer sentiment numbers will be in focus.

We expect the Core PCE Price Index numbers to have the most impact. Sticky inflation would fuel bets of a 25-basis point Fed interest rate hike in June and ease expectations of an H2 interest rate cut.

Economists forecast the Core PCE Price Index to increase by 4.6% year-over-year in April versus 4.6% in March.

According to the CME FedWatch Tool, the probability of a 25-basis point Fed interest rate hike in June jumped from 36.4% to 52.2% on Thursday. Better-than-expected labor market and GDP numbers supported the shift in sentiment ahead of today’s inflation numbers.

US: Congress close to deal before breaking for holiday, reports say

US: Congress close to deal before breaking for holiday, reports say

US President Joe Biden says progress has been made in talks with top Republican Kevin McCarthy over the US debt ceiling – even as Congress breaks up for a holiday weekend.

The pair aim to reach a deal on raising the government borrowing limit for two years so it can keep paying its bills.

Investors’ fears of the US defaulting on its debts have grown – despite assurances that talks are progressing.

Mr Biden spoke of “several productive conversations” with Mr McCarthy.

During a White House event on Thursday, the president said his staff remained in conversation with the team of Mr McCarthy, the House speaker – and that the two sides were “making progress”.

He added: “I made clear time and again defaulting on our nation debt is not an option.” He said Americans deserved certainty over issues such as social security payments.

The debt ceiling is a spending limit set by Congress which determines how much money the government can borrow – an issue on which Democrats and Republicans disagree.

With no deal yet struck, the Treasury has warned that the US will not have enough money to pay all of its bills as soon as 1 June.

Analysts say there could be severe economic consequences if the US fails to honour its obligations.

GBP/USD holds gains toward 1.2350 after mixed UK Retail Sales data

GBP/USD holds gains toward 1.2350 after mixed UK Retail Sales data

GBP/USD is holding its recovery gains toward 1.2350 after the UK Retail Sales data came in mixed for April. Cable is advancing as the US Dollar is losing ground amid a correction alongside the US Treasury yields. Focus now shifts toward the US PCE inflation data.

GBP/USD has gained traction early Friday and climbed above 1.2350. Despite the recent rebound, the pair’s technical outlook is yet to signal a reversal. Ahead of the weekend, investors will pay close attention to the Personal Consumption Expenditures (PCE) Price Index data from the US.

Although risk flows returned to markets on Thursday, the US Dollar (USD) preserved its strength with robust US data feeding into the hawkish Federal Reserve (Fed) narrative. The US economy’s annualized growth for the first quarter got revised higher to 1.3% from 1.1% and the Initial Jobless Claims for the week ending May 20 came in at 229,000, much lower than the market expectation of 245,000.

Reflecting the shift in market positioning, the CME Group FedWatch Tool’s probability of a 25 basis points Fed rate hike in June climbed above 40% from nearly 20%.

In the second half of the day, the US Bureau of Economic Analysis will release the PCE Price Index figures for April. Earlier in the week, Federal Reserve Governor Christopher Waller noted that April PCE inflation data will be critical when deciding on the next policy step.

On a monthly basis, core PCE Price Index is forecast to rise 0.3%. A stronger-than-forecast monthly increase, at or above 0.5%, should provide a boost to the US Dollar and cause GBP/USD to turn south ahead of the weekend. On the flip side, a soft print below 0.3% could cause investors to refrain from betting on one more Fed rate hike, at least in the near term, and trigger a downward correction in the US Dollar Index.

Crude Oil Price Retreats on OPEC+ Perspective and a Firm US Dollar. Where to for WTI?

Crude Oil Price Retreats on OPEC+ Perspective and a Firm US Dollar. Where to for WTI?

The crude oil price collapsed overnight with expectations that OPEC+ will stick to its production target and a US Dollar that is shooting for the moon.

Comments from Russian Deputy Prime Minister Novak suggest that the Organization of Petroleum Exporting Countries (OPEC) will not be adjusting its production target at the June 4th gathering.

In an interview with the Russian newspaper Izvestiya, he said that he does not expect any changes to output targets at the forthcoming conclave in Vienna.

His remarks are in stark contrast to comments made by Saudi Arabia Minister of Energy Abdulaziz bin Salman on Wednesday when he warned speculators to ‘watch out’. It seems that the threat had its short-term desired impact with crude jumping higher before tumbling into today’s Asian trading session.

Oil had also been supported by a potential supply squeeze due to wildfires spreading across the Alberta, British Columbia and Saskatchewan provinces in Canada. The situation there has calmed down to some degree although it remains a cause for concern.

The US Dollar has been on the rampage this week and it was somewhat odd that crude had managed to rally in the face of it. Currency markets are contemplating the implications of a US debt ceiling deal being done and the ever-rising Treasury yields.

Treasury yields have lifted all along the curve but most pressing is the 1-year note being only a handful of basis points away from a 23-year high near 5.30%.

Looking ahead, crude might struggle until the outlook for global growth finds firmer footing. Some good economic data out of the US overnight is heading in the right direction but China continues to struggle to gain growth traction since pandemic restrictions were removed.

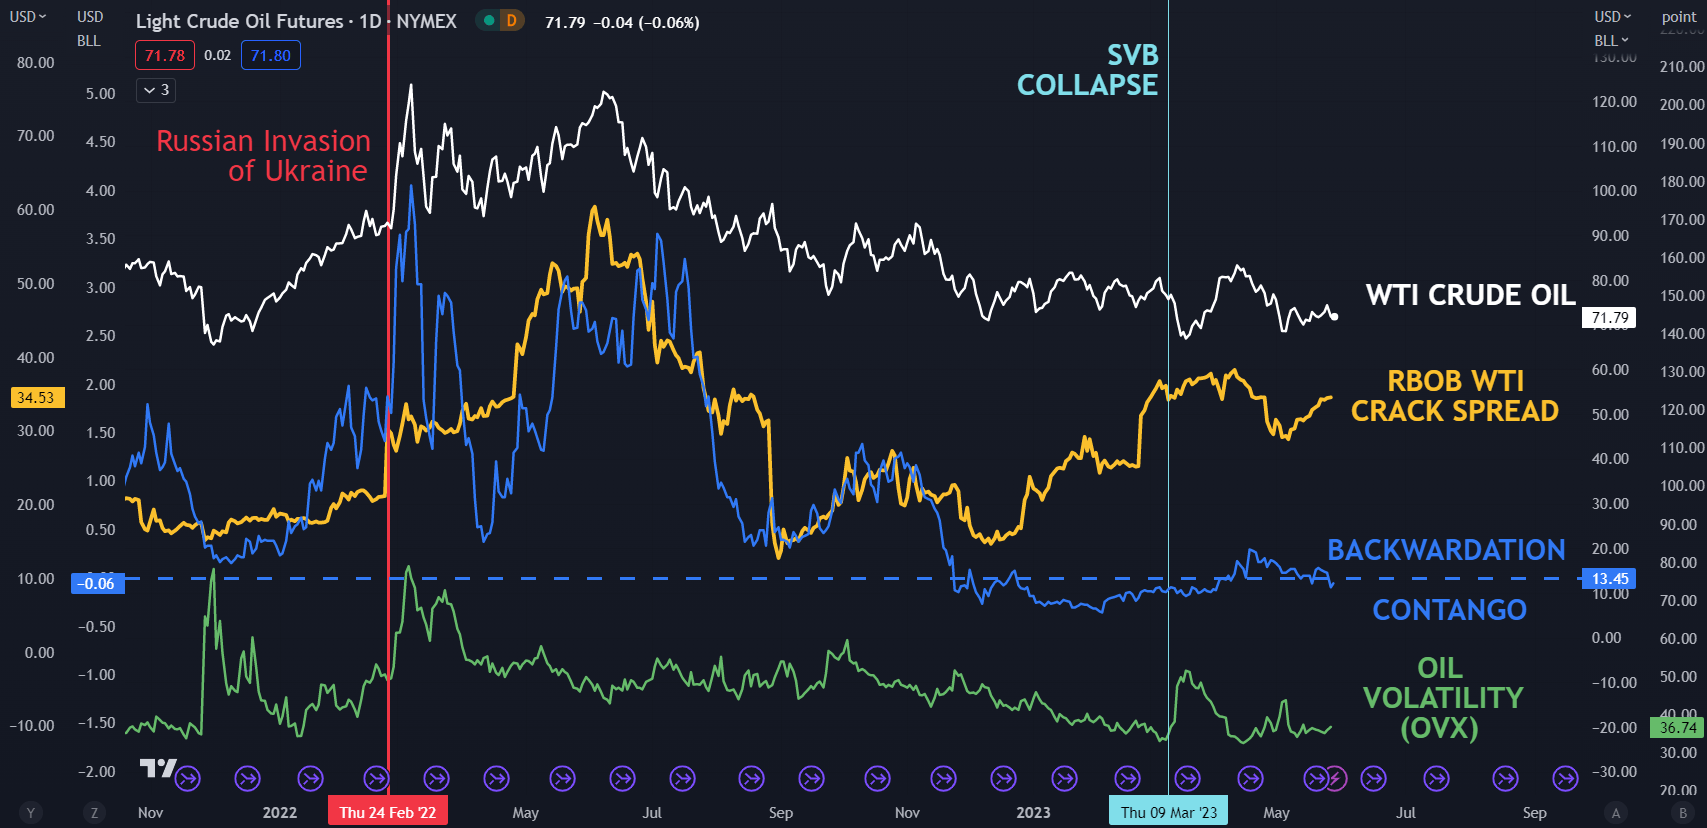
Potentially lending some support to black gold is the RBOB crack spread that has ticked up again this week. The RBOB crack spread is the gauge of gasoline prices relative to crude oil prices and reflects the profit margin of refiners.

RBOB stands for reformulated blendstock for oxygenate blending. It is a tradable grade of gasoline. If profitability increases for refiners, it may lead to more demand for the crude product.

The price action in crude has seen volatility remain relatively low as measured by the OVX index potentially revealing that the market is comfortable with current pricing.

At the same time, the difference in price between the front two WTI futures contracts is relatively benign and could hint toward a degree of balance in the market for now.

WTI CRUDE OIL, CRACK SPREAD, BACKWARDATION/CONTANGO, VOLATILITY (OVX)

image1.png


The Federal Reserve Bank: A Forex Trader’s Guide

The Federal Reserve Bank: A Forex Trader’s Guide

What is the Federal Reserve?

The Federal Reserve is the central bank of the United States. It was founded to create a stable, flexible monetary and financial system for the nation. Its general duties are to set monetary policy and oversee effective economic operation, ultimately serving the public interest.

To meet these top-level directives, the Fed performs five general functions:

  1. Promote maximum employment, stable pricing and moderate interest rates long term
  2. Reduce risk where possible to create a stable financial system
  3. Develop safety within financial institutions
  4. Champion safety within payment and settlement systems
  5. Advocate consumer protection through a supervisory stance.

To execute day-to-day operations, the nation is divided up into 12 Federal Reserve Districts, each of which is served by a separately incorporated Reserve Bank. These districts and member banks operate independently while being supervised by the Federal Reserve Board of Governors.

Who owns the Fed?

The Fed is both a private and public institution. The Board of Governors is a government agency, while the banks themselves are structured like private corporations – member banks hold stock and earn dividends.

Who is the Federal Reserve chairman?

As of August 2019, the chairman of the Federal Reserve is Jerome Powell, who has served in this office since February 5, 2018. He is the 16th person to have held the position and will serve a four-year term. Before his appointment, Mr Powell served as a member of the Board of Governors from May 25, 2012. He also currently serves as Chairman of the Federal Open Market Committee, which looks after monetary policy.

Which banks make up the Fed?

The 12 Federal Reserve Districts, each with their own Reserve Bank, are:

  • Boston
  • New York
  • Philadelphia
  • Cleveland
  • Richmond
  • Atlanta
  • Chicago
  • St. Louis
  • Minneapolis
  • Kansas
  • Dallas
  • San Francisco

How is the Fed held accountable to its functions?

The Fed is accountable to the public, as well as to the US Congress. The Chair and Federal Reserve officials testify in front of Congress, while the system of setting monetary policy is designed to be clear and transparent. In the interests of accountability, the Federal Open Market Committee (FOMC) will publish statements following all annual meetings. All financial statements are audited independently once a year to ensure financial accountability as well.

Key Economic Mandates of the Federal Reserve System

US monetary policy is the core mandate of the Federal Reserve bank. The statutory objectives of this monetary policy are outlined by the Congress and are:

  • Maximum employment: The monetary policy set out by theFOMC should ensure unemployment remains low, working to boost the economy where needed so that businesses thrive, make a profit and hire more staff to grow
  • Price stability: The Fed defines price stability as an inflation rate of 2% in the long term
  • Moderate long-term interest rates: This works alongside price stability – when an economy is stable, long-term interest rates remain at a moderate level

The Fed aims to achieve its monetary policy through its influence over interest rates and the general financial climate. This can lead to volatility of the US Dollar, ahead of Fed announcements and changes to policies.

Federal Open Market Committee

Monetary policy is set by the Federal Open Market Committee (FOMC), which oversees the open market operations of the Federal Reserve System. They set a target for the federal funds rate at FOMC meetings; this is the interest rate that they want banks to offer to each other for overnight loans. While the FOMC doesn’t control the rate, it can influence it in three main ways:

  • Open market operations. This means the buying and selling of government bonds on the open market – selling bonds decreases monetary supply with the aim of increasing interest rates. Buying bonds puts money back into the economy, with the aim of decreasing interest rates
  • Discount rate. This is the rate that banks pay to borrow money from the Fed. When this rate is lower, then it is also more likely the federal funds rate will be lower too
  • Reserve requirements. Banks need to hold a certain percentage of customers’ deposits to cover withdrawals – this is the reserve requirement. When these are raised, banks can’t loan as much money and must ask for higher interest rates. When lowered, banks can loan more money and ask for lower interest rates.

How Does the Federal Funds Rate Affect the US Dollar?

The Fed’s interest rate, also known as the Fed funds rate, is set by the Board of Governors of the Federal Reserve System. The current interest rate and the expectations of future interest rate changes can both affect the value of the US Dollar. If traders anticipate a change in interest rates based on announcements from the Board of Governors, this can cause the Dollar to appreciate or depreciate in value against other currencies.

This table sets out the way in which market expectations and rate changes can affect the value of the dollar:

Market expectations Actual Results Resulting FX Impact
Rate Hike Rate Hold Depreciation of currency
Rate Cut Rate Hold Appreciation of currency
Rate Hold Rate Hike Appreciation of currency
Rate Hold Rate Cut Depreciation of currency

Find out more about the impact of interest rates on the foreign exchange market.

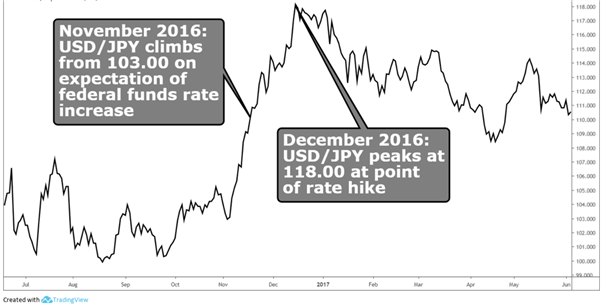
As you can see in the chart below, the Dollar strengthened against the Yen in the leadup to the Fed’s interest rate announcement in December 2016 because it was widely expected that the fed funds rate would increase. The pair peaked at around 118.371 on the day of the announcement, December 14, 2016.

USD/JPY chart before and after Fed hikes in 2016

Chart to show the impact of Fed hikes on USD/JPY

Major Forex Trading Sessions from Around the World

Major Forex Trading Sessions from Around the World

There are three major forex trading sessions which comprise the 24-hour market: the London session, the US session and the Asian session. Each major geographic market center can exhibit vastly unique traits and tendencies that can allow traders to effectively execute strategies at any time.

Although the forex market is the most liquid of all asset classes, there are periods whereby volatility is constant, and others subdued. Understanding these different forex session times can improve the reliability of a forex trading strategy.

In this article, we will explore each of these forex market sessions including their key characteristics – forex time zones and how they affect trading.

forex trading hours

What are the main forex trading sessions?

Customarily, the forex market is divided into three market sessions:

The forex market is seen as highly functional/dynamic during these trading sessions as major banks, institutions and retail traders are operational. Noting the specific times of each trading session will assist forex traders in developing their trading strategies around this data.

SESSION MAJOR MARKET TIME (GMT)
US NEW YORK 13:00 – 22:00
ASIAN TOKYO 00:00 – 09:00
EUROPEAN LONDON 08:00 – 17:00

forex session times

Asian trading session

Tokyo is the first forex session to open, and many large participants use the trade momentum In Asia to develop their strategies and utilise as a gauge for future market dynamics. Approximately 6% of the world’s FX transactions are enacted in the Asian trading session.

European trading session

London is the largest and most important forex trading session in the world, with roughly a 34% market share of the daily forex volume. Most of the world’s largest banks keep their dealing desks in London because of the market share. The large number of participants in the London forex market and the high value of the transactions makes the London session more volatile than the other two forex sessions.

The onslaught of liquidity coming in from London can greatly increase the ‘average hourly move’ of major currency pairs such as EUR/USD. The chart below illustrates this statistic based on the time of day – notice the increase that takes place as the European trading session begins at 03:00 ET (08:00 GMT).

forex trading session movement

US trading session

The second largest trading market, New York handles approximately 16% of the world’s forex transactions. Many of the transactions in New York occurs during the US/Europe overlap, with transactions slowing as liquidity dries up and European traders exit the forex market.

Notice the green dot on the previous chart around 08:00 ET (13:00 GMT) when US comes online and when the market has the Europe/US overlap, the average movement increases even further until London falls offline (denoted by the red dot) near 12:00 ET (17:00 GMT).

When is the best time to trade?

DailyFX data has shown over the last 10 years, European currency pairs have shown greater success when traded during the 19:00 -11:00 GMT period. As mentioned previously, the liquidity during this time is relatively low as the US session has little/no affect. This lower liquidity allows for range bound trading strategies with greater use of indicators such as RSI.

Day traders who like ranges, meaning buying at support and selling at resistance should consider trading the European currencies during the late US session into the Asian session (19:00-07:00GMT).

Day traders who like breakouts and trends should consider trading when Europe comes online to when the Europe moves offline (08:00-17:00GMT). Secondarily, trading Asian currencies (AUD or NZD) during the Asian session may provide some breakouts too as that is the active business day for those home currencies.

If you try to trade breakouts of European currencies during the Asian session, you will likely find it frustrating as those markets tend not to move as much since that is ‘off hours’ for those currencies.

For more insights on forex trading sessions, read “When is the best time of day to trade forex?”

Supporting pages and guides to enhance your forex trading experience

  • If you are just starting out on your trading journey it is essential to understand the basics of forex trading in our free New to Forex trading guide.
  • We also offer a range of trading guides to supplement your forex knowledge and strategy development.
  • Our research team analyzed over 30 million live trades to uncover the traits of successful traders. Incorporate these traits to give yourself an edge in the markets.
  • Traders often look to retail client sentiment when trading popular FX markets. DailyFX provides such data, based on IG client sentiment.
GBP/USD Price Forecast: Cable Bounces from Oversold Territory as UK Retail Sales Recover

GBP/USD Price Forecast: Cable Bounces from Oversold Territory as UK Retail Sales Recover

The UK recorded a hot inflation print this week with hawkish repricing of the Bank of England’s (BoE) peak rate probabilities unable to arrest Cables slide as persistent US dollar strength continued. GBPUSD has enjoyed a decent bounce in the Asian session from lows around the 1.2300 mark, currently trading at 1.2340. Much like the rest of the week the question remains whether cable can hold onto its gains as the day progresses.

UK RETAIL SALES

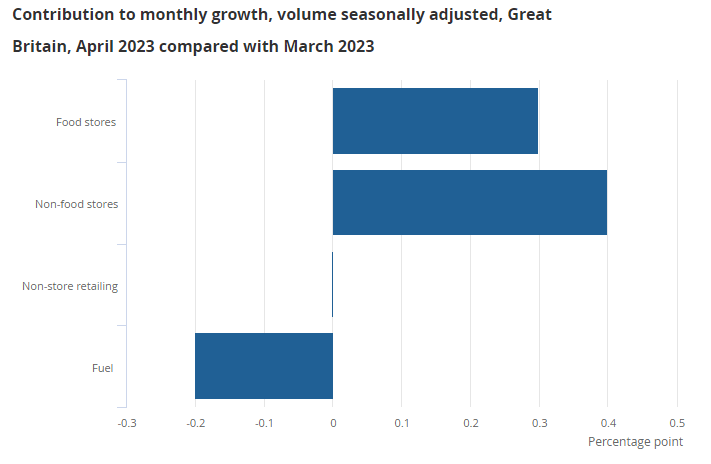
The UK released retail sales data this morning for the month of April which validated the ONS claims that poor retail sales in March was down to heavy rains. The figure for April came in at 0.5% rebounding from a fall of 1.2% in March with signs that UK retailers may look ahead with a bit more confidence. Sales volumes rose by 0.8% in the three months to April 2023, the highest rate August 2021 which came in at 1.3%.

image1.png

Source: ONS, Retail sales, Great Britain: April 2023

*NOTE: The graph above shows the contributions to the 0.5% month-on-month rise in overall retail sales volumes (quantity bought) in April 2023.

US FACTORS AND EVENT RISK

The US dollar meanwhile which has largely been the driving force behind cables move continues to hold firm which should continue as long as a deal on the US debt ceiling remains unresolved. There has been some positive rhetoric but none that would suggest a deal is imminent with next week going to be key as the June 1 deadline approaches.

The day ahead will see focus shift to the all-important Core PCE data out of the US, which remains the Federal Reserves preferred gauge of inflation. This comes on the back of largely positive data out of the US yesterday with GDP Growth QoQ estimates beating forecast while initial and continuous jobless claims beat estimates as well. Another positive notch for the US on the labor front heading toward the June meeting.

Today’s PCE data could lend the US dollar further support should the print come in hotter than expected with the Core PCE Index forecast to come in at 4.6%. A beat of the forecast could back up recent hawkish rhetoric from Fed policymakers regarding potential hikes in June and beyond.

image2.png

For all market-moving economic releases and events, see the DailyFX Calendar

TECHNICAL OUTLOOK AND FINAL THOUGHTS

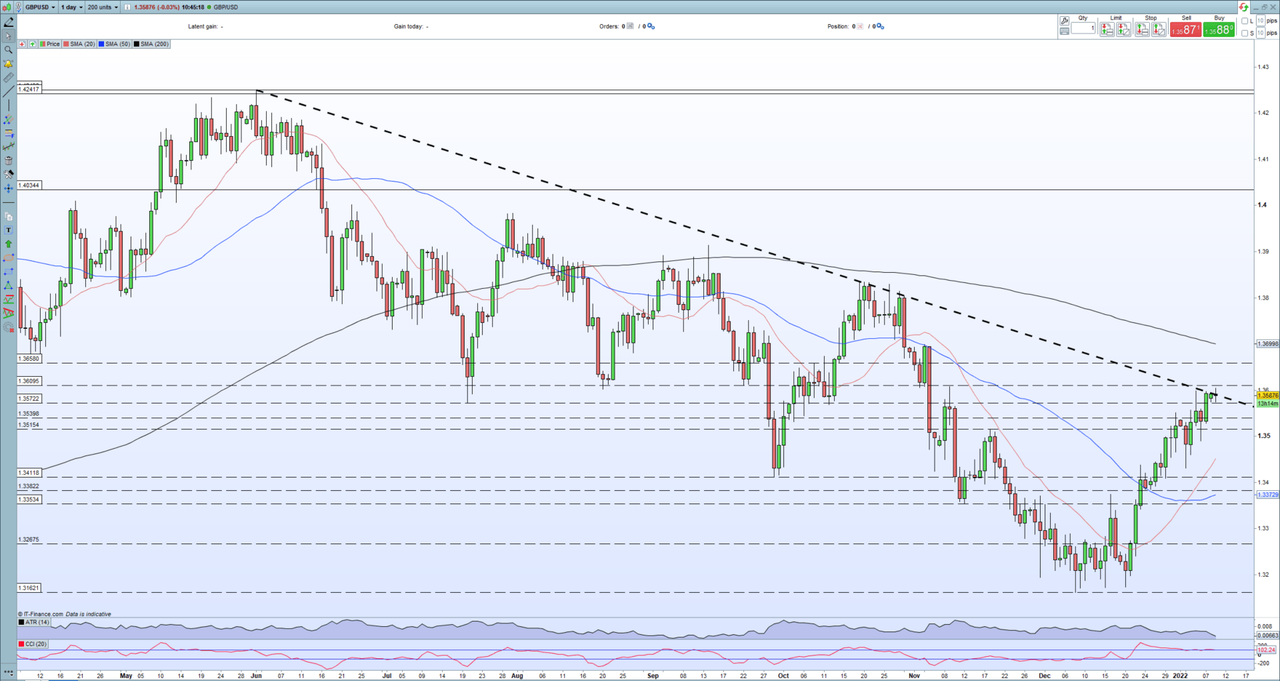
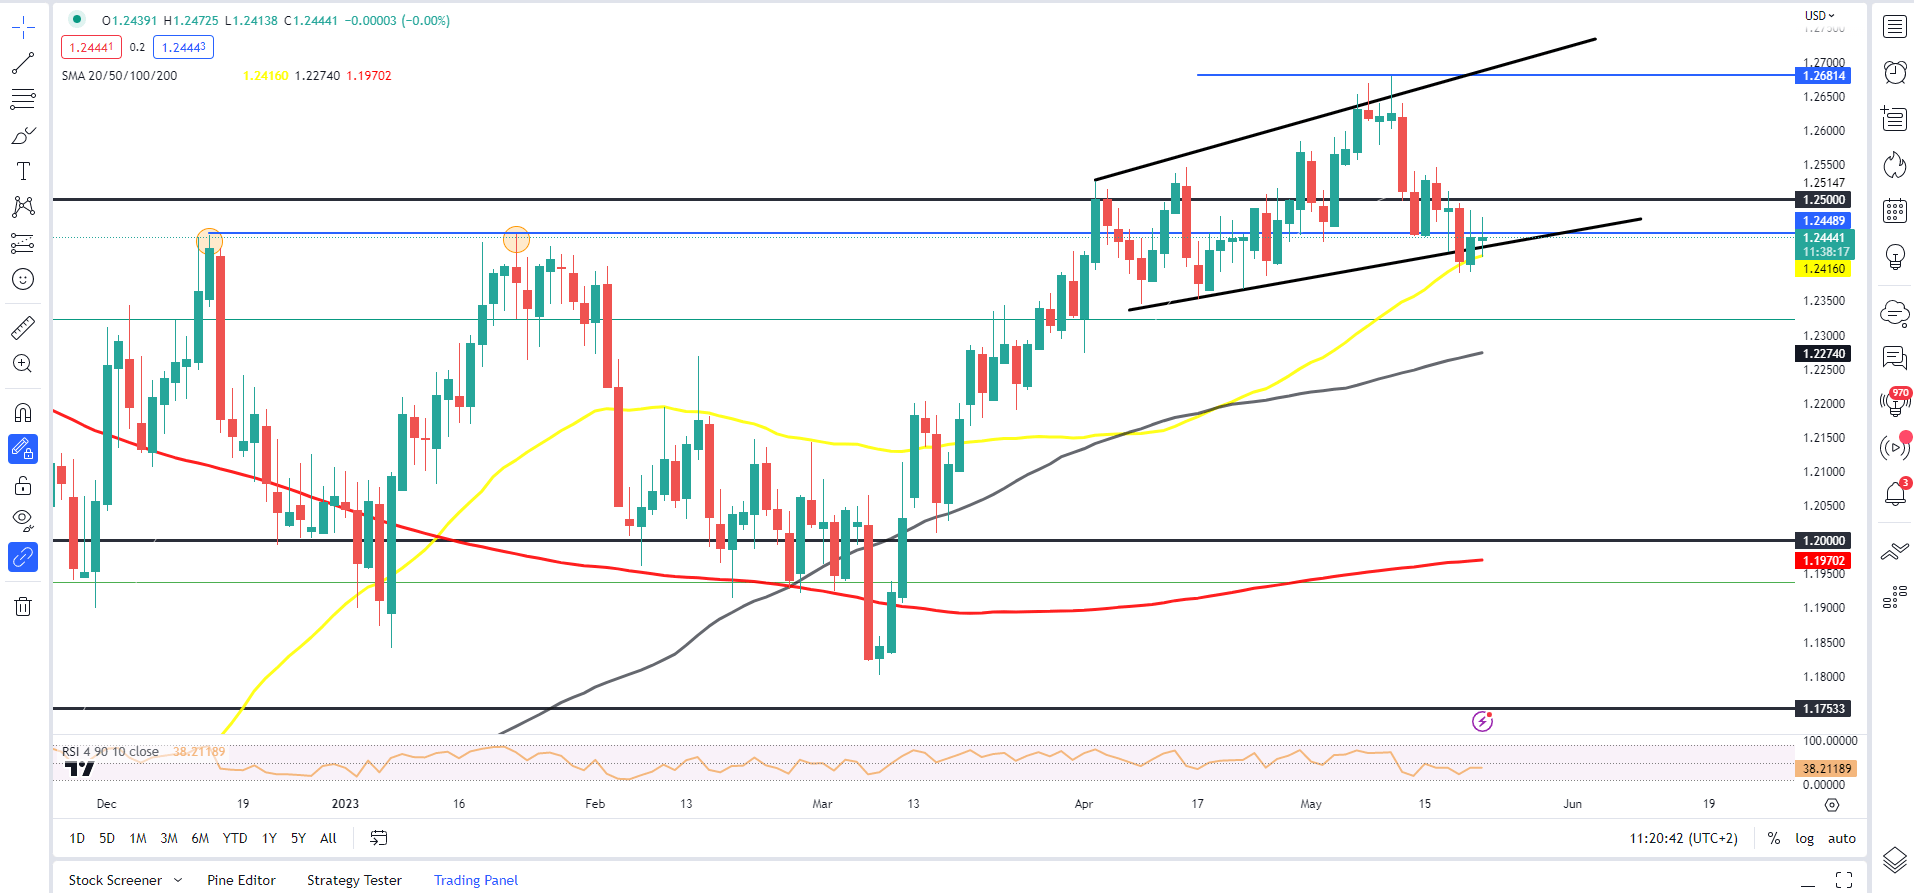
On the daily timeframe GBPUSD has continued to tick lower toward the key 100-day MA resting around the 1.2280 handle. This morning’s bounce came as the pair entered oversold territory (14-Day RSI) hitting a high of around 1.2354.

Looking at the intraday potential for GBPUSD and the biggest worry remains the US factors mentioned above which could continue to cap any upside recovery. I do think we may find significant support and a potential bottom around the 100-day MA, but this would rest on the outcome of the PCE data. The range between 1.2360 and 1.2280 (100-day MA) could remain pivotal for intraday moves.

There is a possibility that we could see a continued recovery for the majority of the European session toward yesterday’s high around 1.2388 before a selloff heeding into the US session and data releases.

Key Intraday Levels to Keep an Eye Out For

Resistance levels:

  • 1.2388
  • 1.2448
  • 1.2500

Key support levels:

  • 1.2310
  • 1.2280 (100-day MA)
  • 1.2220

GBP/USD Daily Chart – May 26, 2023

image3.png

Source: TradingView

Basis Risk Post-LIBOR Transition Will Not Affect FFELP ABS Ratings

Basis Risk Post-LIBOR Transition Will Not Affect FFELP ABS Ratings

Fitch Ratings-New York-24 May 2023: Significant change to basis risk is not anticipated for Federal Family Education Loan Program (FFELP) ABS following rate transition away from LIBOR under the Adjustable Interest Rate Act (LIBOR Act), according to Fitch Ratings. All FFELP ABS and Special Allowance Payments (SAP) will transition to SOFR-based rates on the first business day after June 30, 2023. Basis risk arises when the SAP rate index differs from the rate index for the FFELP ABS bonds, including differences in reset dates and reset frequency. We will apply similar basis risk stresses as those currently applied to LIBOR rates under our U.S. Federal Family Education Loan Program Student Loan ABS Rating Criteria, with no changes to ratings as a result of basis differentials under SOFR.

Fitch will continue to model various interest rate levels and applies basis spread stresses that align with historical movements of the relevant indices. The stresses test a transaction’s vulnerability to both short-term and long-term rate movements at all rating categories.

SAP paid by the U.S. Department of Education on the underlying assets effectively turns fixed-rate student loans into variable rate assets. FFELP ABS transactions are more sensitive to interest rate basis risk than other consumer ABS sectors, given the low absolute level of credit enhancement for these transactions that limits the ability of FFELP ABS to absorb any form of loss.

The LIBOR Act and the related final rule for implementation from the Federal Reserve Board requires the following replacement rates be applied for contracts transitioning away from LIBOR:

–SAP indexed FFELP loans: 30day Average SOFR (30dy SOFR) + spread adjustment of 0.11448%;
–For FFELP ABS when more than 50% of the portfolio consists of FFELP loans (all Fitch-rated FFELP ABS meet this threshold): (i) one-month LIBOR will be replaced with 30-day SOFR plus the tenor spread adjustment (0.11448%, the same as SAP replacement rate); and (ii) three-month LIBOR will be replaced with 90-day Average SOFR (90dy SOFR) plus the tenor spread adjustment (0.26161%). This is different from other consumer loan transactions that will utilize the CME Term SOFR and was a new addition to the final rule;
–Derivatives SOFR will be compounded in arrears for the applicable tenor, plus a stated spread adjustment based on the applicable tenor.

The 30-day SOFR and 90-day SOFR rates are relatively new rates published by The New York Federal Reserve Bank starting in 2020. SOFR observations are not available in periods of prolonged economic stress, such as the Great Recession, complicating the derivation of forward-looking stresses at all rating levels. SOFR basis spread did decrease last year as interest rates increased, which could be indicative of a decrease in basis spreads going forward; however, due to the short historical performance of the SOFR indices, historical basis spreads during periods of economic stress will continue to be factored into Fitch’s basis spread assumptions post-LIBOR transition.

Therefore, Fitch’s basis risk stresses will remain unchanged, and rating actions will not result from the transition to SOFR. Ratings downgrades in the sector remain predominately due to maturity risk, the risk that senior classes will not pay in full prior to legal final maturity dates.

The limited number of FFELP ABS with derivatives will face a meaningful operational challenge with the transition under the LIBOR Act as the date for determining the derivative payment amounts is likely to change to two days before payment in line with the Fed final rule. Such a change may interfere with the calculations for the transaction waterfall and lead to a disruption of payments on the bonds if the change in date for the swap is not successfully incorporated into the structure.

Related research:

U.S. Student Loan ABS Defaults Reach Highs in 1Q23

Contacts:

Nicole Edwards
Director, US Structured Finance
+1 212 908-9114
Fitch Ratings, Inc.
Hearst Tower
300 W. 57th Street
New York, NY 10019

Sarah Repucci
Senior Director, Fitch Wire
Credit Policy – Research
+1 212 908-0726

AUDUSD pauses decline but bears still in control

AUDUSD pauses decline but bears still in control

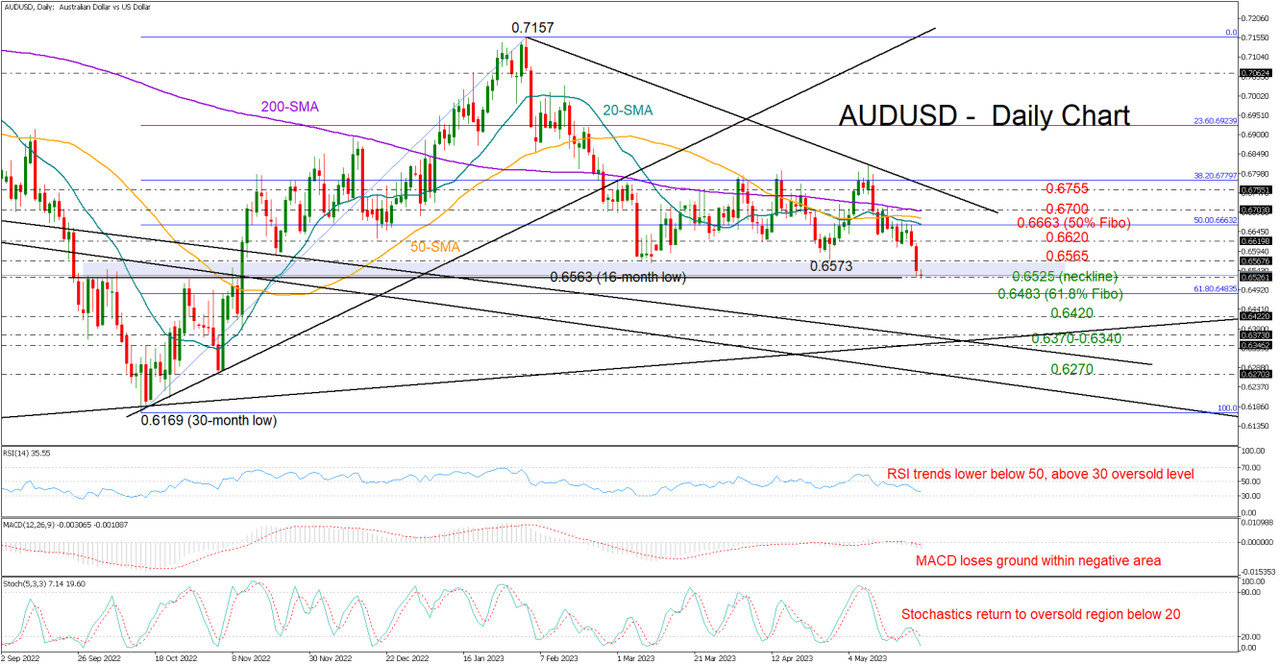
AUDUSD  plummeted to a six-month low on Wednesday to find support around the key 0.6525 area, which is the broken neckline of the inverse head and shoulders pattern registered last Autumn.

From a technical perspective, the bearish wave has more room to run as the falling RSI has yet to reach its 30 oversold level, while the Stochastic oscillator has flipped backwards to re-enter the oversold region below 20. The MACD keeps decelerating within the negative zone, sending bearish vibes as well.

Trend signals are also discouraging, with the price having declined below its simple moving averages (SMAs) to violate the 0.6565 floor of the short-term range.

Should sellers claim the 0.6525 base, the pair may initially test the 61.8% Fibonacci retracement of the previous upleg at 0.6483 before falling aggressively towards the 0.6420 region taken from Autumn 2022 and May 2020. Even lower, the 0.6370-0.6340 territory could be of greater importance as the tentative support trendline from 2020 lows intersects the descending line from August 2021 within this zone. If the downfall continues, the next destination could be the 0.6270 bar.

On the upside, the bulls might need to overcome the 0.6565-0.6620 zone in order to challenge the 20-day SMA and the 50% Fibonacci of 0.6663. A decisive close above the 200-day SMA at 0.6700 could provide direct access to the tentative resistance trendline currently seen around 0.6755.

All in all, AUDUSD may experience more selling in the coming sessions, but for that to happen, the 0.6525 floor should collapse. 


Fitch puts United States’ AAA rating on negative watch, citing debt ceiling fight

Fitch puts United States’ AAA rating on negative watch, citing debt ceiling fight

Fitch put the United States’ AAA long-term foreign-currency issuer default rating on negative watch Wednesday evening, pointing to brinksmanship over the debt ceiling.

“The Rating Watch Negative reflects increased political partisanship that is hindering reaching a solution to raise or suspend the debt limit despite the fast-approaching x-date,” the rating agency said.

Futures linked to the Dow Jones Industrial Average briefly slipped about 100 points after Fitch, one of the big three ratings agencies, issued its note.

The so-called X-date, which is when the U.S. could default on its debt, could arrive as early as June 1, according to Treasury Secretary Janet Yellen.

Fitch noted that it still expects Washington officials to arrive at a resolution before the deadline.

“However, we believe risks have risen that the debt limit will not be raised or suspended before the x-date and consequently that the government could begin to miss payments on some of its obligations,” the rating agency said.

The announcement arrives after debt ceiling negotiations between teams representing President Joe Biden and House Speaker Kevin McCarthy have fallen short of an agreement.

On Wednesday, McCarthy said that discussions over raising the debt limit were progressing toward a deal, but both parties continue to clash over spending. McCarthy did offer hope that a deal would be reached before the deadline. But House members were informed their weeklong recess would begin on Thursday, although they were put on notice they could be called back for a vote.