Australian Dollar Looking Vulnerable: AUD/USD, AUD/JPY, AUD/CAD Price Action

Australian Dollar Looking Vulnerable: AUD/USD, AUD/JPY, AUD/CAD Price Action

The Australian dollar is looking vulnerable as it tests key support against the US dollar, a break below which could lead to further losses in the near term.

AUD has been hurt by a mix of factors recently: a setback in risk sentiment amid the lack of meaningful progress in Washington over raising the debt limit, a trimming back of rate cut expectations after hawkish speak from US Federal Reserve officials, and underwhelming Australia data (jobs data being the most recent).

This puts increased focus on Australia retail sales data for April due Friday – forecast to have slowed to 0.1% on-month from 0.4% previously.A below-expected print could precipitate a decline in AUD. Also, a higher-than-expected US core PCE price index print (expected to remain flat at 4.6% on-year) could boost USD.

AUD/USD Daily Chart

image1.png

Chart Created by Manish Jaradi Using TradingView

AUD/USD: Threatens to break lower

AUD/USD is attempting to break under crucial support on a horizontal trendline from November at about 0.6585. Such a break could open the way initially toward 0.6350, based on the width of the sideway channel. Importantly, such a move would negate the bullish prospects highlighted in “Australian Dollar Ahead of Budget: AUD/USD, AUD/JPY, EUR/AUD Price Setups”, published May 9. On the upside, AUD/USD would need to clear the hurdle at 0.6805 for the downward pressure to fade.

AUD/CAD Daily Chart

image2.png

Chart Created by Manish Jaradi Using TradingView

AUD/CAD: Cracks below support

AUD/CAD’s fall below a horizontal trendline from April at about 0.8950 has triggered a minor double top (the April and the May highs), potentially exposing downside risks toward 0.8800. The bearish development follows a failure to cross above stiff resistance on the 89-day moving average (see the daily chart).

AUD/JPY Daily Chart

image3.png

Chart Created by Manish Jaradi Using TradingView

AUD/JPY: Upside capped

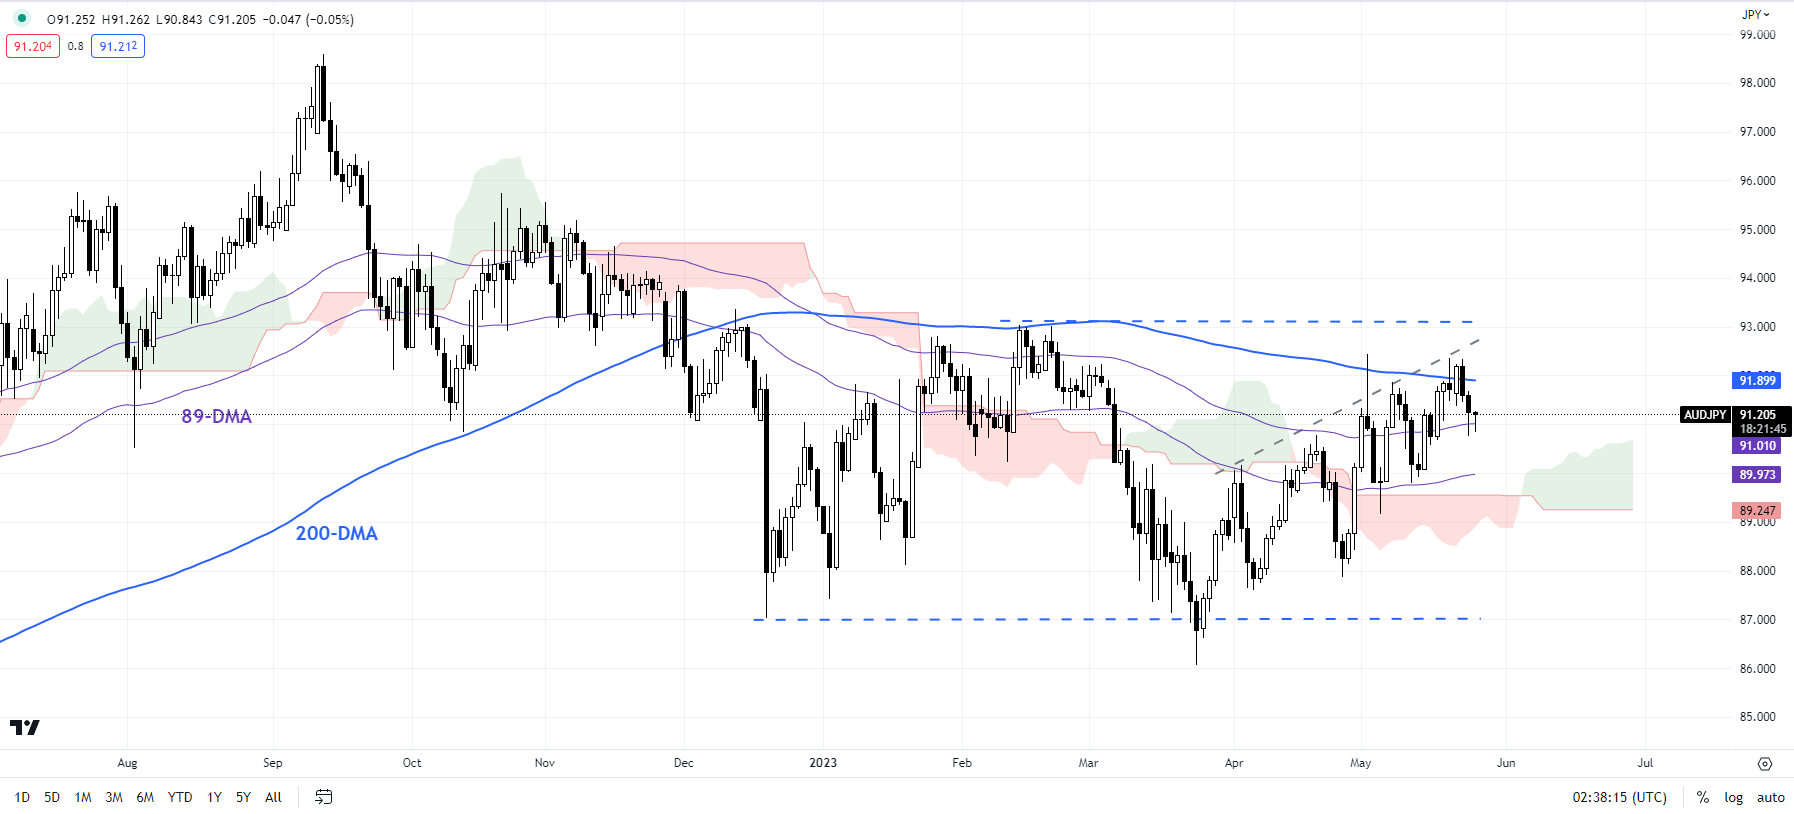
AUD/JPY risks a turn lower as it tests a strong converged barrier on the 200-day moving average, roughly coinciding with the February high of 93.00. Any break below 90.00-90.25 would raise the odds of a continuation of the well-established broad range of 86.00-93.00.

EUR/USD Outlook: Euro Tumbles as Germany Enters Recession

EUR/USD Outlook: Euro Tumbles as Germany Enters Recession

EURO FUNDAMENTAL BACKDROP

The euro continues to lose ground against the US dollar this morning after German GDP (see economic calendar below) surprised markets indicating Europe’s largest economy has entered into a technical winter recession. Two consecutive negative quarters is the official definition of a recession giving the euro bulls little optimism in a risk averse environment.

The US debt ceiling remains at the top of investors minds and with no deal on the table, markets are becoming increasingly more jittery – playing into the safe haven hands of the greenback. The Fitch ratings agency supplemented the already nervy market by placing the US on negative watch for a possible downgrade as a consequence of ongoing debt ceiling talks.

The day ahead features several European Central Bank (ECB) speakers and it will be interesting to see whether they cite the recent German GDP report in what has been an extremely hawkish narrative of recent.

From a US perspective, US GDP is the only high impact event to come alongside the Fed’s Collins. Yesterday’s FOMC minutes didn’t help the situation for the euro with many officials either looking at a pause or another hike in the June meeting. That being said, moving forward the door is open for additional rate hikes should the need arise. This gives more significance to key US economic data including today’s GDP and tomorrow’s core PCE price index, durable goods orders and Michigan consumer sentiment.

EUR/USD ECONOMIC CALENDAR (GMT +02:00)

image1.png

TECHNICAL ANALYSIS

EUR/USD DAILY CHART

image2.png

Chart prepared by Warren Venketas, IG

Daily EUR/USD price action has just breached below the 1.0736 key area of confluence looking to the 1.0700 psychological support handle – last seen in March 2023. There is still scope for further downside particularly if the current risk off sentiment continues. That being said, with so many moving variables to consider this week, the pair is very much at the mercy of external fundamental macro drivers.

EUR/USD could trade down to the 1.0700 area if the Fed fails to play down the risk of future rate hikes – ING

EUR/USD could trade down to the 1.0700 area if the Fed fails to play down the risk of future rate hikes – ING

We are seeing the Euro a little softer across the board this week. Economists at ING believe that the EUR/USD pair could test the 1.0700 level.

Dollar correction may have a little further to run

“Yesterday’s release saw May flash PMIs on the soft side, but inflation in the service sector did stay resilient – which will be troubling for the ECB.”

“We think this Dollar correction may have a little further to run and EUR/USD could trade down to the 1.0700 area if the Fed fails to play down the risk of future rate hikes.”


ifo Business Climate Index falls

ifo Business Climate Index falls

Sentiment in the German economy has suffered a setback. The ifo Business Climate Index fell to 91.7 points in May, after 93.4 points1 in April. This marks the first decline after six increases in a row. Driving this development are the significantly more pessimistic expectations. Managers are somewhat less satisfied with their current situation. German companies are skeptical about the upcoming summer. In manufacturing, the business climate was much worse, with expectations seeing a particularly steep decline. This was the largest decrease since March 2022 after the start of the war in Ukraine.

Russia, China set to ink bilateral pacts despite Western criticism

Russia, China set to ink bilateral pacts despite Western criticism

BEIJING — Russia and China are set to sign a set of bilateral agreements on Wednesday during the Russian prime minister’s trip to Beijing as the two giant neighbors pledge closer cooperation even as the West remains critical of their ties amid the war in Ukraine.

“As a result of the talks, a number of bilateral agreements is planned to be signed,” the Russian news agency Interfax reported, without elaborating.

The visit comes after Russia and China reacted furiously to the Group of Seven weekend’s declarations that singled them out on a range of issues, including Ukraine, nuclear arms and economic coercion.

Xi visited Russia in March and held talks with “dear friend” President Vladimir Putin, after committing to a “no limits” partnership just before the 2022 Russia attack on Ukraine, which Moscow calls a “special military operation.”

Beijing has rejected Western attempts to link its partnership with Moscow to Ukraine, insisting that their relationship does not violate international norms, China has the right to collaborate with who it chooses, and their cooperation is not targeted at any third countries.

As a show of support, the Chinese premier on Tuesday sent a congratulatory letter to the China-Russia business forum in Shanghai, attended by Mishustin and a large group of Russian tycoons, saying China is willing to expand bilateral economic and trade exchanges.

In April, China’s exports to Russia saw continued momentum, climbing 153.1% from a year earlier, after more than doubling in March, according to data from Chinese customs.

Russia’s energy shipments to China are projected to rise by 40% this year, and the two countries are discussing technological equipment supplies to Russia, Interfax news agency reported.

Deepening of ties with China is a strategic course for Moscow, said the secretary of Russia’s Security Council Nikolai Patrushev, who held talks on Monday with Chen Wenqing, member of the Chinese Communist Party’s Politburo who oversees police, legal affairs and intelligence.

Mishustin’s visit comes at a time when Ukraine is readying a counteroffensive in a bid to retake occupied territory by Russian forces.

Beijing has refrained from openly denouncing Russia’s invasion. But since February, Xi has promoted a 12-point peace plan, which has been met with skepticism from the West and cautiously welcomed by Kyiv.

Last week, China’s special representative for Eurasian affairs Li Hui visited Ukraine and met with President Volodymyr Zelenskiy, kicking off a European tour that Beijing billed as its effort to promote peace talks and a political settlement of the crisis.

Li Hui is scheduled to visit Russia on Friday, Russian news agency TASS reported. (Reporting by Ryan Woo; Additional reporting by Lidia Kelly and Ethan Wang; Editing by Michael Perry)

NZD/USD Price Analysis: Eyes fresh monthly low below 0.6220 confluence on less hawkish RBNZ’s Orr

NZD/USD Price Analysis: Eyes fresh monthly low below 0.6220 confluence on less hawkish RBNZ’s Orr

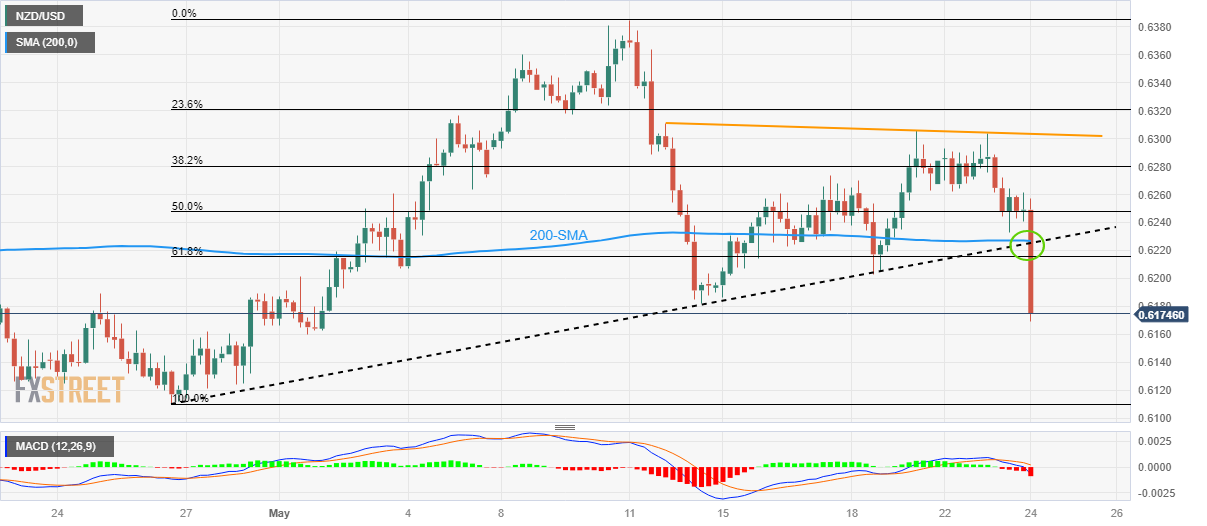
NZD/USD remains on the back foot around a three-week low under 0.6200, close to 0.6180 by the press time, even as Reserve Bank of New Zealand (RBNZ) Governor Adrian Orr tries to placate Kiwi bears early Wednesday.  That said, the quote dropped 150 pips after the RBNZ disappointed markets while keeping the peak rate unchanged, as well as matching the broad forecasts of increasing the Official Cash Rate (OCR) by 0.25%.

With the NZD/USD pair’s downside break of the 0.6220 key level on the dovish RBNZ bias, the sellers are likely to keep the reins amid bearish MACD signals. it’s worth noting that an upward-sloping trend line from late April joins 200-SMA to highlight 0.6220 as the key support-turned-resistance.

As a result, the Kiwi pair is well set for a fresh monthly low, currently around 0.6160. In doing so, the previous monthly bottom of around 0.6110 and the yearly trough near 0.6084 marked in March will be in the spotlight.

Alternatively, NZD/USD pair’s corrective bounce fails to push back the Kiwi buyers unless crossing the 0.6220 level.

Even so, a two-week-old descending resistance line, around 0.6305 by the press time, can challenge the NZD/USD bulls ahead of directing them to the monthly high of 0.6385.

NZD/USD: Four-hour chart


Chinese Stocks Close to Erasing 2023 Gain as Headwinds Intensify

Chinese Stocks Close to Erasing 2023 Gain as Headwinds Intensify

China’s benchmark stock index erased all its gains for the year as a weaker yuan and developers’ debt woes added to persistent worries over growth and geopolitics.

The CSI 300 Index closed down 1.4% Wednesday, with the energy and financial sectors leading the decline. The benchmark is among the worst performers in Asia this year, compared to a more than 3% advance in the MSCI Asia Pacific Index and double-digit gains for gauges in Japan and South Korea.

Chinese stocks have steadily fallen out of favor since a reopening rally fizzled at the end of January, belying bullish conviction calls from Wall Street analysts at the start of 2023. Weaker-than-expected economic data have prompted banks from JPMorgan Chase & Co. to Barclays Plc to slash their growth forecasts, while worries over worsening ties with Western countries have also hurt sentiment.

Developers’ financial woes were again in focus on Wednesday, with a number of local government financing vehicles struggling to repay debt on time. A Bloomberg gauge of Chinese builders shed more than 2%, falling for the 11th session in its longest such streak since 2018.

Read: China LGFV’s Last-Minute Bond Payment Highlights Local Struggles

“It looks like it’s going to be a grueling year,” said Dai Yuzhong, a fund manager at Shanghai Shinyu Private Fund Management Co. “The pessimism in the market is spreading, and negatives ranging from the yuan losing the 7 level to worries about LGFV payment are putting investors on the defense.”

Outflows from foreign investors continued. They offloaded 4.5 billion yuan ($635 million) after a $1.1 billion selloff via trading links with Hong Kong on Tuesday.

Tensions between China and the US have heated up as Beijing banned purchases of Micron Technology Inc.’s products on national security grounds, which ignited accusations of over-reach from US officials.

Traders are also watching how China’s new Covid wave, which is forecast to peak at about 65 million infections a week toward the end of June, may affect the recovery.

Read: US Must Widen China Chip Curbs in Micron Riposte, Lawmaker Says

Investors this year have turned to more themed trades as the macro environment deteriorated. State-owned enterprises have witnessed eye-popping gains after regulators called for building a valuation system with Chinese characteristics, a term some interpreted as a signal to boost valuations. Artificial intelligence-related companies also saw frenzied trading earlier this year before enthusiasm cooled.

Producer price inflation, UK: April 2023

Producer price inflation, UK: April 2023

1. Main points

  • Producer input prices rose by 3.9% in the year to April 2023, down from 7.3% in the year to March 2023.
  • Producer output (factory gate) prices rose by 5.4% in the year to April 2023, down from 8.5% in the year to March 2023.
  • Inputs of metals and non-metallic minerals, and petroleum products provided the largest downward contributions to the change in the annual rates of input and output inflation, respectively.
  • While annual producer price inflation rates have been slowing in recent months, the index levels for both input and output prices have been broadly stable since June 2022.
  • On a monthly basis, producer input prices fell by 0.3% while output prices showed no movement in aggregate in April 2023.

2. Producer price inflation rates

The annual rate of the input Producer Price Index (PPI) has now been positive for 29 consecutive months, although it has been slowing for the last 10 months. The annual rate is now 20.5 percentage points below its record annual high of 24.4% in June 2022 (Figure 1).

The annual rate of the output PPI has now been positive for 28 consecutive months, but it has been slowing for the last nine months. It is down 14.3 percentage points from its recent peak of 19.7% in July 2022.

The index levels for both input and output prices have been broadly stable since June 2022 after a period of rapid increase starting in 2021 and continuing into early 2022 (Figure 2). This levelling out, when compared with the rapid increases seen last year, has the effect of creating a fall in the annual inflation rate (Figure 1), as explained in our Beware base effects blog.

Source: Producer Price Index (PPI) from the Office for National Statistics

On-and-Off-and-On-Again Progress Toward a U.S. Debt Ceiling Agreement

On-and-Off-and-On-Again Progress Toward a U.S. Debt Ceiling Agreement

It is our view – with high conviction – that the recent on-and-off-and-now-on-again negotiations will result in a debt ceiling deal ahead of the U.S. Treasury’s “X date” on June 1 (i.e., the estimated date when the federal government would no longer have enough funds to pay its bills) – although possibly not until the (literal) eleventh hour. After all, while neither side seemingly has a political incentive to make concessions before they absolutely have to, neither side has any political incentive to default either. To use an apt, albeit graphic analogy: Passing the debt ceiling is like passing a kidney stone – we know it will pass, it is just a question of how painful it will be. We would assert we are in the painful period right now.

Indeed, while each side of the political aisle has been testing the contours of a possible debt ceiling deal with new asks (i.e., immigration reform for Republicans, tax increases for Democrats), the broad outline hasn’t changed much over the past few weeks: reclaiming unused COVID-19 money, caps on “discretionary” spending (which represents roughly 25% of the U.S. government’s $6 trillion annual budget), work requirements for specific entitlements (which poll quite well but tend to be burdensome to administer, and therefore do little from a deficit perspective), and potentially some down payment on energy-permitting reform (both traditional and clean energy). We could also see tweaks to how Medicare reimburses providers for hospital treatments.

The real obstacles, however, seem to be in the specific spending details:

  • Setting the so-called spending baseline for fiscal year 2024: If FY24 spending is reset to FY22 levels – the Republicans’ ask – it would likely drive short-term cuts in discretionary spending and produce longer-term deficit savings. If FY24 spending is set at FY23 spending levels – the Democrats’ preference – this would likely represent a freeze in discretionary spending (i.e., no cuts), but nevertheless represent longer-term deficit reduction over 10 years.
  • The depth and composition of the spending caps: The questions amount to how much slower spending growth would be when compared with the Congressional Budget Office’s (CBO) projections (i.e., how much will growth be “capped”) and how those caps would be levied on non-defense discretionary spending (everything from national parks to meat inspectors) versus defense spending. There is also a question about duration of the spending caps: Democrats want two years; Republicans have argued for 10.

Overall, we believe policymakers will find common ground that likely results in few, if any, near-term cuts to spending, but will produce longer-term deficit savings relative to the CBO’s current projections. Of course, to really tackle the fiscal sustainability of the country, policymakers would have to address the elephant in the room – entitlement spending – but that is a non-starter politically on both sides of the aisle for the foreseeable future.

When, realistically, do lawmakers need to reach a deal? Everyone is working toward the Treasury’s June 1 X date. To meet that deadline, negotiators likely need to reach a high-level deal by the middle of this week in order to craft legislative text and then proceed with House and Senate procedure. Once a deal is reached in principle, there may be further drama around garnering sufficient support for the deal among rank-and-file members, but we believe there will be sufficient support on both sides of the aisle to get a bill passed. Also, if Congress needs additional time to negotiate or to put pen to paper, it’s possible we could see a short-term extension of one or two weeks at most.

We don’t expect invocation of the 14th Amendment. Lately there has been more noise about President Joe Biden’s possible use of the 14th Amendment to effectively ignore the debt limit, citing the clause that public debt “shall not be questioned.” However, Treasury Secretary Janet Yellen continues to insist that the only way the debt ceiling can be addressed is through Congress. From a market perspective, the amendment approach seems unlikely given the uncertainty it could cause, and it also seems unlikely from a political perspective, given the expected blowback.

Market reaction: If past debt ceiling situations are prologue, equity markets may wobble this week depending on the course of negotiations, but assuming the anticipated deal crystallizes and there is no default, markets could likely retrace after a resolution. (There was an exception in 2011, when equity markets continued declining after the resolution and X date, partly due to the European debt crisis and partly due to the anticipation of large spending cuts that were part of the resolution.) With that said, we have already seen significant dislocations in the fixed income market, creating both risks and opportunities – for details, see our recent Viewpoint, “Debt Ceiling Debate: Examining Risks Around the X Date.”

Bottom line: While it will likely be a noisy next few days or week, we remain constructive on a deal coming together before the June 1 X date, with an outside possibility of a short-term extension (measured in weeks, not months). As a result, lawmakers (and markets) probably would not have to contend with the debt ceiling again until 2025, after the highly anticipated 2024 elections. No one seems to have the political incentive to compromise until the last minute, so we may see some pain and drama leading up to next week’s deadline, but the overall outcome appears clear to us: A debt ceiling resolution will pass.

EUR/USD set to fall to next support at 1.0729/14 and eventually 1.0550 – Credit Suisse

EUR/USD set to fall to next support at 1.0729/14 and eventually 1.0550 – Credit Suisse

EUR/USD risk stays seen lower for a test of the lower end of its five-month channel, analysts at Credit Suisse report.

Move above 1.0906 is now needed to warn of strength back

“EUR/USD maintains its decisive rejection from the top of the shallow uptrend channel from the beginning of January and with support from the 55-DMA removed as looked for this should confirm a more important downturn. We thus stay tactically negative looking for a fall to support next at 1.0729/14 and eventually the lower end of the channel, now at 1.0550.”

“Above 1.0906 is now needed to warn of strength back to retest 1.1097/1.1107, but with a fresh cap expected here.”