Breaking News: Hot UK CPI Augments Pound, GBP/USD Above 1.24

Breaking News: Hot UK CPI Augments Pound, GBP/USD Above 1.24

GBPUSD FUNDAMENTAL BACKDROP

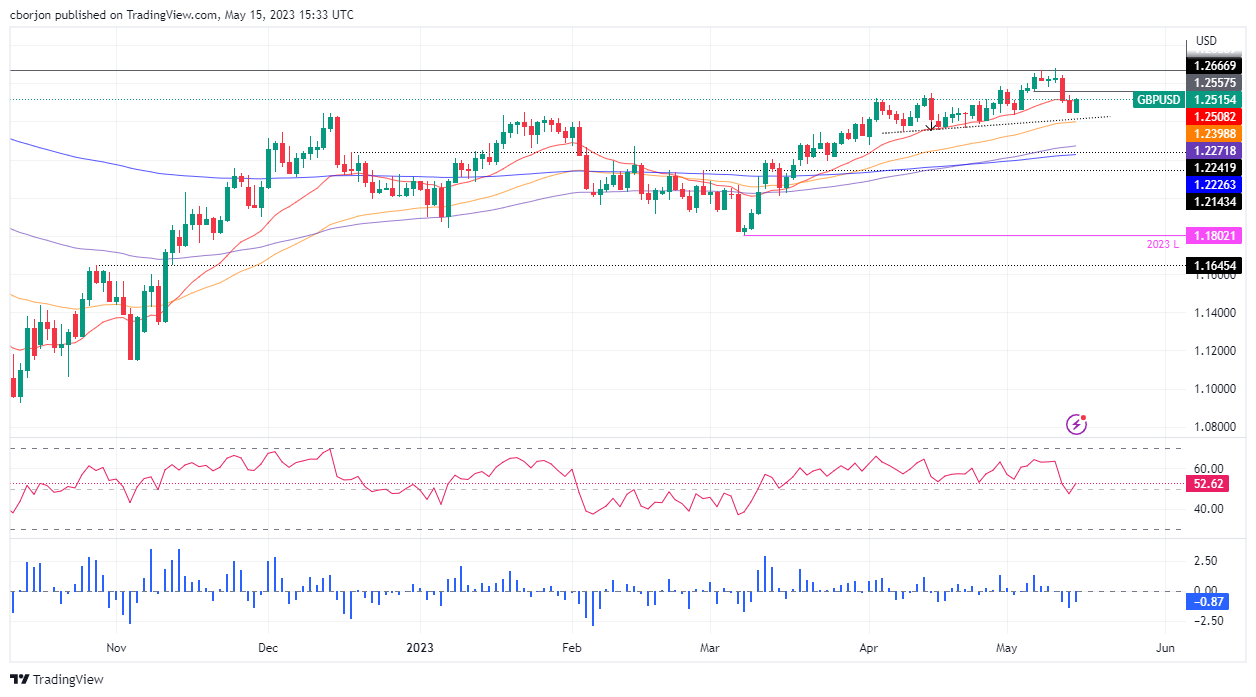
The British pound rallied this morning after the UK CPI report surpassed forecast by quite some margin (see economic calendar below). Core inflation was the biggest surprise and now reached a level last seen since 1992! This almost shores up a 25bps interest rate by the Bank of England (BoE) in their next meeting. That being said, some positivity stems from the PPI metric which has slipped broadly lower. Headline inflation did fall sharply despite beating estimates; however, I do not think it is enough to deter another hike.

ECONOMIC CALENDAR

image1.png

Money market pricing has been ‘hawkishly’ revised and after Governor Andrew Bailey’s comments yesterday about the need to tackle persistently high inflationary pressures, today’s data could cement the continuation of aggressive monetary policy from the central bank. Rate expectations are now priced at almost 60bps at year end and it is likely Governor Bailey’s speech later today could be slightly more hawkish than yesterday.

The prolonging of the US debt ceiling negotiations is also a key variable for cable and the longer it drags on, the more anxious markets become.

BANK OF ENGLAND INTEREST RATE PROBABILITIES

image2.png

TECHNICAL ANALYSIS

GBP/USD DAILY CHART

image3.png

Chart prepared by Warren Venketas, IG

Key resistance levels:

  • 1.2680
  • 1.2584
  • 1.2500

Key support levels:

  • 50-day MA (yellow)
  • 1.2400
  • 1.2345
  • 1.2275

BULLISH IG CLIENT SENTIMENT

IG Client Sentiment Data (IGCS) shows retail traders are currently net LONG on GBP/USD with 52% of traders holding long positions (as of this writing). At DailyFX we typically take a contrarian view to crowd sentiment but due to recent changes in long and short positioning, we arrive at a short-term upside bias.

Forex Today: Markets remain cautious as focus shifts to FOMC Minutes

Forex Today: Markets remain cautious as focus shifts to FOMC Minutes

Investors cling to a cautious approach mid-week amid a lack of progress in US debt-ceiling negotiations between Republicans and White House. US stock index futures trade modestly lower in the European morning and the US Dollar Index consolidates Tuesday’s gains. IFO sentiment survey from Germany will be featured in the European economic docket. In the late American session, the US Federal Reserve (Fed) will release the minutes of May policy meeting.

During the Asian trading hours on Wednesday, the Reserve Bank of New Zealand (RBNZ) announced that it raised its policy rate by 25 basis points to 5.5% as expected. The policy statement revealed that the RBNZ expects to hold the rate unchanged at 5.5% by September. In the post-policy meeting press conference, “we are getting on top of inflation,” RBNZ Governor Adrian Orr said and noted that the labour market was becoming less pressured. NZD/USD fell sharply and was last seen trading at its lowest level in nearly a month at 0.6150, losing more than 1.5% on a daily basis.

The UK’s Office for National Statistics reported early Wednesday that the Consumer Price Index rose 8.7% on a yearly basis in April. This reading followed the 10.1% increase recorded in March but surpassed the market expectation of 8.2%. The Core CPI, which excludes volatile food and energy prices, increased 6.8%, compared to analysts’ estimate of 6.2%. Finally, the Retail Price Index rose 11.4%, down from 13.5% in March. Following the stronger-than-expected inflation figures, GBP/USD gained traction and climbed above 1.2450.

EUR/USD touched its lowest level in two months at 1.0760 on Tuesday and spent the Asian session in a very tight range on Wednesday. The pair tries to stage a rebound early Wednesday but stays well below 1.0800. European Central Bank President Lagarde will be delivering a speech at 1745 GMT.

Following Monday’s upsurge, USD/JPY fluctuated in a narrow range on Tuesday and closed the day flat. The pair remains indecisive early Wednesday and moves up and down at around 138.50.

Gold price fell toward $1,950 on Tuesday but managed to stage a rebound in the late American session amid retreating US Treasury bond yields. XAU/USD consolidates its losses near $1,970 in the European morning.

Bitcoin registered modest gains for the second straight day on Tuesday but came under renewed bearish pressure early Wednesday. BTC/USD was last seen losing nearly 2% on the day at $26,700. Ethereum rose toward $1,900 on Tuesday but lost its traction before testing that level. ETH/USD stays on the back foot and declined toward $1,800 in the European morning.

GBP/USD climbs above 1.2450 after hot UK inflation data

GBP/USD climbs above 1.2450 after hot UK inflation data

GBP/USD has gathered bullish momentum and climbed above 1.2450 early Wednesday. The data from the UK showed that the annual core CPI rose 6.8% in April, surpassing the market expectation and the March reading of 6.2% by a wide margin, providing a boost to Pound Sterling.

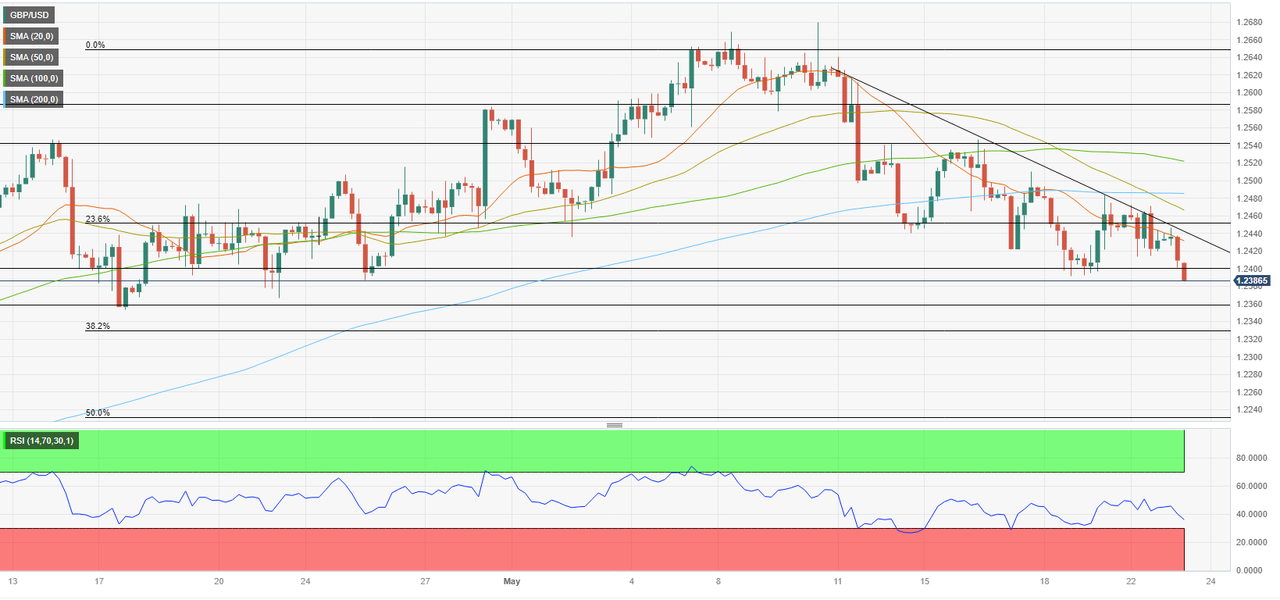
GBP/USD continues to trade below the descending trend line and the Relative Strength Index (RSI) indicator on the four-hour chart stays below 50, highlighting the lack of buyer interest.

On the downside, 1.2400 (static level, psychological level) aligns as initial support. With a four-hour close below that level, sellers could take action and drag GBP/USD lower toward 1.2360 (static level) and 1.2330 (Fibonacci 38.2% retracement of the latest uptrend).

If GBP/USD manages to stabilize above 1.2400, it is likely to face stiff resistance in the 1.2450/60 area (descending trend line, Fibonacci 23.6% retracement). Once the pair flips that area into support, buyers could show interest and open the door for an extended rebound toward 1.24

GBP/USD has lost its traction in the early European morning on Tuesday and touched its lowest level in a month slightly below 1.2400. The pair’s near-term technical outlook suggests that sellers retain control. Bank of England (BoE) Governor Andrew Bailey will testify on monetary policy before the UK Treasury Select Committee and investors will continue to pay close attention to risk sentiment.

Following Monday’s face-to-face meeting, US President Joe Biden and House Speaker Kevin McCarthy failed to reach a deal to lift the government’s $31.4 trillion debt limit, causing markets to remain cautious. Early Tuesday, US stock index futures trade mixed and a negative shift in market mood in the second half of the day could allow the US Dollar (USD) to preserve its strength.

While speaking at the post-policy meeting press conference, BoE Governor Bailey said that they had good reasons to expect inflation to fall sharply over the coming months, beginning in April. In a speech to the British Chambers of Commerce last week, Bailey noted that there were signs that the UK labour market was loosening a little.

In case Bailey sticks to an optimistic tone regarding the inflation outlook, Pound Sterling is likely to have a difficult time finding demand.

In the meantime, the data from the UK showed that the S&P Global/CIPS Composite PMI declined to 53.9 in early May from 54.9 in April. This reading fell short of the market expectation of 54.6 and showed a loss of momentum in the private sector’s business activity growth.

EUR/USD on Cusp of Major Breakdown as US Dollar Embarks on Strong Recovery

EUR/USD on Cusp of Major Breakdown as US Dollar Embarks on Strong Recovery

The U.S. dollar has recently embarked on a strong recovery, driven by rising U.S. Treasury yields thanks to the exceptionalism of the U.S. economy. U.S. business activity and the labor market have held up remarkably well over the past few months despite numerous headwinds, including the banking sector turmoil that erupted in March.

Economic resilience has led some Fed officials (Bullard, for example) to take a more hawkish stance, leading them to support additional tightening and higher-for-longer rates. Against this backdrop, yields have rebounded significantly, with the 2-year note rising from a low of 3.65% this month to 4.4% at one point on Tuesday morning, a significant move in a short period of time by bond market standards.

The resurgent U.S. dollar has hurt most developed-market currencies, such as the euro and the yen. For instance, EUR/USD has fallen nearly 3% from its May peak, although some idiosyncratic factors have also contributed to the common currency’s underperformance, such as the slump in manufacturing activity in Germany.

Related Reading: Nasdaq 100 Entrenched in Indisputable Uptrend but Poor Market Breadth Is Ominous

Looking ahead, there is reason to believe that the U.S. dollar could retain the upper hand for a little bit longer. One potential bullish catalyst is the U.S. debt ceiling impasse. Volatility could increase dramatically in the coming days if Congress fails to reach an agreement to lift the country’s borrowing capacity soon, boosting safe-haven demand.

While lawmakers are likely to reach a deal at some point, that may not happen until the eleventh hour, when markets have already begun to convulse. History suggests that only panic tends to unite political parties in Washington. As the market becomes more nervous about a possible US default, EUR/USD could extend its slide near term.of clients are net long.

Change in Longs Shorts OI
Daily 10% -9% 1%
Weekly 7% -9% 0%
What does it mean for price action?
Get My Guide

EUR/USD TECHNICAL ANALYSIS

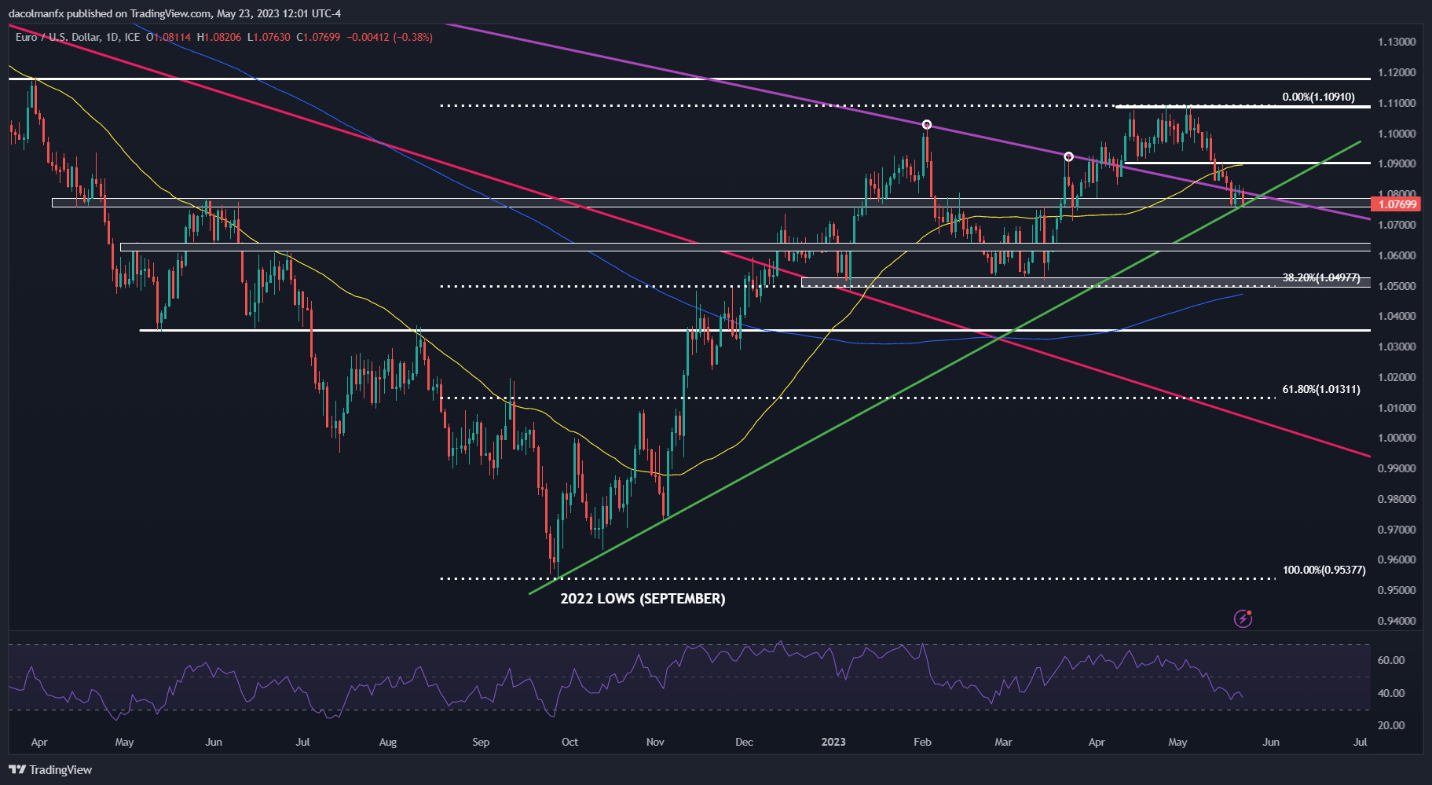
After the recent pullback, EUR/USD is testing trendline support near 1.0775/1.0770, that last line of defense against a deeper retrenchment. If bulls fail to protect this floor and prices slide beneath it, selling pressure could accelerate, setting the stage for a move toward 1.0625.

On the flip side, if the pair manages to establish a base around current levels and reverses higher in the direction of the broader trend, initial resistance appears at the psychological 1.0900 mark, a tad above the 50-day simple moving average. On further strength, the focus shifts to the 2023 highs.

EUR/USD TECHNICAL CHART

A screenshot of a computer screen  Description automatically generated with low confidence


Japanese Yen Setups: USD/JPY Muted After Breakout, AUD/JPY Forges Double Top

Japanese Yen Setups: USD/JPY Muted After Breakout, AUD/JPY Forges Double Top

USD/JPY TECHNICAL ANALYSIS

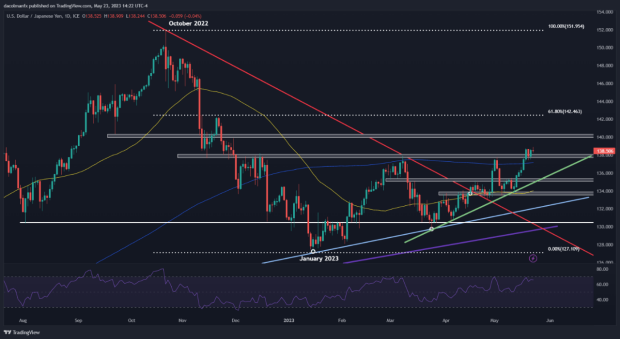
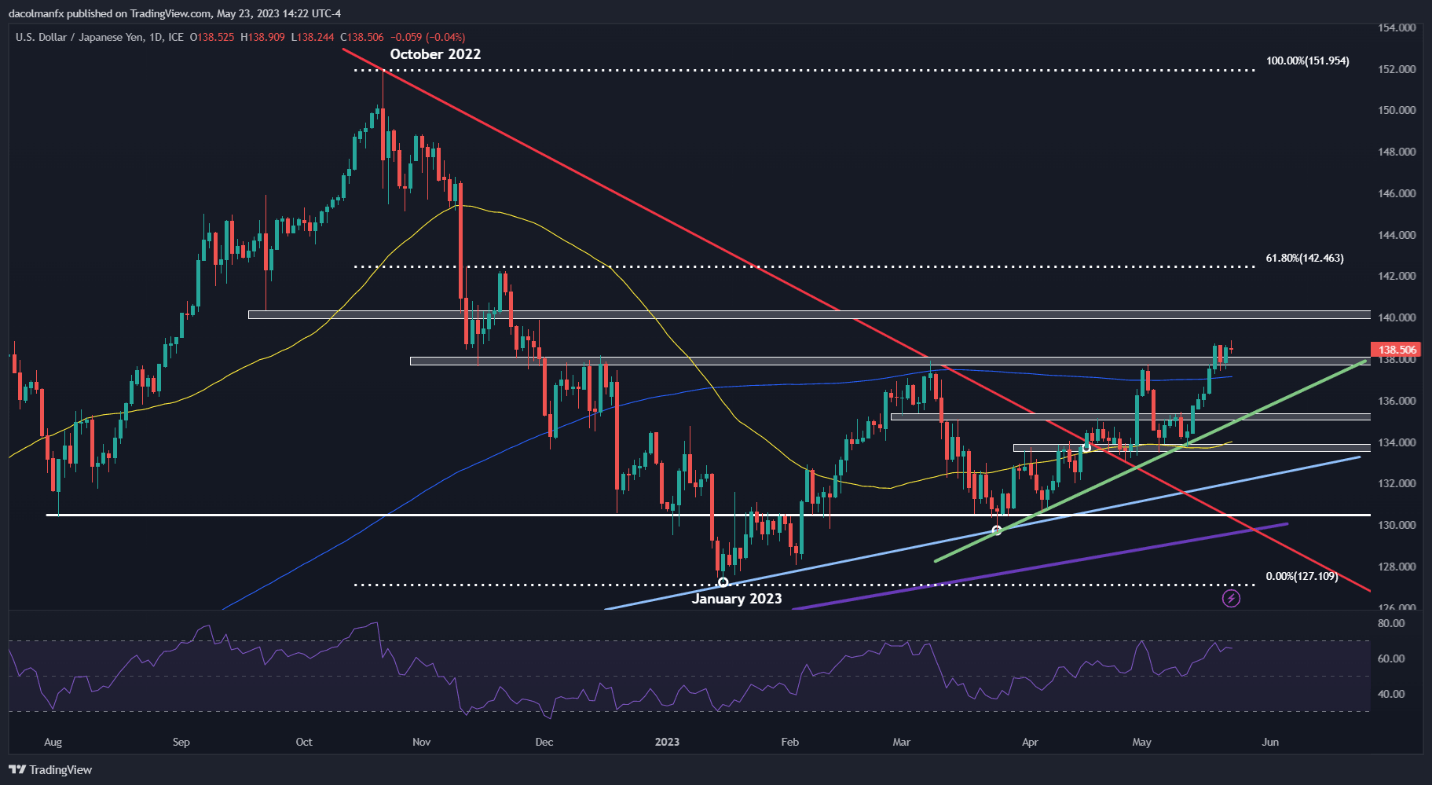
USD/JPY (US dollar – Japanese Yen) was cautious on Tuesday, moving between small gains and losses around the 138.50 level and showing signs of losing momentum following its stunning run over the past few weeks. For context, the pair has staged a solid rally since the beginning of the month, rising more than 3.4% after bouncing off its 50-day simple moving average – an important area of demand.

While USD/JPY’s technical outlook remains constructive, the pair may be in a consolidation phase for a few days, establishing a base around the 138.00 handle prior to the next leg higher. If this scenario plays out, prices may resume their ascent and challenge the psychological 140.00 level before the end of May. On further strength, the focus turns to 142.45, the 61.8% Fib retracement of the 2022/2023 slump.

Conversely, if the bears take advantage of market exhaustion and trigger a reversal, traders should watch support at 138.00, keeping in mind that a move below it could lead to a retest of the 200-day simple moving average. Sellers may struggle to breach this technical floor, but a breakdown could open the door for a pullback toward a short-term rising trendline at 135.00.

USD/JPY TECHNICAL CHART

A picture containing screenshot, diagram, line, plot  Description automatically generated 

AUD/JPY TECHNICAL ANALYSIS

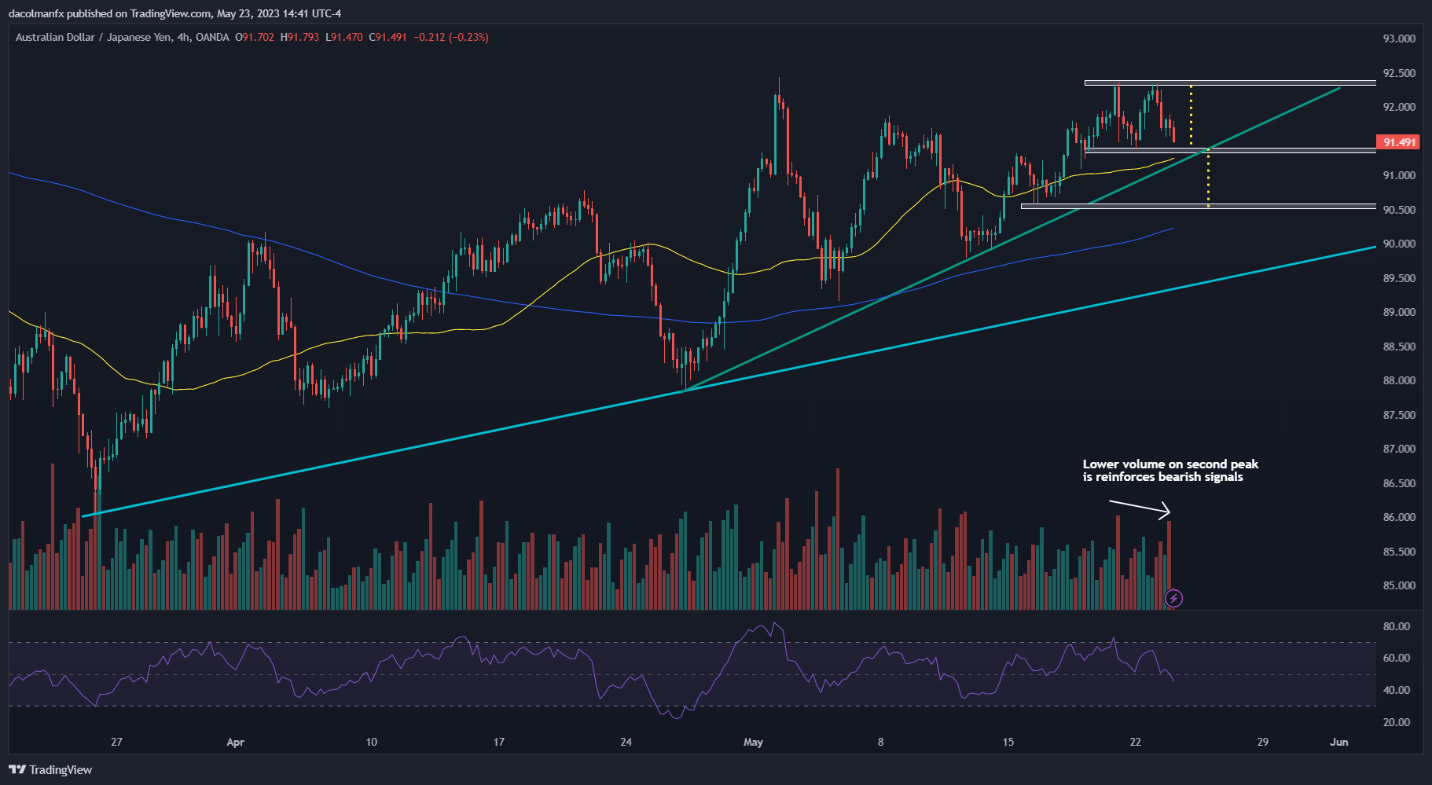
AUD/JPY (Australian dollar – Japanese yen) has been in a strong uptrend since late March, establishing higher highs and higher lows progressively, a clear indication that the bulls have been in control of the market for some time. Despite positive price action, buyers may have a reason to worry as the pair has been carving out a double top in recent weeks after failing to push above 92.35.

A double top is a reversal pattern that often develops in the context of an extended upward move, composed of two similar peaks separated by a depression. This bearish setup is confirmed once the price completes its “M” resembling shape and breaks below the technical support created by the formation’s intermediate through – the neckline.

In the case of AUD/JPY, the neckline sits at 91.40. If this floor caves in, a steep sell-off could follow in short order. The potential size of the downward retracement can be quantified by projecting vertically the height of the double top from the break point. This indicates the possibility of a decline towards 90.55 in the near term.

AUD/JPY TECHNICAL CHART

A screenshot of a computer screen  Description automatically generated with low confidence

Gold and Silver Price Outlook: XAU/USD, XAG/USD May Fall as Retail Crowd Goes Long

Gold and Silver Price Outlook: XAU/USD, XAG/USD May Fall as Retail Crowd Goes Long

Gold and silver prices continued aiming lower in recent days, accelerating a decline since finding a top in late April. By looking at IG Client Sentiment (IGCS), we can see how retail traders have been evolving their exposure in these precious metals. IGCS tends to function as a contrarian indicator, especially in trending markets. With that in mind, could further pain be in store for XAU/USD and XAG/USD?

Gold Sentiment Outlook – Bearish

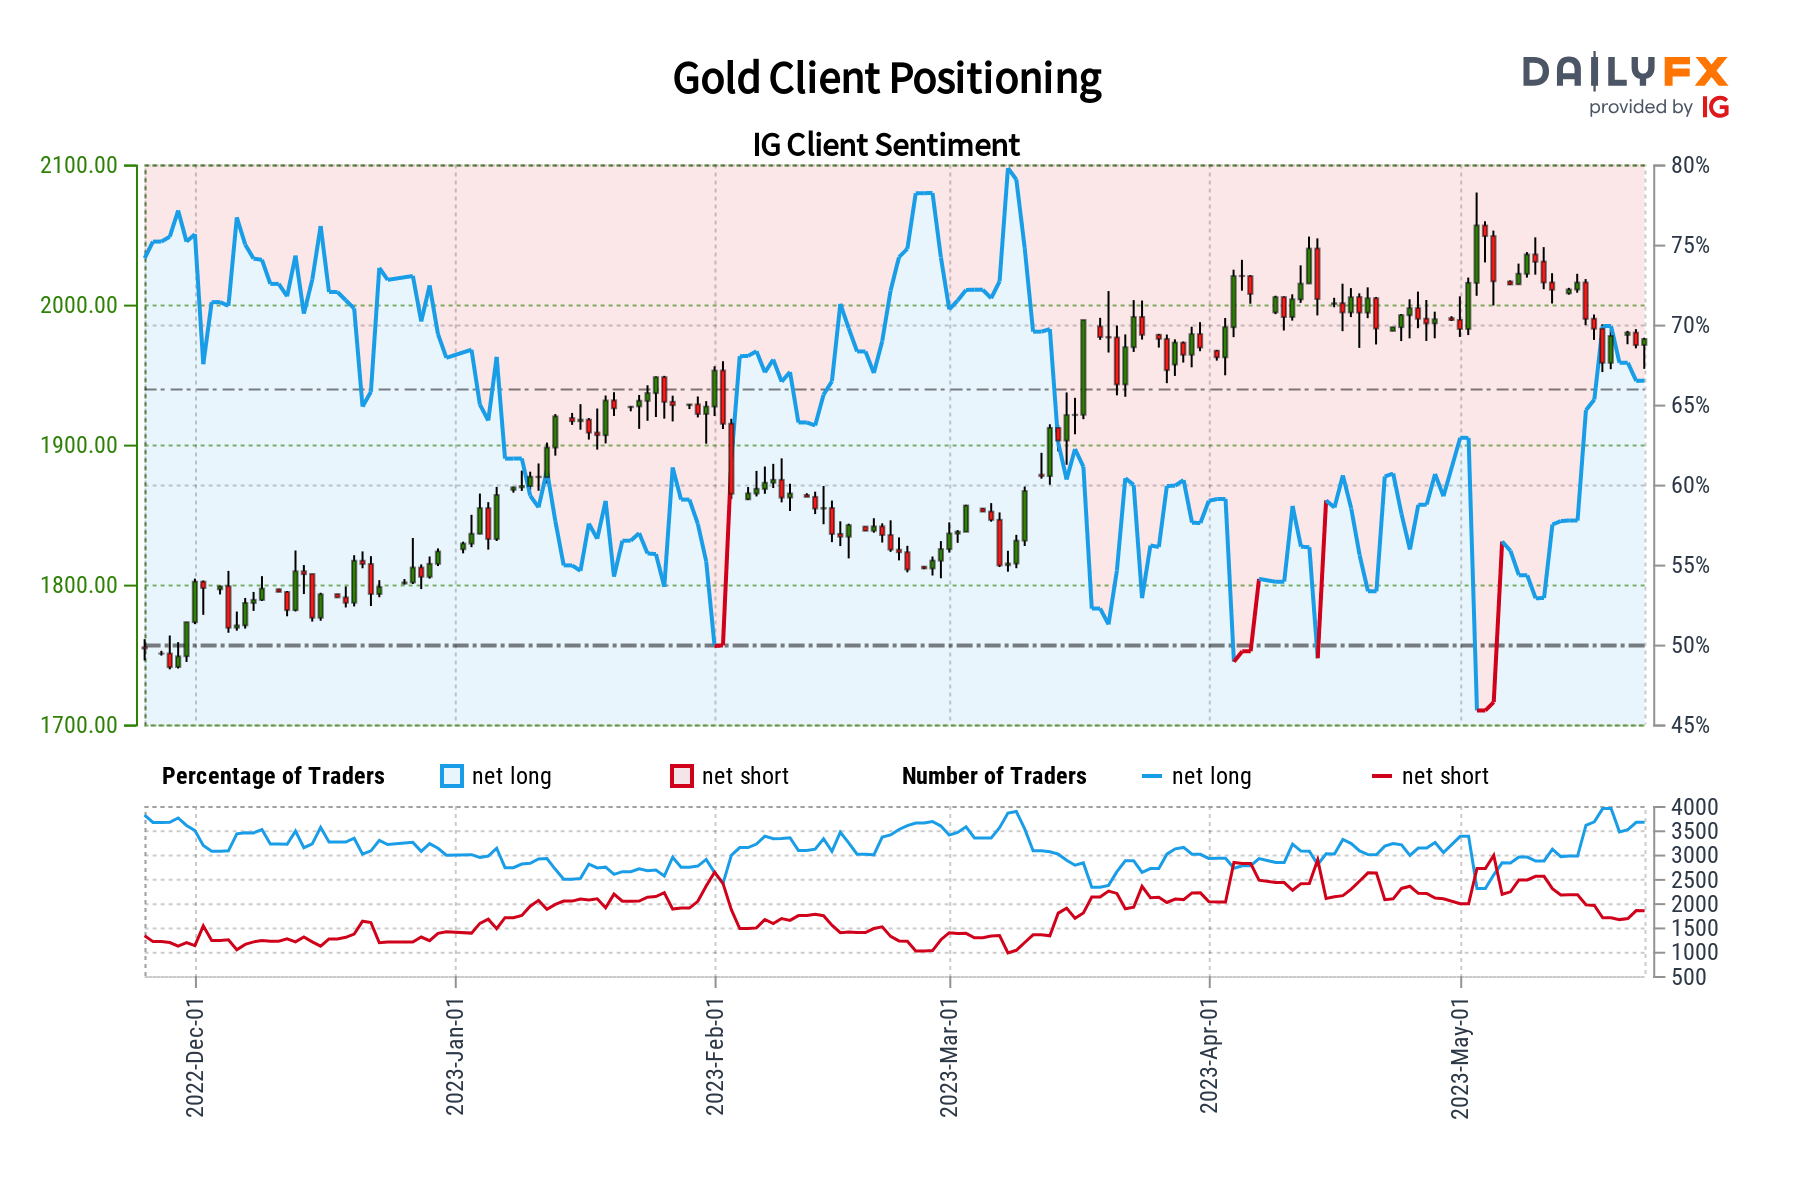
The IGCS gauge shows that about 66% of retail traders are net-long gold. Since most of them are biased higher, this hints that prices may continue falling. This is as upside exposure increased by 1.79% and 12.32% compared to yesterday and last week, respectively. With that in mind, the combination of current sentiment and recent changes offers a stronger bearish contrarian trading bias.

Gold Sentiment Outlook - Bearish

XAU/USD Daily Chart

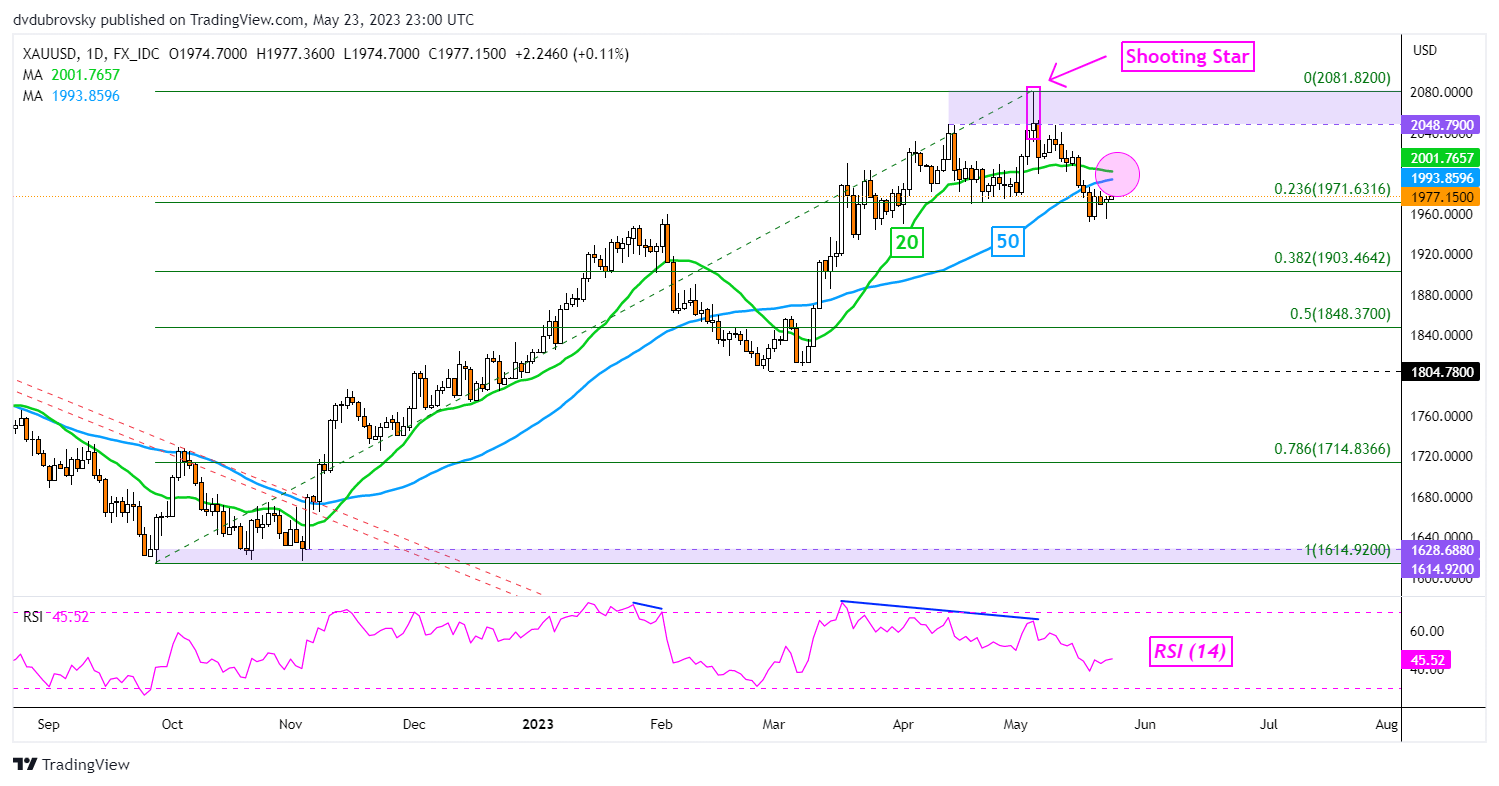
On the daily chart, a bearish Death Cross between the 20- and 50-day moving averages could be in store for gold. This is as prices are testing the 23.6% Fibonacci retracement level at 1971. Confirming a downside breakout exposes the 38.2% level at 1903. Otherwise, a turn higher places the focus on current 2023 highs, making for a wide range of resistance between 2048 – 2081.

XAU/USD Daily Chart

Silver Sentiment Outlook – Bearish

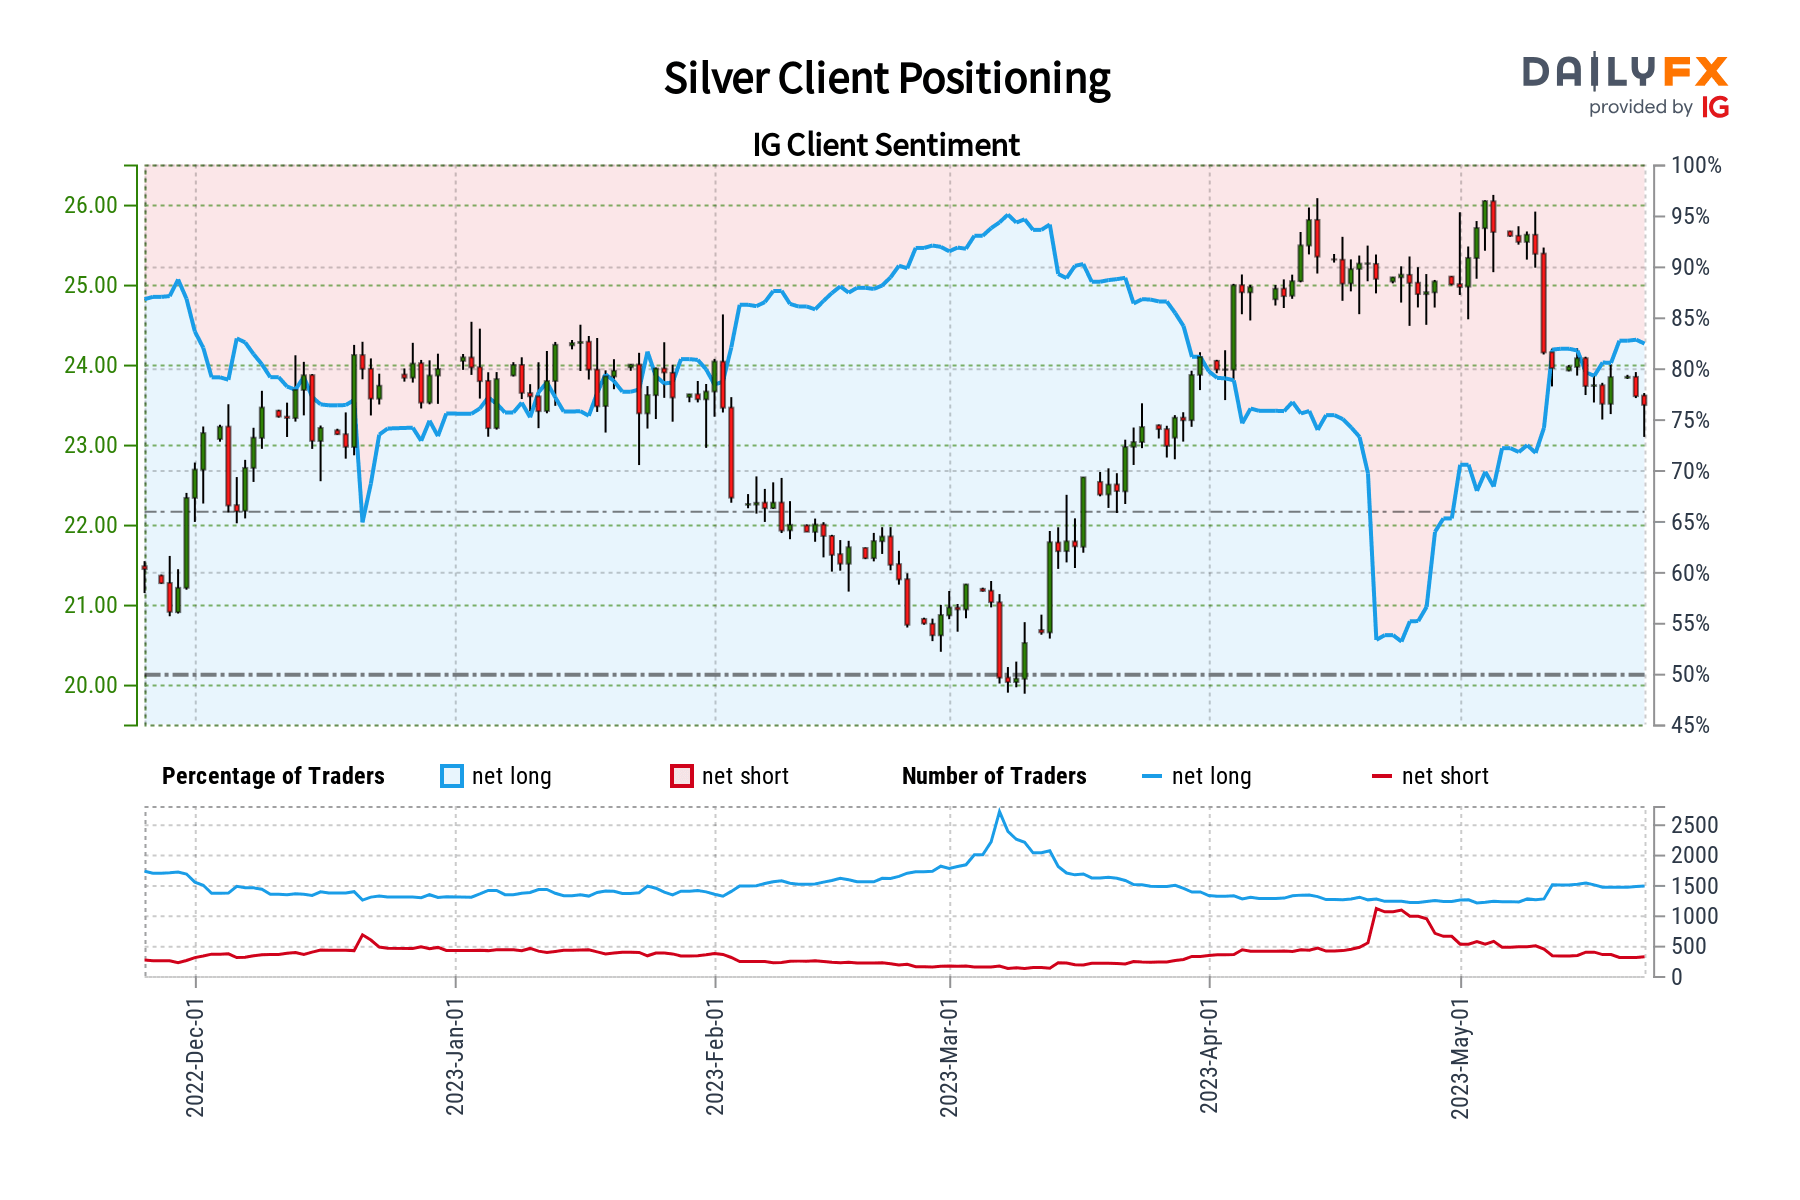
The IGCS gauge reveals that roughly 83% of retail traders are net-long silver. Since most of them are net-long, this hints that prices may continue falling. This is as downside exposure decreased by 2.6% and 24.81% compared to yesterday and last week, respectively. With that in mind, this is producing a stronger bearish contrarian trading bias.

Silver Sentiment Outlook - Bearish

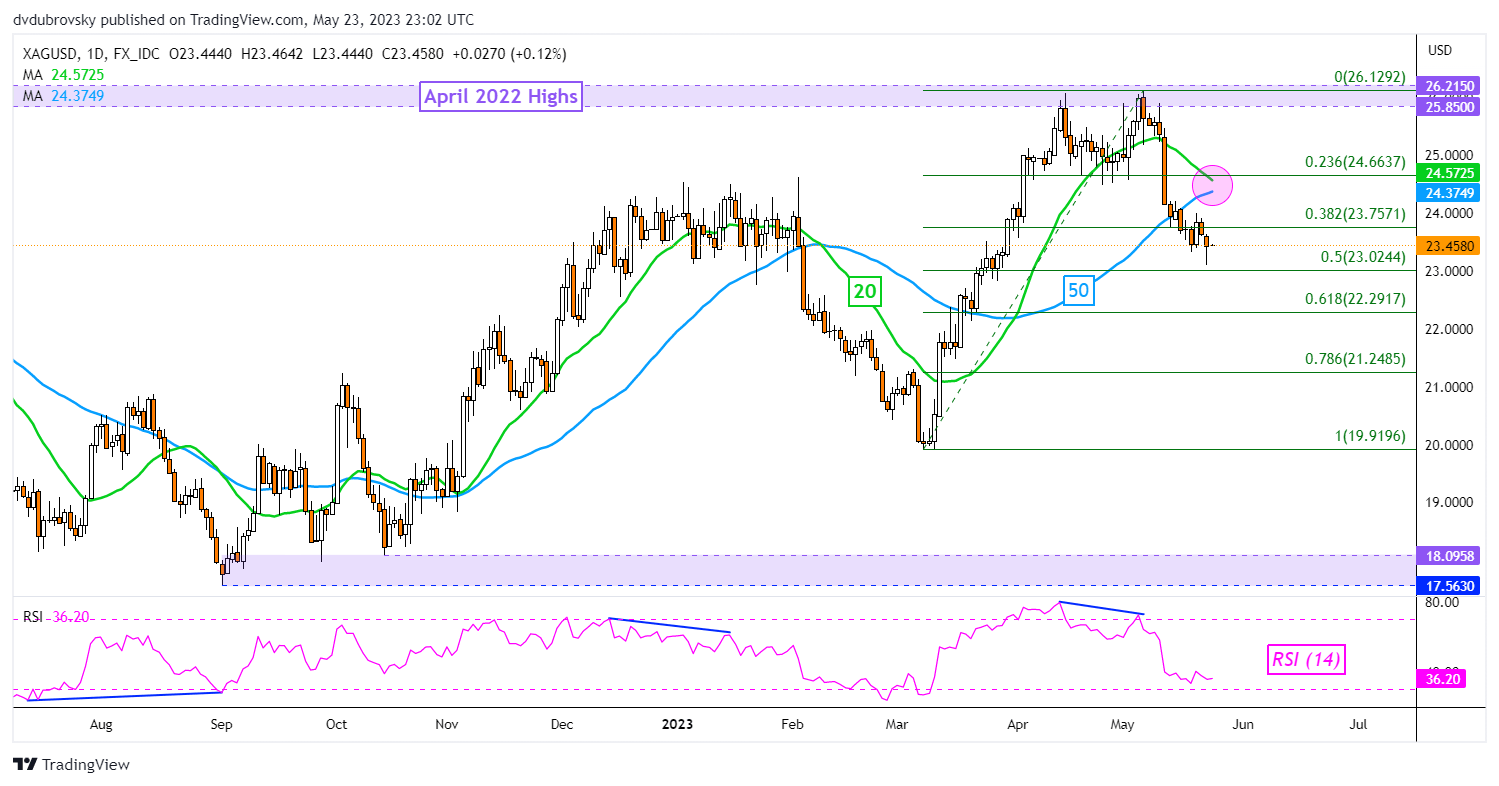
XAG/USD Daily Chart

A bearish Death Cross between the same moving averages may also be in store for silver soon. That would open the door to an increasingly downside technical bias. Immediate support is the midpoint of the Fibonacci retracement at 23.02. Extending lower exposes the 61.8% point at 22.2917. Otherwise, a turn higher places the focus on the 38.2% level at 23.757.

XAG/USD Daily Chart

US Dollar Steadies on Firm Treasury Yields Despite Debt Ceiling Risks. Higher USD?

US Dollar Steadies on Firm Treasury Yields Despite Debt Ceiling Risks. Higher USD?

The US Dollar found firmer footing going into Wednesday despite US debt talks appearing to have stalled on Tuesday.

The T-Bill market is displaying some nervousness around the so-called X-date identified by Treasury Janet Yellen to be June 1st. She has said that on that day Treasury may not be able to meet all its financial commitments.

The spread between the Bills maturing on May 30th and June 6th would normally trade within a few basis points of each other. There are currently around 400 basis points spread difference between these US Government short-term debt notes.

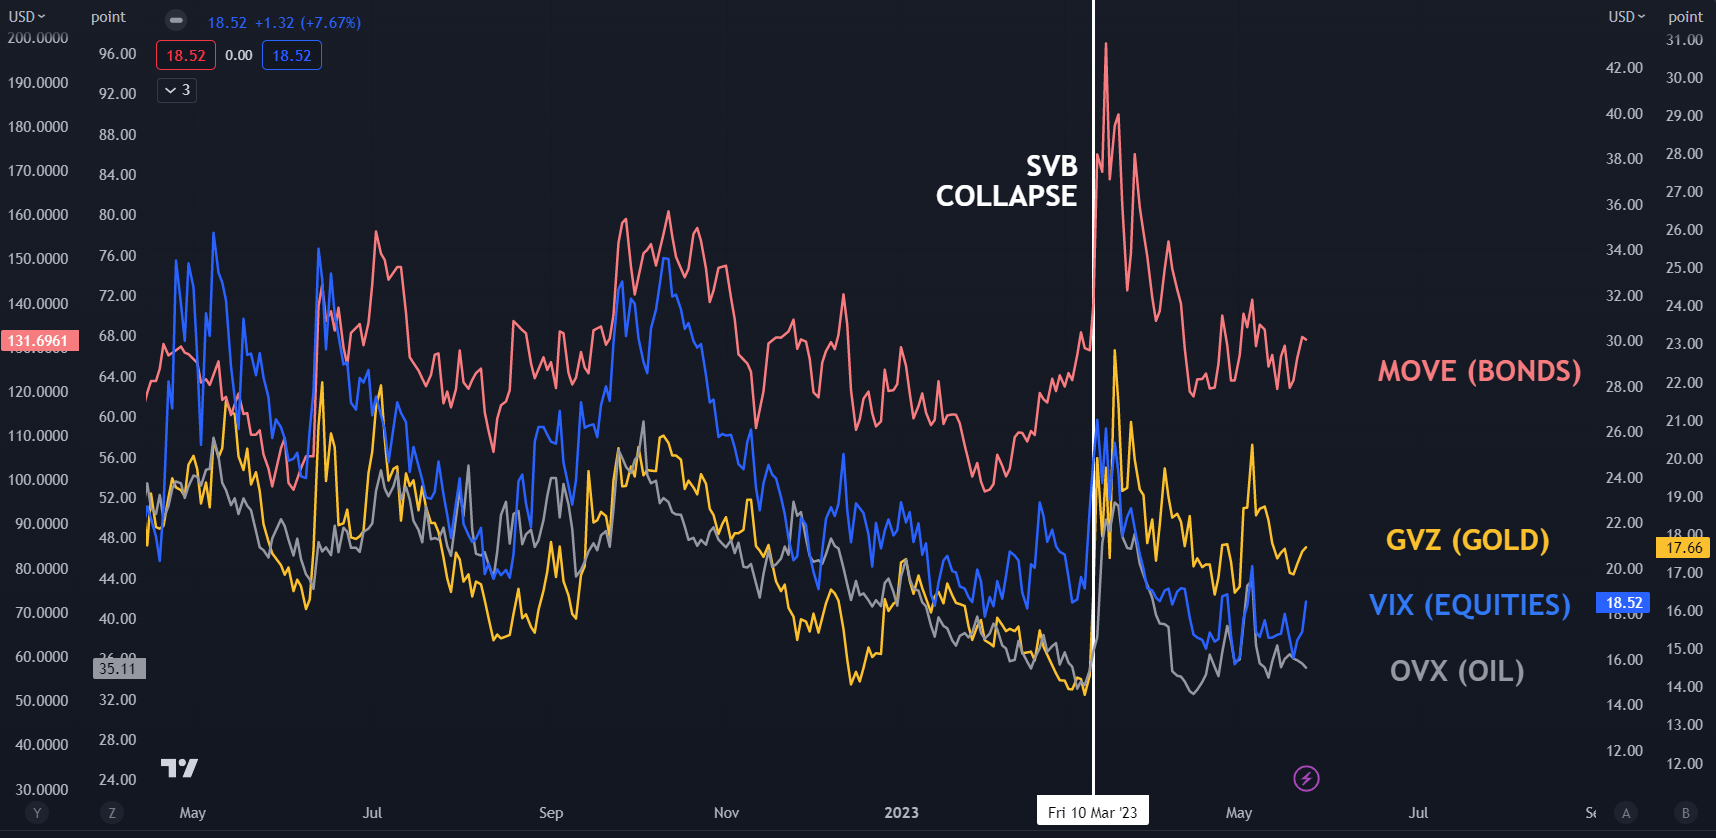
Conversely, broader markets don’t appear to be too concerned with volatility gauges across US equities, bonds, gold and oil remaining somewhat subdued as illustrated below. Not surprisingly, bond volatility might be slightly elevated compared to other markets but overall, currently benign compared to recent events.

CROSS MARKET VOLATILITY INDICES – VIX, MOVE, OVX, GVZ

image1.png

Chart created in TradingView

The collapse of Silicon Valley Bank Financial (SVB) evidently caused more anxiety in financial markets as reflected by the spike in volatility at the time.

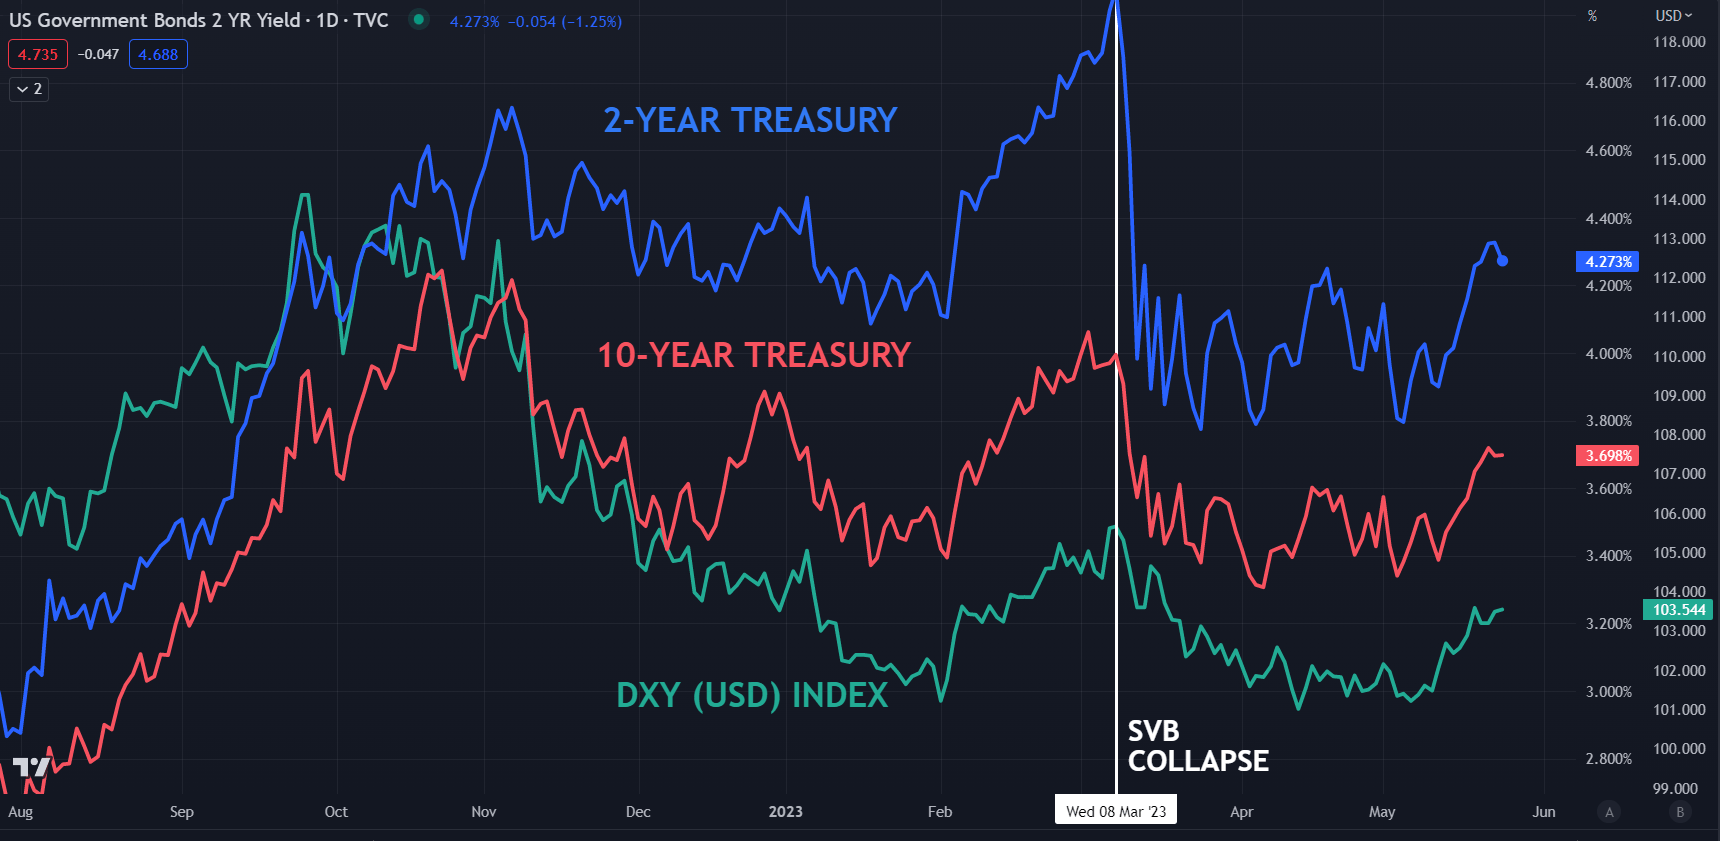
Treasury yields have been steady so far this week although they eased just slightly early Wednesday. Overall, they have recovered from the lows seen earlier this month across the curve and all tenors are now at their highest levels since the collapse of SVB.

The benchmark 2-year bond reached over 4.40% yesterday before easing after having traded at 3.66% earlier this month. Similarly, the 10-year note eclipsed 3.76% after touching 3.30% a few weeks ago.

The correlation between the DXY (USD) index and Treasury yield seems apparent in the chart below.

Looking at the chart above and below, the price movements around the SVB collapse and the growing concern surrounding the US debt ceiling appear to present patterns.

In times of crisis and uncertainty, correlations in financial markets tend to go toward 1 and -1 as the need to cover risk seems to outweigh the need to add risk.

For the US Dollar, a default on US debt could be a cataclysmic event that might see inter-market correlations break down.

Historically, USD has mostly been seen as a haven in times of chaos. If the US is the centre of financial market mayhem, these relationships may come under questioning.

US DOLLAR (DXY), US 2- AND 10-YEAR YIELDS

image2.png

New Zealand Dollar Slides as RBNZ Hikes by 25 Basis Points, But Sees Peak in Rates

New Zealand Dollar Slides as RBNZ Hikes by 25 Basis Points, But Sees Peak in Rates

The New Zealand dollar tumbled after the Reserve Bank of New Zealand (RBNZ) raised its benchmark rate by 25 basis points, in line with expectations, but signalled it may be done with tightening.

The New Zealand central bank was widely expected to hike the cash rate by 25 basis points to 5.5%, albeit a smaller hike than the 50 bps move in April on persistent price pressures. The pace of the tightening has slowed as the previous hikes spill over on to the economy – macro data has underwhelmed in recent months and consensus NZ economic growth expectations for this year have been downgraded sharply since April.

NZD/USD 5-minute Chart

image1.png

Chart Created Using TradingView

Some in the market had expected rates to peak at 5.75% in the cycle as inflation has moderated from a three-decade high of 7.3% to 6.7% but is still way above RBNZ’s 1%-3% target band just as the job market, including wage growth, remains strong.However, RBNZ’s acknowledgement that rates are at peak has weighed on NZD.

Meanwhile, risk sentiment has taken a back seat given limited progress in Washington to raise the US government’s debt ceiling, and the scaling back in expectations of a Fed rate cut this year after hawkish remarks from several Fed officials. Money markets expect the Fed to keep rates on hold at its next meeting in June but have pushed back rate the first rate cut to the end of the year from mid-2023.

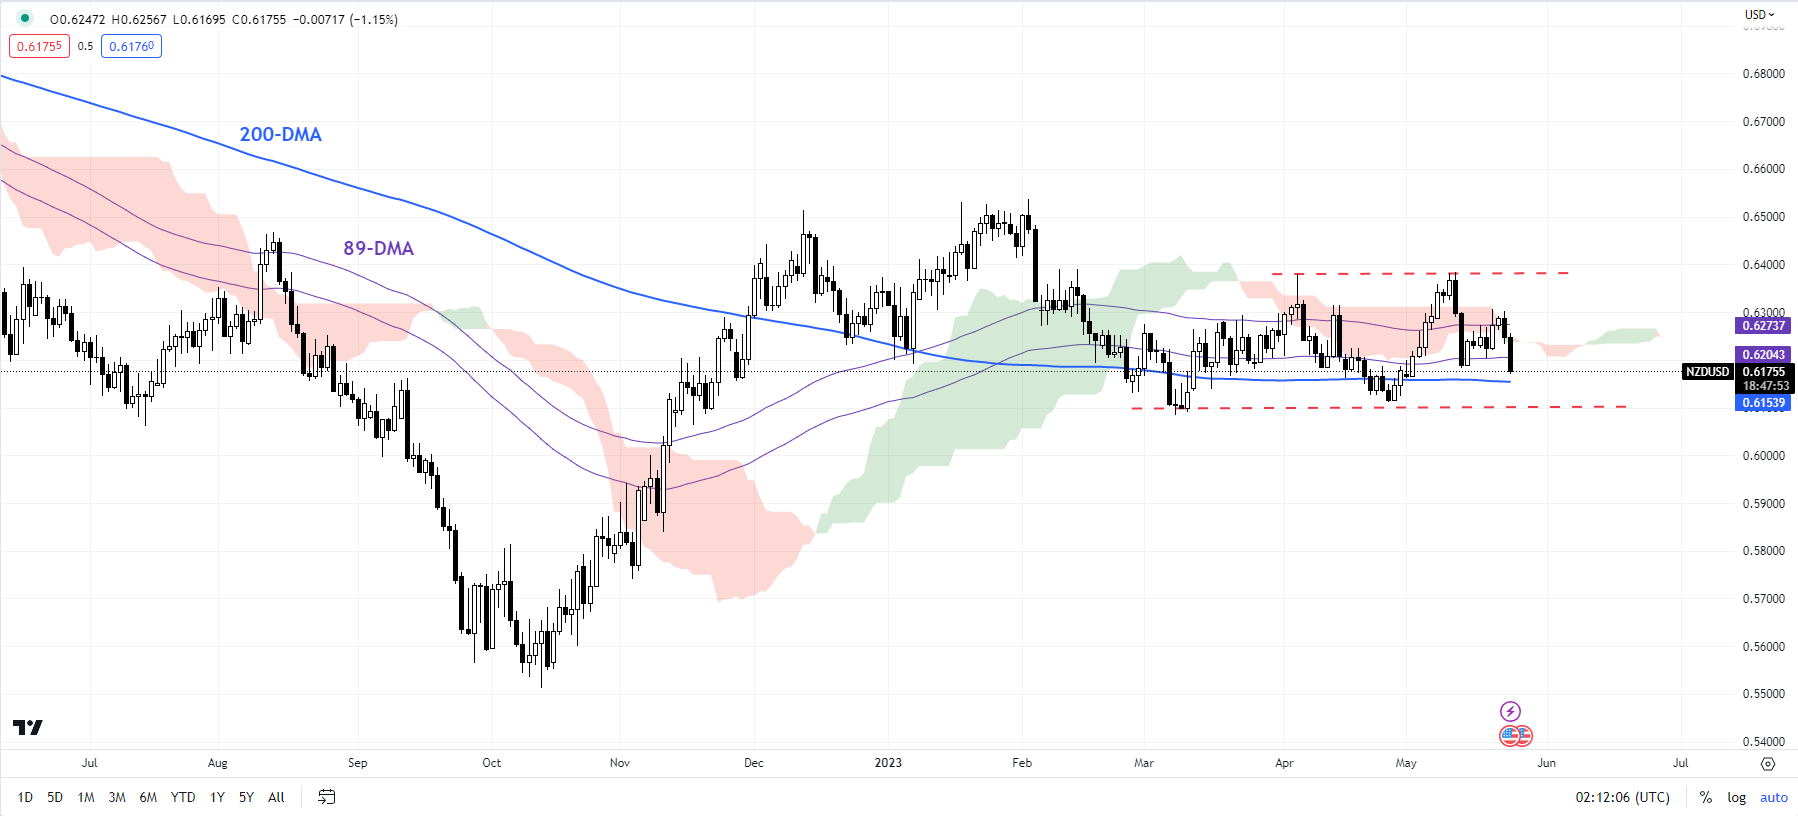
NZD/USD Daily Chart

image2.png

Chart Created Using TradingView

The risk-sensitive NZD/USD has pulled back as a result within its well-established range since March, pushing back bullish prospects highlighted in the previous update. See “Is the New Zealand Dollar Turning Corners? Price Setup in NZD/USD, AUD/NZD, GBP/NZD”, published May 12. Any break below the crucial support at the March low of 0.6085 would negate the optimistic outlook.

On technical charts, NZD/USD has been boxed in a 0.6085-0.6385 range since early March. Any breakout from the range could open the door for a 300-pip move – the price objective based on the width of the pattern.

How to Trade Forex News: An Introduction

How to Trade Forex News: An Introduction

Major economic data has the potential to drastically move the forex market. It is this very movement, or volatility, that most newer traders seek when learning how to trade forex news. This article covers the major news releases, when they occur, and presents the various ways traders can trade the news.

Why Trade the News on Forex?

Traders are drawn to forex news trading for different reasons but the biggest reason is volatility. Simply put, forex traders are drawn to news releases for their ability to move forex markets. ‘News’ refers to economic data releases such as GDP and inflation, and forex traders tend to monitor such releases considered to be of ‘high importance’.

The largest moves tend to follow a ‘surprise’ in the data – where the actual data contrasts what was expected by the market – the good news here is that you don’t have to hold a PhD in Economics because our economic calendar already provides economist expectations.

Furthermore, news releases are set at pre-determined dates and times allowing traders enough time to prepare a solid strategy.

Traders that can effectively manage the risks of volatility, at the predetermined time of the news release, are well on their way to becoming consistent traders.

The Impact of Major News Releases on the Forex market

Just before a major news release, it is common to witness lower trading volumes, lower liquidity and higher spreads, often resulting in big jumps in price. This is because large liquidity providers, much like retail traders, do not know the outcome of news events prior to their release and look to offset some of this risk by widening spreads.

While large price movements can make trading major news releases exciting, it can also be risky. Due to the lack of liquidity, traders could experience erratic pricing. Such erratic pricing has the potential to cause a huge spike in price that shoots through a stop loss in the blink of an eye, resulting in slippage.

Additionally, the wider spread could place traders on margin call if there isn’t enough free margin to accommodate this. These realities surrounding major news releases could result in a short trading career if not managed properly through prudent money management such as incorporating stop losses or guaranteed stop losses (where available).

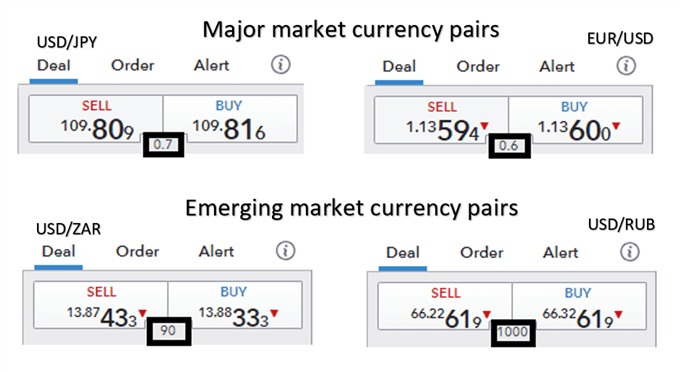
In general, major currency pairs will have lower spreads than the less traded emerging market currencies and minor currency pairs. Therefore, traders may look to trade the majors EUR/USD, USD/JPY, GBP/USD, AUD/USD and USD/CAD to mention a few.

General forex spreads between majors and emerging markets

Traders need to be well prepared ahead of time – with a clear idea of what events they want to trade and when they occur. It’s also important to have a solid trading plan in place.

“Don’t think about what the market’s going to do; you have absolutely no control over that. Think about what you’re going to do if it gets there. In particular, you should spend no time at all thinking about those rosy scenarios in which the market goes your way, since in those situations, there’s nothing more for you to do. Focus instead on those things you want least to happen and on what your response will be.” – William Eckhardt

Which Major Forex News Releases to Trade?

When learning how to trade news, traders must be aware of the major news events that affect the forex market, that can be monitored closely using an economic calendar.

US economic data is so influential within global currency markets that it is generally seen as the most important news. It is important to note that not all news releases lead to increased volatility. Rather, there are a limited number of major news releases that have previously produced the greatest potential to move the market.

The table below summarizes the major US economic releases alongside some of the most important non-US data releases from around the world.

Major news releases (US and rest of world):

Economic data release Time (EST) Description
Non-farm payrolls (NFP) 8:30am – monthly release (first Friday after the month ends) Represents the net changes in employment jobs
US Gross domestic product (GDP) 8:30am – quarterly release Gauges the monetary value of all goods and services produced within the US over a specified period
US Federal Reserve Bank Federal funds rate 1:00pm – scheduled 8 times a year Interest rate at which depository institutions lend and borrow to other institutions, overnight
Australian cash rate 10:30pm (First Tuesday of the month except January) Interest rate charged on overnight loans between financial intermediaries
Australian employment change 7:30pm – monthly release (about 15 days after month ends) Change in number of employed people during the previous month
European Central Bank refinancing rate 7:45am – 8 times a year Interest rate on the main refinancing operations offering liquidity to the financial system
Bank of England official bank rate 7:00am – monthly release Interest rate that the BOE lends to financial institutions (overnight)
Bank of Canada overnight rate 10:00am – 8 times a year Overnight rate that major financial institutions borrow and lend between themselves
Canadian employment change 8:30am – monthly (about 8 days after month ends) Measures the change in the number of employed people in the previous month
Reserve Bank of New Zealand official cash rate 9.00pm – scheduled 7 times a year Interest rate at which banks borrow and lend to other banks, overnight

Key Tools & Resources to Trade Forex News

DailyFX provides a one-stop-shop for all your forex related data and news releases:

  • Economic calendar: Know when major data like the US Non-Farm-Payroll, GDP, ISM, PPI and CPI figures are due to be released.
  • Central Bank Calendar: Central Bank interest rate decisions can have profound effect on the financial markets. Get to know when they are scheduled.
  • Real time news feed: Stay up to date with breaking news, as it happens, with updates from our top analysts. Similarly, get all the major stories of the day plus analysis by following our market news.

Managing risk when trading news and events

The importance of prudent risk management cannot be overstated during volatile periods that follow a news release.

The use of stops is highly recommended but in this case, traders may want to consider using guaranteed stops (where available) over normal stops. Guaranteed stops do come with a fee so be sure to check this with your broker; however, this fee can oftentimes end up being insignificant in relation to the amount of slippage that can occur in such volatile periods.

Additionally, traders should also look to reduce their normal trade size. Volatile markets can be a trader’s best friend but also have the potential to reduce account equity significantly if left unmanaged. Therefore, in addition to placing guaranteed stops, traders can look to reduce their trade sizes to manage the emotions of trading.

3 Approaches to forex news trading

There are a number of approaches traders can adopt when developing a forex news trading strategy which depend on the timing of the trade relative to the news release.

Many traders like to trade in the moment and make decisions as and when an announcement happens – using an economic calendar to plan ahead. Others prefer to enter the market in less volatile conditions ahead of a release or announcement. To summarize, forex news trading fits into one of the categories below:

  1. Trading before the news release
  2. Trading on the news release
  3. Trading after the news release

1. Trading before the news release  

Trading forex news before the release is beneficial for traders looking to enter the market under less volatile conditions. In general, traders who are more risk averse gravitate towards this approach looking to capitalize on the quieter periods before the news release by trading ranges or simply trading with the trend. Discover strategies on how to trade before the news release.

2. Trading during a release

These forex news trading strategies are not for the faint hearted as it involves entering a trade as the news breaks or in the moments that immediately follow. This is at a time when the market is at its most volatile which underscores the importance of having a clear strategy and well-defined risk management. Equip yourself with strategies to navigate the volatility associated with forex news trading at the release.


3. Trading after the news release

Trading post-release involves entering the trade after the market has had some time to digest the news. Often the market, through price action, provides clues on its future direction – presenting traders with great opportunity. Learn how to trade the news when the market is in transition with our article on trading after the news release.

BoE officials to testify on interest rate outlook

BoE officials to testify on interest rate outlook

OVERNIGHT

Asian equity market performance is mixed this morning as uncertainty persists about economic conditions. US President Biden and Congressional House Speaker McCarthy described talks on raising the Federal debt ceiling as “productive”. However, no agreement has yet been reached, which means that the possibility of a US debt default still overhangs markets. Meanwhile, US Federal Reserve policymakers made mixed comments yesterday over whether interest rate hikes would be ‘paused’ at their next policy update in June. The UK posted a £24.7bn public sector deficit in April close to double the level at the same point last year.

THE DAY AHEAD

Today’s May PMIs readings for the Eurozone, UK and the US will provide timely updates on the strength of activity in their respective economies as markets continue to grapple with the question of what will happen next to interest rates. In the UK, the April survey saw a pickup in the composite PMI measure, which combines manufacturing and services, to its highest for a year and we expect only a modest pullback in May. That highlights the risk that growth is not slowing by enough to ease domestic inflationary pressures.

The outturns for the US and the Eurozone are also expected to show activity continuing to rise at a faster pace than was expected at the start of the year. The surveys in all three areas also continue to show uneven growth with services much stronger than manufacturing.

Bank of England Governor Bailey and several of his colleagues on the Monetary Policy Committee are scheduled to testify to a House of Common’s Committee today. The focus will be on the BoE’s May Monetary Policy Report and the MPC’s decision to raise interest rates by another 25 basis points. The session comes a day ahead of the release of the latest inflation data. Nevertheless, markets will be looking for indications whether interest rates are likely to be raised further in June particularly given that the Report highlighted concerns that inflation is proving stickier than expected.

April CPI data for the UK will be released early Wednesday. It is expected to show annual inflation falling to 8.4% from 10.1% in March largely due to energy prices. In contrast, core inflation is forecast to be unchanged at 6.2%. Headline inflation is set to fall considerably further this year due to lower energy and food prices but a key issue for the BoE is to what extent domestic inflationary pressures, particularly those emanating from a tight labour market, are set to ease.

MARKETS

US Treasury yields rose again yesterday reflecting uncertainty about the interest rate environment and about the debt ceiling negotiations. UK gilt yields also rose to touch their highest level for the year. In currency markets, sterling fell slightly against both the euro and the US dollar as today’s comments form BoE officials were nervously awaited.

Never miss an update. Receive insights directly to your inbox or Telegram app: