May data signalled another solid increase in private sector output, but the speed of expansion slowed since April. UK economic growth remained centred on the service sector, with travel, leisure and hospitality businesses widely commenting on resilient consumer demand. In contrast, manufacturing firms indicated the steepest reduction in production levels for four months. The headline seasonally adjusted S&P Global / CIPS Flash UK Composite Output Index registered 53.9 in May, down from April’s 12-month high of 54.9 but still above the crucial 50.0 no-change threshold. The latest reading pointed to a solid
Infighting and inflation: UK on verge of nervous breakdown
Rishi Sunak has managed to last 200 days as UK prime minister. That is four times as long as his predecessor Liz Truss. But the fragility of the party that he leads is such that knives are out on the back benches. In a way, it has nothing to do with him. No matter how well he performs, the Conservative party is in the throes of a nervous breakdown. You do not have to take my word for it. There are telltale signs.
The first sign is the loss of seats and councils at the local elections on 4 May. Normally, the party in power always loses seats. The test is how many and how badly. Not being a seasoned politician, Sunak ventured a prediction which proved somewhat optimistic – or rather not pessimistic enough. A seasoned operator would have sounded much gloomier, predicting a big loss and then hailing the actual loss as a triumph.
Divisions over Brexit
Given the record of the 2019 Tory government, which has already had three prime ministers (five since 2015), the deep malaise of the UK’s oldest party is obvious. You can see it in the recent put-down of Kemi Badenoch, secretary of state for business, energy and industrial strategy, by the speaker in the House of Commons. This has to do with the inner party warfare continuing from the UK’s departure from the European Union.
During the party leadership contest in July and August, Sunak made a promise to cancel all legislation which had come from the EU. Wiser counsels have prevailed and the Retained EU Law (Revocation and Reform) Bill has been watered down. So now a restricted list is being piloted through. That has led to anger and cries of betrayal from the Brexiteers on the Tory back benches. The party is deeply divided even now on Brexit and Sunak is being accused of abandoning his anti-EU stance.
The problem is that issues which look clear cut from the back benches begin to look complex from the prime minister’s perspective. Cancelling all EU legislation may not look as attractive from the front bench as it does from the back.
Inflation persists
But Sunak also needs to deliver on issues such as inflation. H has promised to reduce inflation to half of its current rate and then possibly introduce a tax cut, just like Margaret Thatcher’s government. But that is misreading the history of the Thatcher era.
In the 20-year period from 1970-90, when we had a parallel situation of high inflation, Thatcher did not try to try to win votes with promises of tax cuts. The monetarist experiment was a failure as money supply was difficult to control. It was the capitalists taking their industries to Asia to find cheap labour and lower prices of imported manufacturing goods which brought down inflation. Then, after eight years in power, Thatcher allowed Chancellor of the Exchequer Nigel Lawson to cut income tax.
What this proved is that, while central banks and monetarists thought of inflation in a closed economy macroeconomic framework, the cause as well as cure pointed towards an open economy. Neither central banks nor Sunak have realised this. The chances of successfully bringing down inflation by the BoE increasing interest rates are slim.
Brexit has failed to restore prosperity or relieve the crisis of immigration, which is still haunting the Tories and Home Secretary Suella Braverman. The anger has now turned towards the House of Lords, which amends the bad legislation sent from the Commons. There is talk of removing the House of Lords. If that happens, it will be the radical right fulfilling the dreams of the radical left.
The convergence of the two extremes indicates that the malaise goes very deep. Sunak has become prime minister at an historic moment of nervous breakdown in the UK. The coronation of King Charles III brought a welcome distraction. But even there, Penny Mordaunt, Sunak’s leadership rival, stole the show and pointed out that she is ready to take over the job.
Meghnad Desai is Emeritus Professor of Economics at the London School of Economics and Political Science, Chair of the OMFIF Advisory Council and Crossbench Peer in the House of Lords. He resigned from the Labour party in 2020 after 49 years of membership.
Flash PMI drops to 3-month low: accelerating downtrend in industry outweighs growth in the service sector
Eurozone private sector expanded for the fifth consecutive month in May, remaining up in the second quarter of 2023 robust growth course. That’s according to the latest S&P HCOB Flash Eurozone Composite PMI survey. that the growth rate compared to April was due to the fact that incoming orders almost stagnated and the upswing was increasingly uneven. The strong growth in the service sector contrasted with a accelerated decline in industrial production, which in turn reflects the increasing divergence in demand for goods and services. Inflation trends also diverged across sectors.
Euro area monthly balance of payments: March 2023
Chart 1
Euro area current account balance
(EUR billions unless otherwise indicated; working day and seasonally adjusted data)
Source: ECB.
The current account of the euro area recorded a surplus of €31 billion in March 2023, an increase of €7 billion from the previous month (Chart 1 and Table 1). Surpluses were recorded for goods (€41 billion) and services (€5 billion). Deficits were recorded for secondary income (€14 billion) and primary income (€1 billion).
Table 1
Current account of the euro area
(EUR billions unless otherwise indicated; transactions; working day and seasonally adjusted data)
Source: ECB. Note: Discrepancies between totals and their components may be due to rounding.
Data for the current account of the euro area
In the 12 months to March 2023, the current account recorded a deficit of €76 billion (0.6% of euro area GDP), compared with a surplus of €189 billion (1.5% of euro area GDP) one year earlier. This development was mainly driven by a switch from a surplus (€181 billion) to a deficit (€4 billion) for goods, a switch from a surplus (€49 billion) to a deficit (€19 billion) for primary income, and, to a lesser extent, by a larger deficit for secondary income (up from €156 billion to €164 billion) and a reduction in the surplus for services (down from €115 billion to €111 billion).
Chart 2
Selected items of the euro area financial account
(EUR billions; 12-month cumulated data)
Source: ECB. Notes: For assets, a positive (negative) number indicates net purchases (sales) of non-euro area instruments by euro area investors. For liabilities, a positive (negative) number indicates net sales (purchases) of euro area instruments by non-euro area investors.
In direct investment, euro area residents made net disinvestments of €179 billion in non-euro area assets in the 12 months to March 2023, following net investments of €109 billion one year earlier (Chart 2 and Table 2). Non-residents disinvested €328 billion in net terms from euro area assets in the 12 months to March 2023, following net disinvestments of €85 billion one year earlier.
In portfolio investment, euro area residents’ net sales of non-euro area equity amounted to €149 billion in the 12 months to March 2023, following net purchases of €186 billion one year earlier. Over the same period, net sales of non-euro area debt securities by euro-area residents amounted to €32 billion, following net purchases of €321 billion one year earlier. Non-residents’ net purchases of euro area equity decreased to €135 billion in the 12 months to March 2023, down from €485 billion one year earlier. Over the same period, non-residents made net purchases of euro area debt securities amounting to €27 billion, following net sales of €187 billion one year earlier.
Table 2
Financial account of the euro area
(EUR billions unless otherwise indicated; transactions; non-working day and non-seasonally adjusted data)
Source: ECB. Notes: Decreases in assets and liabilities are shown with a minus sign. Net financial derivatives are reported under assets. “MFIs” stands for monetary financial institutions. Discrepancies between totals and their components may be due to rounding.
Data for the financial account of the euro area
In other investment, euro area residents recorded net acquisitions of non-euro area assets amounting to €35 billion in the 12 months to March 2023 (down from €424 billion one year earlier), while they recorded net disposals of liabilities amounting to €176 billion (following net acquisitions of €816 billion one year earlier).
Chart 3
Monetary presentation of the balance of payments
(EUR billions; 12-month cumulated data)
Source: ECB. Notes: “MFI net external assets (enhanced)” incorporates an adjustment to the MFI net external assets (as reported in the consolidated MFI balance sheet items statistics) based on information on MFI long-term liabilities held by non-residents, available in b.o.p. statistics. B.o.p. transactions refer only to transactions of non-MFI residents of the euro area. Financial transactions are shown as liabilities net of assets. “Other” includes financial derivatives and statistical discrepancies.
The monetary presentation of the balance of payments (Chart 3) shows that the net external assets (enhanced) of euro area MFIs increased by €39 billion in the 12 months to March 2023. This increase was mainly driven by euro area non-MFIs’ net inflows in portfolio investment equity and portfolio investment debt, and the current and capital accounts surplus. These developments were partly offset by euro area non-MFIs’ net outflows in direct investment and other investment.
In March 2023 the Eurosystem’s stock of reserve assets increased to €1,133.1 billion, up from €1,096.2 billion in the previous month (Table 3). This increase was driven by positive price changes (€42.8 billion), primarily for monetary gold, and, to a lesser extent, by net acquisitions of assets (€1.6 billion) which were partly offset by negative exchange rate changes (€7.9 billion).
Table 3
Reserve assets of the euro area
(EUR billions; amounts outstanding at the end of the period, flows during the period; non-working day and non-seasonally adjusted data)
Source: ECB. Notes: “Other reserve assets” comprises currency and deposits, securities, financial derivatives (net) and other claims. Discrepancies between totals and their components may be due to rounding. “Other volume changes”, which mainly reflects reclassifications and data enhancements, is not shown.
Data for the reserve assets of the euro area
Data revisions
This press release incorporates revisions to the data for January and February 2023. These revisions did not significantly alter the figures previously published.
Fed’s Kashkari: Don’t Want to Declare We’re Done Raising Rates; May Have to Go Higher From Here
*Fed’s Kashkari: Don’t Want to Declare We’re Done Raising Rates
*Fed’s Kashkari: May Have to Go Higher From Here on Rates
*Fed’s Kashkari: We Are on Mission to Get Inflation Down
*Fed’s Kashkari: US Economy at Stake Over Debt-Ceiling Issue
— *seven (@sevenloI) May 22, 2023
EUR/USD stays depressed around 1.0800 ahead of EU PMIs
EUR/USD is trading on the defensive at around 1.0800 in early Europe. The pair is struggling for a clear direction amid a broadly firmer US Dollar while awaiting the Euro area and the US business PMIs. Monday’s US debt-ceiling meeting ended without a deal.
From a technical perspective, the EUR/USD pair’s inability to build on the recent bounce from its lowest level since March 27 warrants some caution for bullish traders. Moreover, oscillators on the daily chart are holding in the negative territory and are still far from being in the oversold zone. This, in turn, suggests that the path of least resistance for spot prices is to the downside and supports prospects for a further near-term depreciating move.
That said, any subsequent slide is more likely to find some support near last week’s swing low, around the 1.0760 region. This is closely followed by the 61.8% Fibonacci retracement level of the March-May rally, around the 1.0735 zone, which if broken will set the stage for an extension of the downfall from over a one-year high touched earlier this month. The EUR/USD pair might then slide below the 1.0700 mark and test the next relevant support near the 1.0675-1.0670 horizontal zone before eventually dropping to the 1.0635 region en route to the 1.0600 round figure.
On the flip side, the immedaite hurdle is pegged near the 1.0840 horizontal zone ahead of the 1.0870 region, or the 38.2% Fibo. level. A sustained strength beyond might shift the bias back in favour of bullish traders and trigger aggressive technical buying. The EUR/USD pair might then climb further beyond the 1.0900 mark and aim to test the 1.0955-1.0960 support breakpoint, now turned resistance, which coincides with the 23.6% Fibo. level.
Despite the less hawkish remarks by Federal Reserve (Fed) Chair Jerome Powell, investors seem convinced that the US central bank is likely to continue hiking interest rates. In fact, Powell said on Friday that tighter credit conditions could mean fewer rate hikes. That said, St. Louis Fed President James Bullard said on Monday that the Fed may still need to raise its benchmark interest rate by another half-point this year. Furthermore, Minneapolis Fed President Neel Kashkari also said it was a close call whether he would vote to raise interest rates or to pause the central bank’s tightening cycle when it meets next month.
Separately, Atlanta Fed President Raphael Bostic said he was comfortable waiting a little bit before deciding on any further moves. Meanwhile, Richmond Fed President Thomas Barkin said he was still looking to be convinced that inflation is in a steady decline. Nevertheless, the outlook pushes back against expectations for rate cuts by the Fed later this year and remains supportive of elevated US Treasury bond yields, which, in turn, continues to underpin the buck. Adding to this, worries over slowing global growth, particularly in China, and the US debt ceiling impasse further benefits the Greenback’s relative safe-haven status. In fact, US President Joe Biden and House Speaker Kevin McCarthy ended discussions on Monday with no agreement on how to raise the US government’s $31.4 trillion debt ceiling and will keep talking just 10 days before a possible default.
The downside for the EUR/USD pair, however, seems cushioned, at least for the time being, amid expectations for more interest rate hikes by the European Central Bank (ECB) in the coming months. The bets were lifted by ECB President Christine Lagarde’s comments on Monday, saying that the journey toward taming inflation and bringing it back to the target isn’t over yet. Adding to this, ECB Governing Council Pablo Hernandez de Cos noted that interest rates will have to remain in restrictive territory for a long time to reach the inflation target in a sustained manner. Moreover, ECB Governing Council member Francois Villeroy de Galhau reiterated that the central bank’s policy rate is expected to reach its peak no later than by summer. This, in turn, is holding back traders from placing aggressive bearish bets around the major and helping to limit any meaningful depreciating move.
Market participants now look forward to the release of the flash PMI prints from Europe and the US for a fresh impetus. The US economic docket also features New Home Sales data and the Richmond Manufacturing Index. This, along with the US bond yields and the broader market risk sentiment, will influence the USD price dynamics and allow traders to grab short-term opportunities around the EUR/USD pair. The focus, however, will remain glued to the US debt ceiling negotiations and the crucial FOMC meeting minutes, due on Wednesday. Investors this week will also confront the release of the Preliminary (second estimate) US Q1 GDP report on Thursday, followed by the Core PCE Price Index – the Fed’s preferred inflation gauge – and Durable Goods Orders on Friday. This will play a key role in driving the USD demand and determine the near-term trajectory for the major.
Gold Price Finds Traction as US Dollar Pauses Despite Higher Yields
The gold price dipped to a 2-month low last week but has since consolidated with the US Dollar appreciation pausing from its recent run higher.
Treasury yields have been supportive of the ‘big dollar’ with the benchmark 2-year bond clipping 4.35% on Friday and again this week after having traded at 3.66% earlier this month.
Similarly, the 10-year note is trading above 3.7% after touching 3.30% a few weeks ago. Perhaps the focus for gold traders though is the rise of US real yields.
The real yield is the nominal yield less the market-priced inflation rate derived from Treasury inflation-protected securities (TIPS) for the same tenor.
The US 10-year real yield is currently eyeing a move over 1.50%. Of some concern for gold bulls, when it was at this level prior to the collapse of Silicon Valley Bank Financial et al, gold was below US$ 1,850.
Going into Tuesday’s session, the debt ceiling issue in the US appears to be finally heading in the right direction. After talks on Monday, President Joe Bidden and House Speaker Kevin McCarthy have both said that a default is not on the cards.
While the news is mostly welcomed, markets appear to be waiting for further clarity with little price response across markets thus far.
The US Dollar has been gathering some bullish momentum of late and direction in the DXY (USD) Index might lead the precious metal on its next move.
GC1 (GOLD FUTURES), US 10-YEAR REAL YIELD, DXY (USD) INDEX
GC1 (GOLD FRONT FUTURES CONTRACT) TECHNICAL ANALYSIS
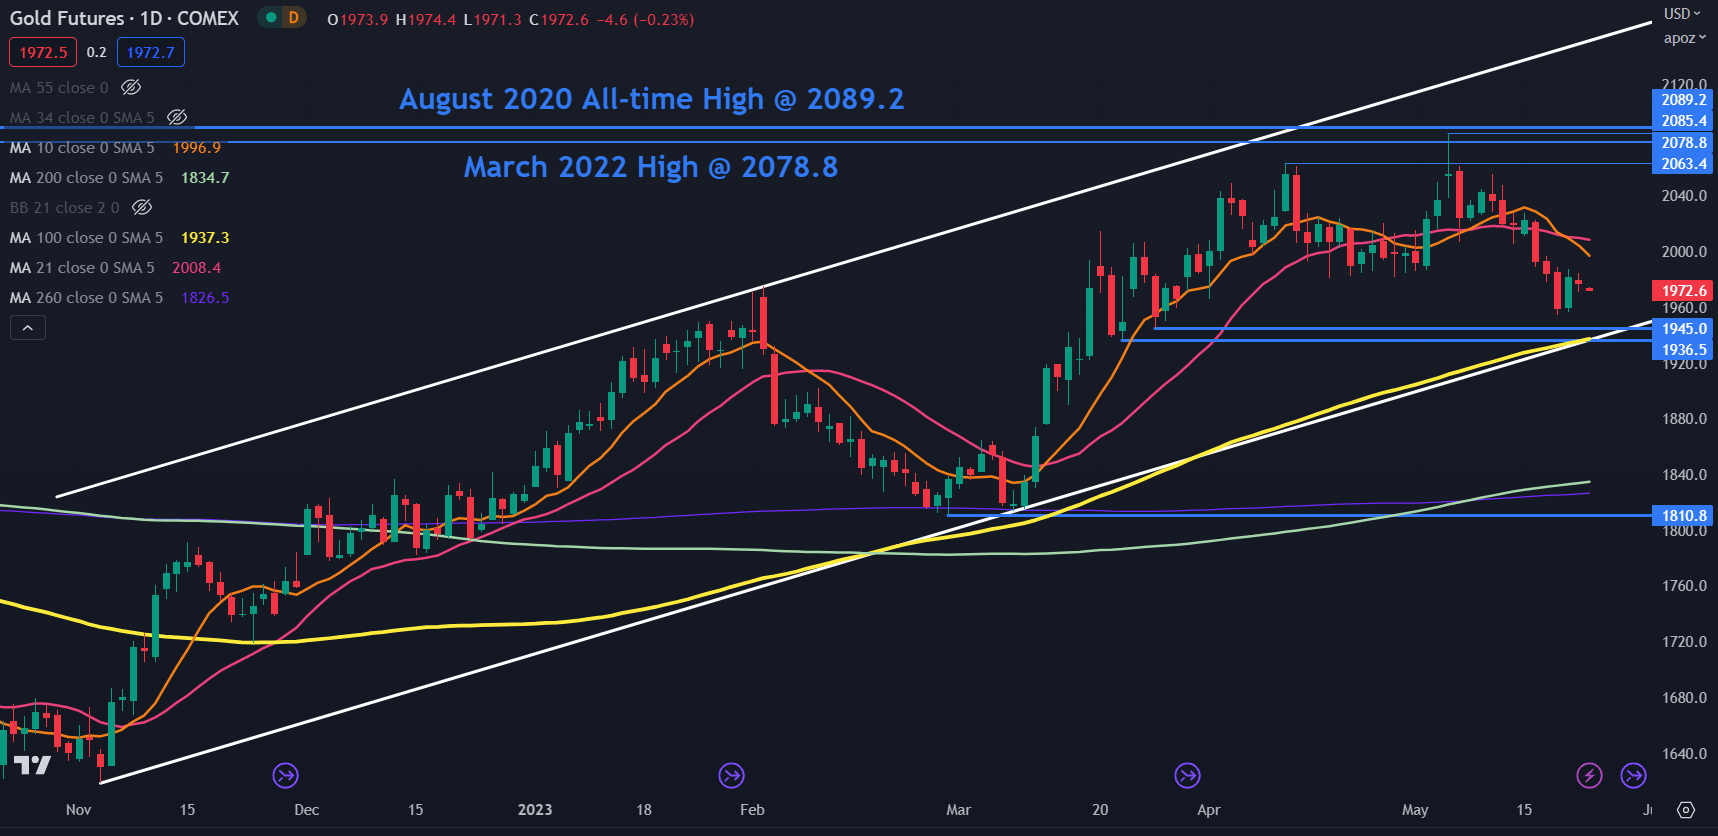
Gold remains in an ascending trend channel that began in November last year.
At the start of this month, GC1 made a high of 2085.4 after clearing the March 2022 peak of 2078.8 but fell short of overcoming the all-time high of 2089.2. The wholesale spot price of gold has also seen a similar setup.
This may indicate that the 2080 – 2090 area might offer a resistance zone. This is also a Triple Top which is an extension of a Double Top formation. It could indicate that there is strong resistance at those levels. A move above 2090 would be needed to dismantle this formation.
A break above there may open the way for a test of the ascending trend line, currently dissecting at 2150.
On the downside, support might be provided at the prior lows of 1945.0 and 1936.5 ahead of the ascending trend that currently lies at 1935. The 100-day SMA is also in that vicinity and could add support near there.
USD Price Forecast: Debt Ceiling Optimism Supportive of Dollar Index (DXY)
USD FUNDAMENTAL BACKDROP
The Dollar Index (DXY) has been dancing to the tune of US debt ceiling negotiations and yesterday’s discussions prompted renewed optimism in global markets. The dollar ticked slightly higher and trades relatively flat this Tuesday morning. While no deal was struck, both representatives (president Joe Biden and House Speaker Kevin McCarthy) stated the talks were constructive; however, more negotiations will be required to avoid a default.
Yesterday included a slew of Fed speakers with the Fed’s Bullard surprising markets by calling for possibly two more interest rate hikes while Mr. Kashkari opted for a more cautious tone unsure of a pause or hike in the June meet. This slightly hawkish rhetoric has now cut down rate cut expectations as seen by the implied Fed funds futures below. Money markets are now pricing in roughly 34bps of rate cuts by year end as opposed to 41bps just yesterday. Limiting upside for the dollar has been aggressive ECB officials who have been ramping up monetary policy tightening dialogue – eurozone PMI will also add to the economic outlook for the region later this morning.
FEDERAL RESERVE INTEREST RATE PROBABILITIES
Source: Refinitiv
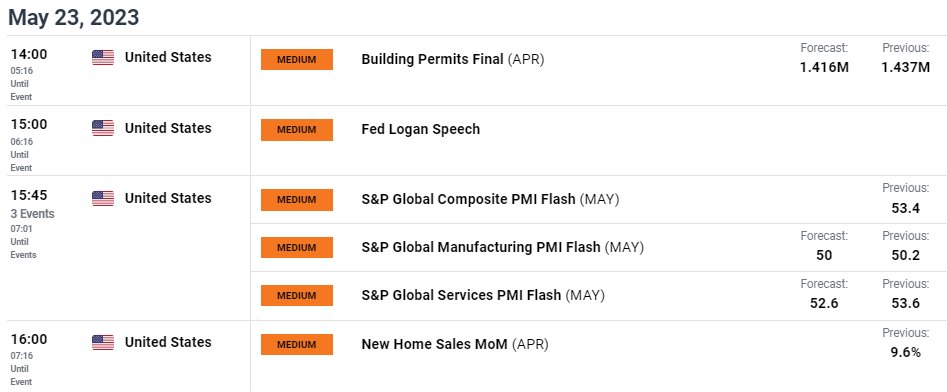
That being said, the week ahead contains several high impact economic data from the US including GDP, durable goods orders, consumer sentiment and core PCE; all of which will give markets and the Fed valuable data as to forward guidance. Later today, more Fed speak will provide short-term volatility as well as US PMI (S&P). Both manufacturing and services are projected to decline possible pushing manufacturing into contractionary territory should actual figures come in lower.
ECONOMIC CALENDAR
TECHNICAL ANALYSIS
U.S. DOLLAR INDEX DAILY CHART
Chart prepared by Warren Venketas, IG
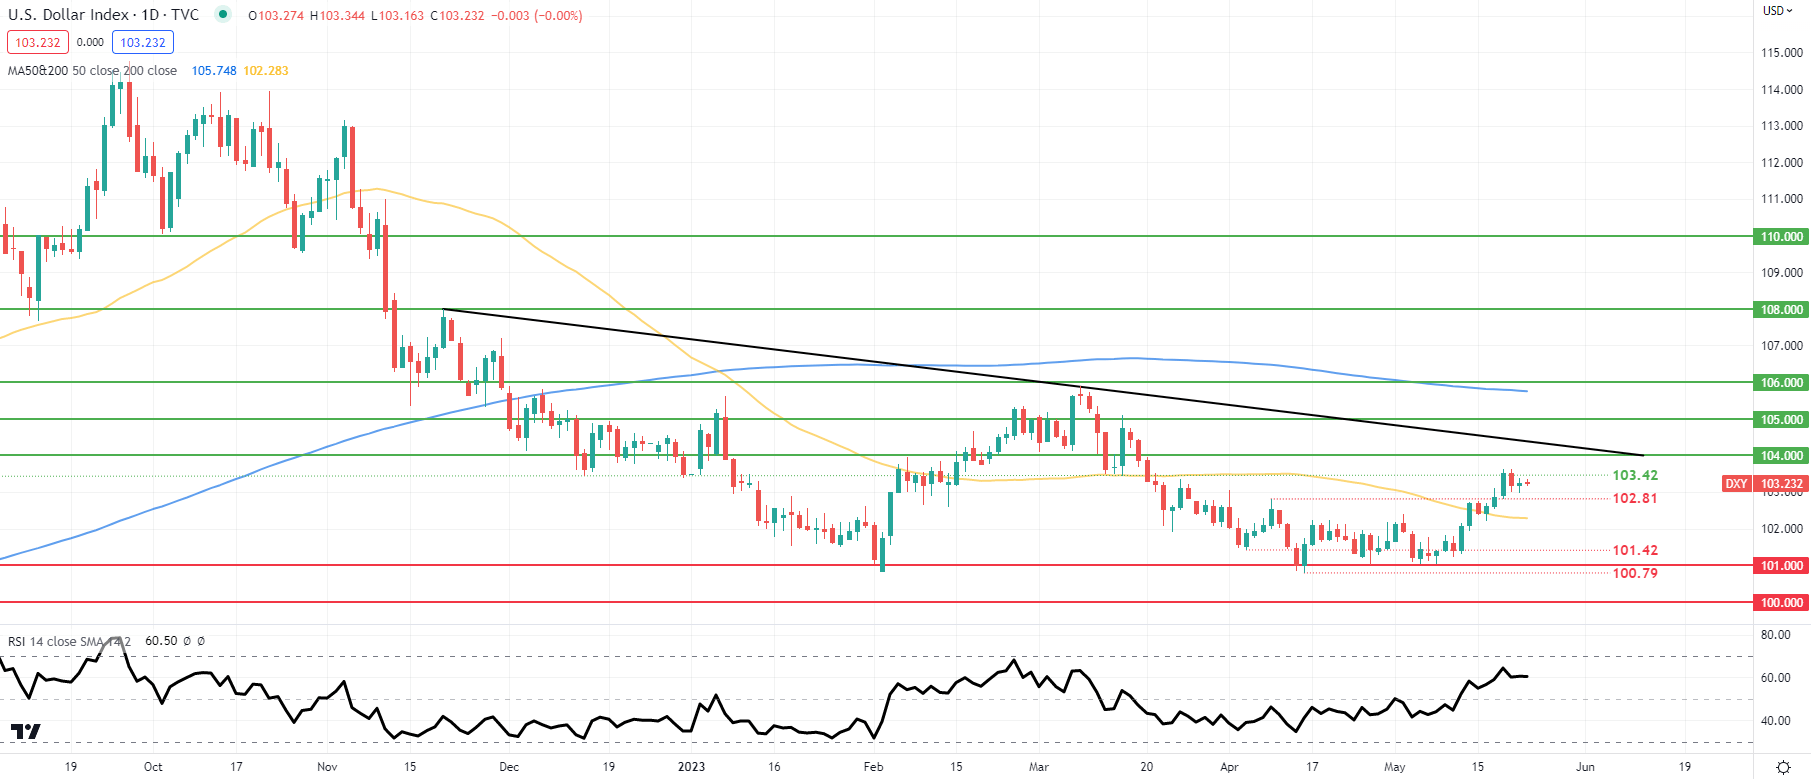
Daily DXY price action has slowed regarding its upside momentum as the index approaches overbought territory as measured by the Relative Strength Index (RSI). While there is still more room for an extended rally, this could be capped around the 104.00 psychological resistance handle. For now, price movement depends on debt ceiling updates (as is the case with most markets) and the sooner there is clarity, the sooner markets can focus on the Fed and US economic data.
Resistance levels:
- Trendline resistance
- 104.00
- 103.42
Support levels:
- 102.81
- 50-day MA (yellow)
- 101.42
- 101.00
Gold Price Finds Traction as US Dollar Pauses Despite Higher Yields
The gold price dipped to a 2-month low last week but has since consolidated with the US Dollar appreciation pausing from its recent run higher.
Treasury yields have been supportive of the ‘big dollar’ with the benchmark 2-year bond clipping 4.35% on Friday and again this week after having traded at 3.66% earlier this month.
Similarly, the 10-year note is trading above 3.7% after touching 3.30% a few weeks ago. Perhaps the focus for gold traders though is the rise of US real yields.
The real yield is the nominal yield less the market-priced inflation rate derived from Treasury inflation-protected securities (TIPS) for the same tenor.
The US 10-year real yield is currently eyeing a move over 1.50%. Of some concern for gold bulls, when it was at this level prior to the collapse of Silicon Valley Bank Financial et al, gold was below US$ 1,850.
Going into Tuesday’s session, the debt ceiling issue in the US appears to be finally heading in the right direction. After talks on Monday, President Joe Bidden and House Speaker Kevin McCarthy have both said that a default is not on the cards.
While the news is mostly welcomed, markets appear to be waiting for further clarity with little price response across markets thus far.
The US Dollar has been gathering some bullish momentum of late and direction in the DXY (USD) Index might lead the precious metal on its next move.
GC1 (GOLD FRONT FUTURES CONTRACT) TECHNICAL ANALYSIS
Gold remains in an ascending trend channel that began in November last year.
At the start of this month, GC1 made a high of 2085.4 after clearing the March 2022 peak of 2078.8 but fell short of overcoming the all-time high of 2089.2. The wholesale spot price of gold has also seen a similar setup.
This may indicate that the 2080 – 2090 area might offer a resistance zone. This is also a Triple Top which is an extension of a Double Top formation. It could indicate that there is strong resistance at those levels. A move above 2090 would be needed to dismantle this formation.
A break above there may open the way for a test of the ascending trend line, currently dissecting at 2150.
On the downside, support might be provided at the prior lows of 1945.0 and 1936.5 ahead of the ascending trend that currently lies at 1935. The 100-day SMA is also in that vicinity and could add support near there.
Australian Dollar Ahead of Retail Sales: AUD/USD, EUR/AUD, GBP/AUD Price Setups
The Australian dollar has been mixed against its peers as Australian rate hike expectations scaled back after employment unexpectedly fell in April. The key focus is now on retail sales data for April due Friday – forecast to have slowed to 0.1% on-month from 0.4% previously.
Broadly Australian macro data have come in above expectations since early April, according to the Economic Surprise Index. Hence, upbeat retail sales data could help reverse some of the recent dialing back in rate hike expectations, supporting AUD. The Reserve Bank of Australia unexpectedly raised the benchmark rate by 25 basis points at its meeting earlier this month and kept the door open for further tightening as inflation, which is running at 7%, is only expected to return to the top of the central bank’s 2%-3% target by mid-2025.
AUD/USD Daily Chart
AUD/USD: Still in a consolidation phase
AUD/USD has pulled back from the mid-April high of 0.6805, pushing the pair back within the well-established range of 0.6550-0.6800, pushing back (but not negated yet) the bullish possibility highlighted in the previous update (see “Australian Dollar Ahead of Budget: AUD/USD, AUD/JPY, EUR/AUD Price Setups”, published May 9.
AUD/USD Daily Chart
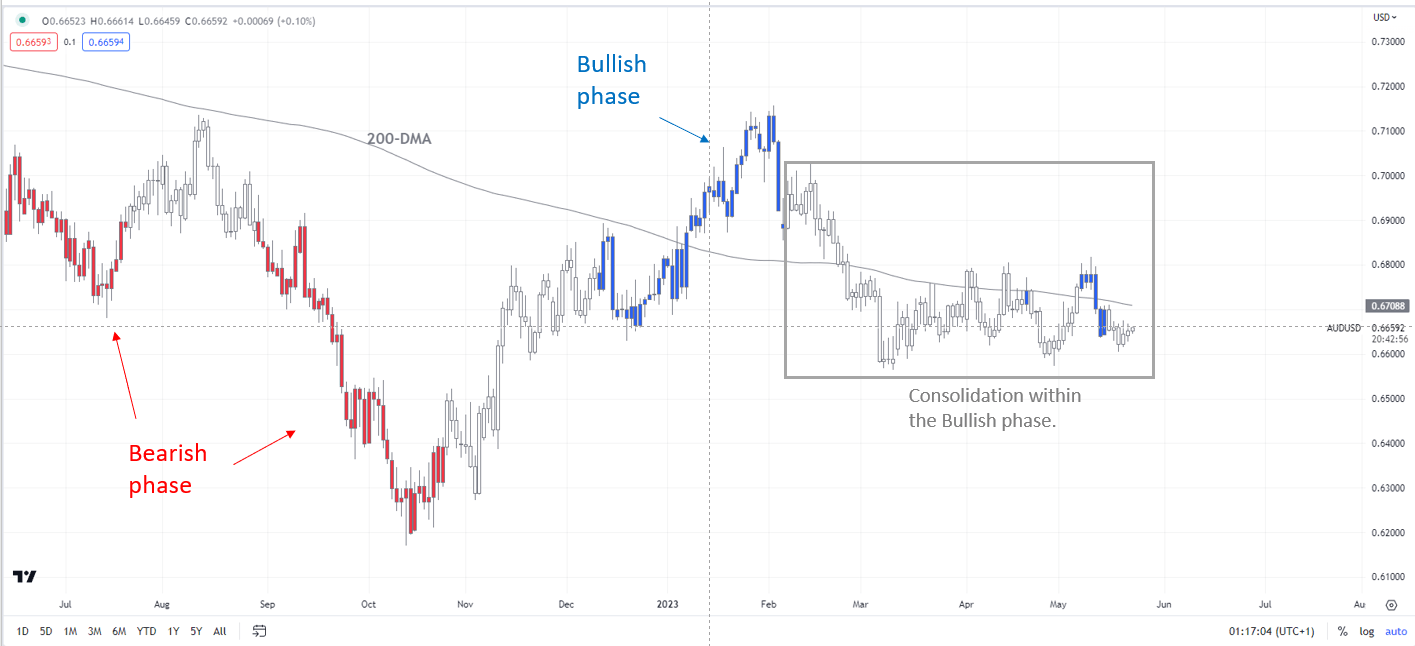
As the colour-coded candlestick charts based on trending/momentum indicators show, the pair remains in a consolidation phase since early 2023 within the broader bullish phase. The colour-coded chart is an attempt to de-bias, especially in instances where the line is fine between a downtrend and a downward correction within an uptrend.
AUD/USD Weekly Chart
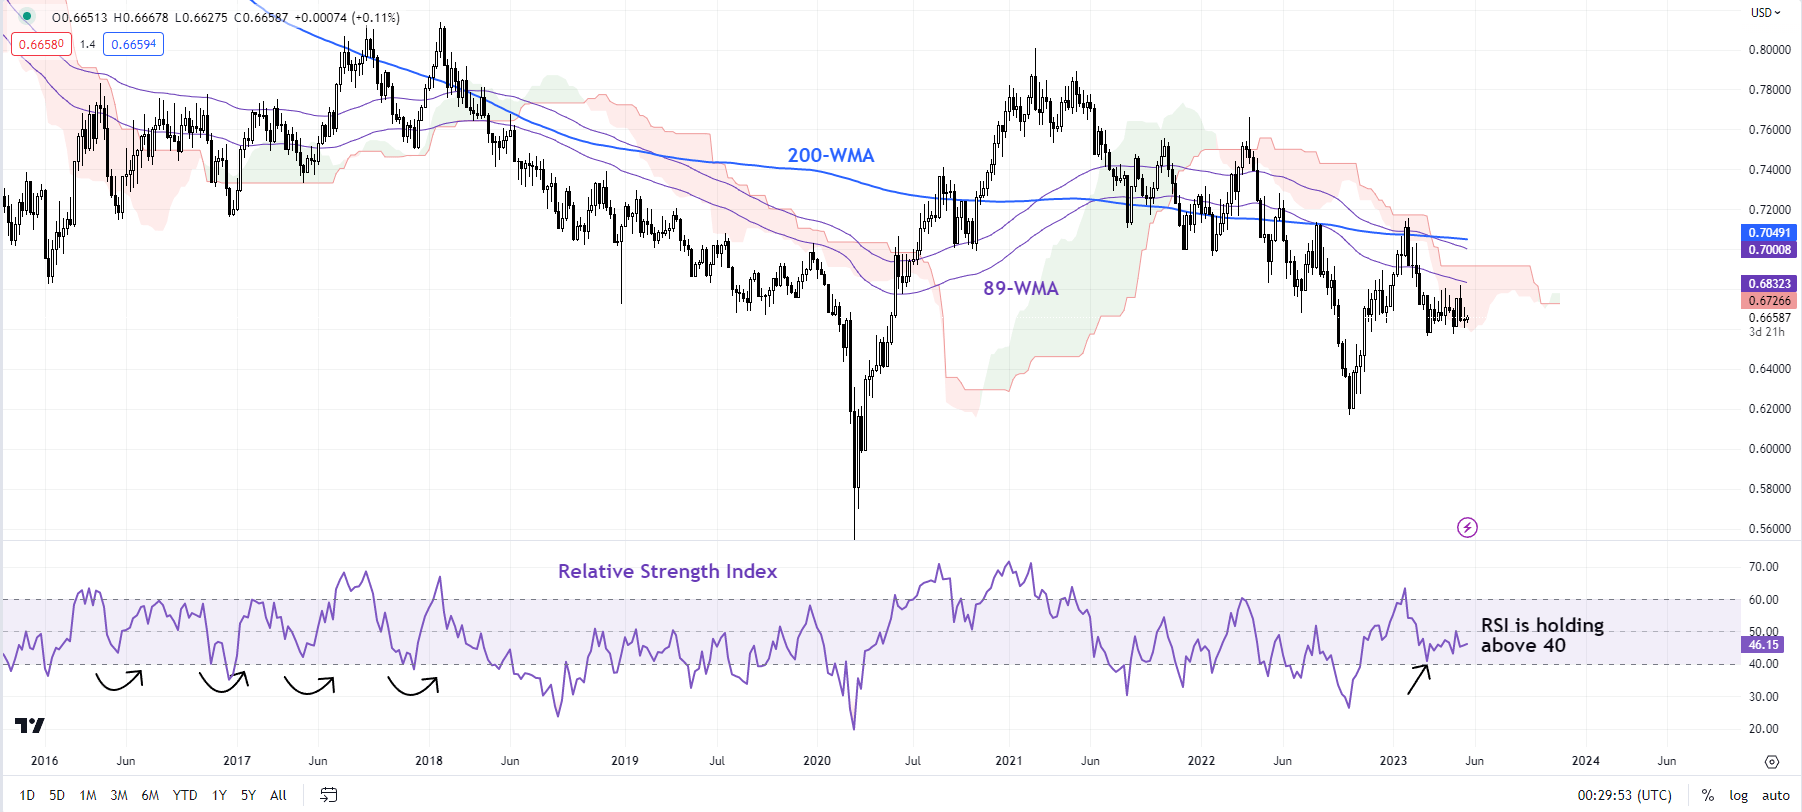
Importantly, the 14-week Relative Strength Index is holding above the 35-40 level – in the past downward corrections within an uptrend tend to be restricted around these levels (see the weekly chart). However, any break below the cushion on a horizontal trendline from November at about 0.6585 would pose a threat to the broader bullish phase. On the upside, AUD/USD needs to cross above 0.6805 for the uptrend to resume.
EUR/AUD Daily Chart
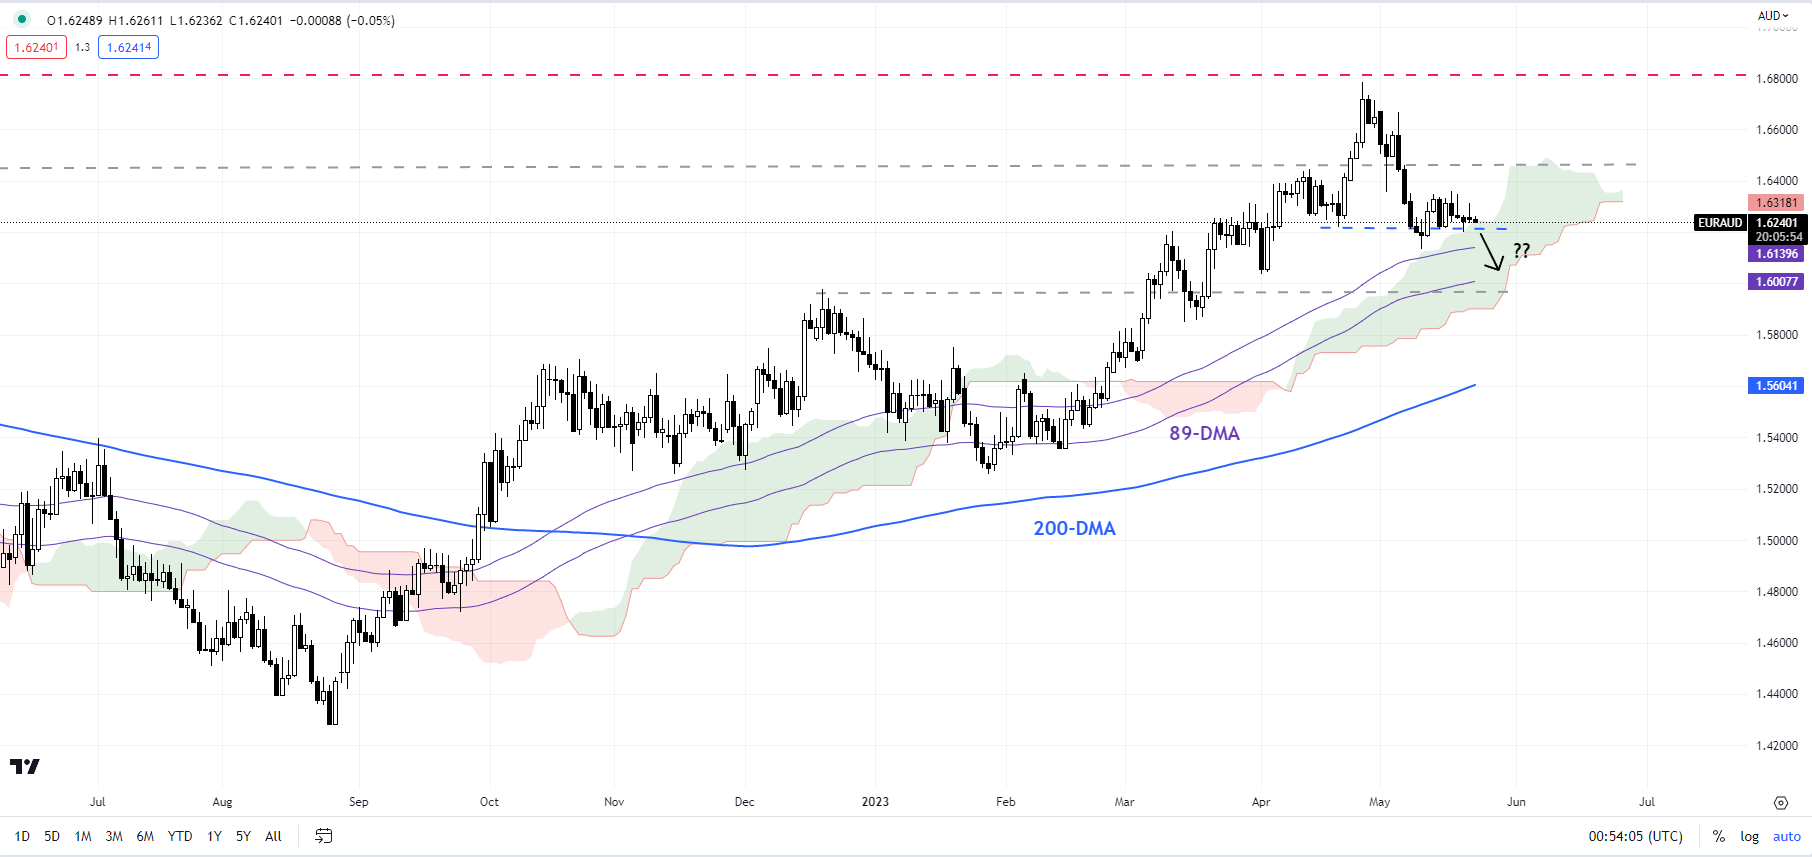
EUR/AUD: Some more downside?
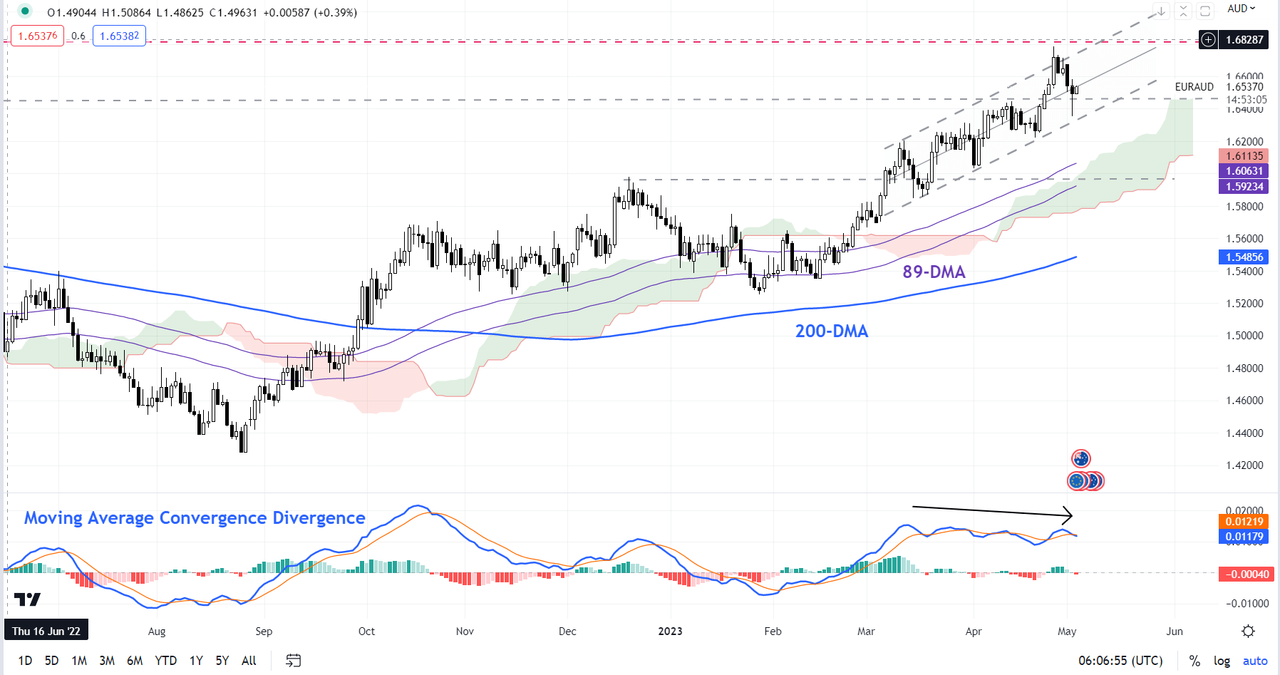
EUR/AUD has been struggling to hold above the late-April low of 1.6360, raising the risk of a drop toward 1.5950-1.6000 (including the December high and the 89-day moving average). This follows a retreat last month from a tough barrier at the October 2020 high of 1.6825. For more discussion see “Australian Dollar Ahead of Budget: AUD/USD, AUD/JPY, EUR/AUD Price Setups”, published May 9.
EUR/AUD Daily Chart
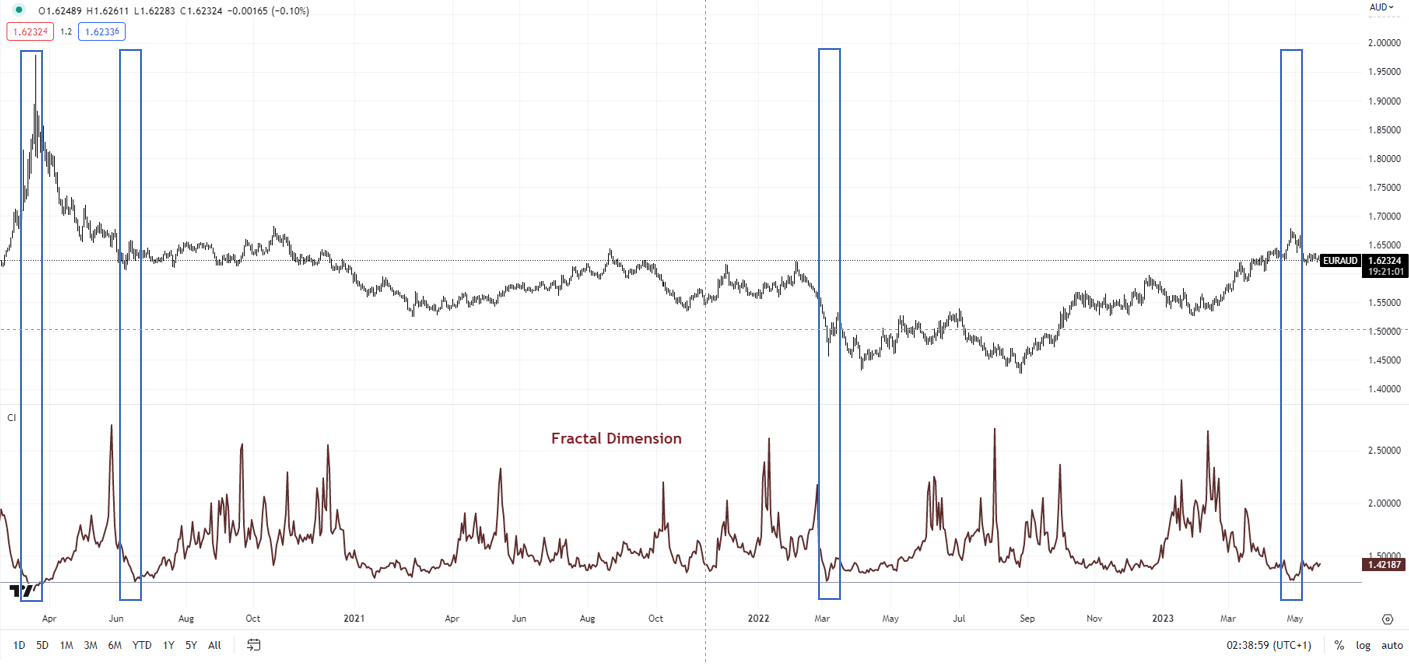
Chart Created by Manish Jaradi Using TradingView
Also, market diversity, as measured by fractal dimensions, appears to be low as EUR/AUD hit a multi-month high last month. Fractal dimensions measure the distribution of diversity. When the measure hits the lower bound, typically 1.25-1.30 depending on the market, it indicates extremely low diversity as market participants bet in the same direction, raising the odds of a price reversal. For EUR/AUD, the 65-day fractal dimension fell to around 1.26, very close to the red flag threshold of 1.25. (See chart.)
GBP/AUD Daily Chart
GBP/AUD: Rally fatigue
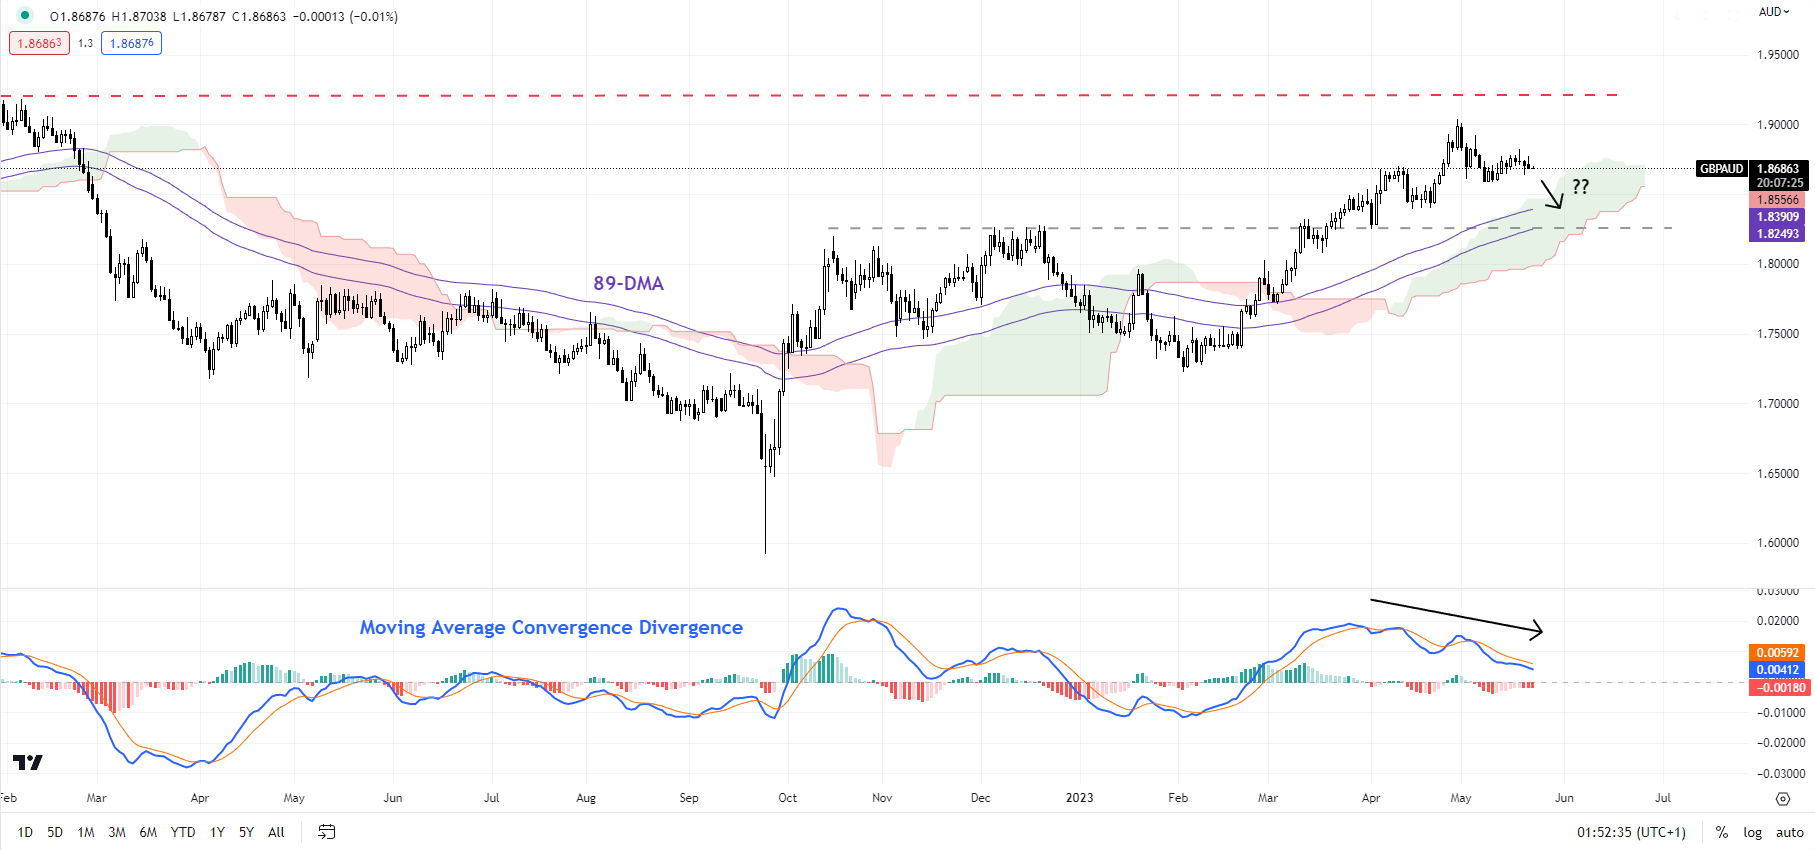
GBP/AUD’s sharp retreat from a near-stiff ceiling on a horizontal trendline from 2021, at about 1.9150, suggests some fatigue in the rally. While this doesn’t mean the multi-month uptrend is reversing, it probably implies a consolidation/minor retreat before another leg higher.
GBP/AUD Daily Chart
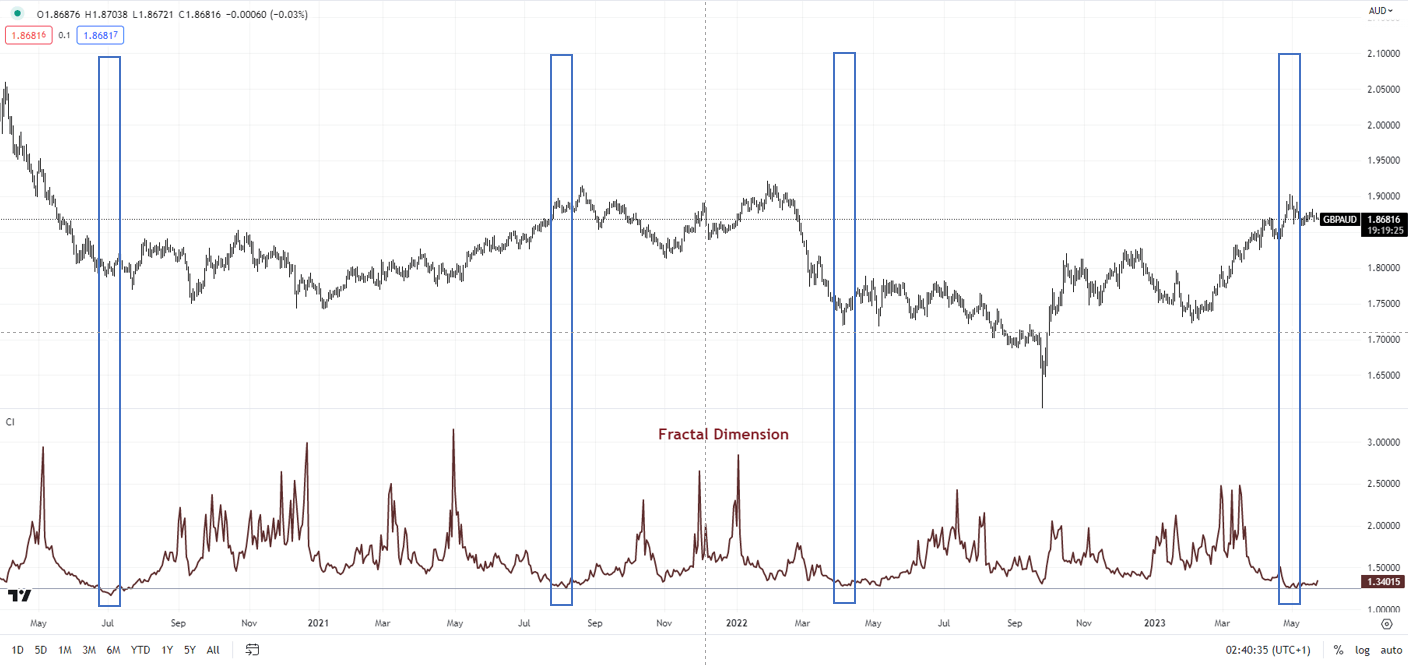
Like EUR/AUD, market diversity in GBP/AUD appears to be low – hit the lower threshold of 1.25 recently, flashing a red flag. See “Australian Dollar Price Setup: EUR/AUD, GBP/AUD, AUD/JPY”, published May 3. Any break below immediate support at the May 11 low of 1.8575 could pave the way toward the early-April low of 1.8250.
Note: In the above colour-coded chart, Blue candles represent a Bullish phase. Red candles represent a Bearish phase. Grey candles serve as Consolidation phases (within a Bullish or a Bearish phase), but sometimes they tend to form at the end of a trend. Note: Candle colors are not predictive – they merely state what the current trend is. Indeed, the candle color can change in the next bar. False patterns can occur around the 200-period moving average, or around a support/resistance and/or in sideways/choppy market. The author does not guarantee the accuracy of the information. Past performance is not indicative of future performance. Users of the information do so at their own risk.