Is the Downward Correction in Gold Over?

Is the Downward Correction in Gold Over?

Last week’s drop to a six-week low could be a sign that cracks have started to emerge in gold’s uptrend. To be sure, it doesn’t mean ‘down’ is the only way forward – it probably means that the top side is now more or less defined.

XAU/USD slipped below a crucial floor at the mid-April low of 1970 – a fall below a vital price pivot for the first time since the rally began in early November – suggesting that the tide could be beginning to turn against gold. That is, the trend could be changing from up to sideways or down on the daily charts.

Given the pace and the extent of the gains since the end of 2022, and still-supportive upward momentum on higher timeframe charts, it could well be a sideways with a downward bias, rather than a unidirectional slide — and Friday’s rebound reinforces this point.

XAU/USD Daily Chart

image1.png

Gold rebounded on Friday after US Federal Reserve Chair Jerome Powell left the door open for a pause at the June meeting. Tighter credit conditions mean that “our policy rate may not need to rise as much as it would have otherwise to achieve our goals,” Powell said. The central bank chair reiterated that the central bank would now make decisions “meeting by meeting”. Markets are pricing in an 90% chance of a pause at the June FOMC meeting.

XAU/USD 240-minute Chart

image2.png

On technical charts, the trend varies depending on the timeframe of reference. On the intraday charts, XAU/USD’s trend has turned bearish – see the 240-minute colour-coded candlestick charts based on trending/momentum indicators. Hence, Friday’s rebound could run out of steam ahead of the tough barrier around 2005-2020 (including the 200-period moving average and the mid-March high on the 240-minute charts).

XAU/USD 240-minute Chart

image3.png

On the daily charts, as the colour-coded candlestick charts show, the trend has moved to a consolidation phase within the overall bullish structure. If history is any guide, consolidations can extend from a few days to a few weeks.

XAU/USD Daily Chart

image4.png

So far, XAU/USD is holding above the key converged cushion area of 1925-1950 (including the 89-day moving average and the lower edge of the Ichimoku channel on the daily charts). A break below could trigger a reassessment of the six-month-long bullish structure. In recent months, the momentum on higher timeframe charts has been a concern – see previous updateson March 28,April 16,April 24,May 10, and last week’s update “Is This the Moment of Reckoning for Gold?”, published May 17.

Note: In the above colour-coded charts, Blue candles represent a Bullish phase. Red candles represent a Bearish phase. Grey candles serve as Consolidation phases (within a Bullish or a Bearish phase), but sometimes they tend to form at the end of a trend. Note: Candle colors are not predictive – they merely state what the current trend is. Indeed, the candle color can change in the next bar. False patterns can occur around the 200-period moving average, or around a support/resistance and/or in sideways/choppy market. The author does not guarantee the accuracy of the information. Past performance is not indicative of future performance. Users of the information do so at their own risk.

AUD/USD Price Forecast: Aussie Slips on Chinese LPR & Risk Sentiment

AUD/USD Price Forecast: Aussie Slips on Chinese LPR & Risk Sentiment

AUSTRALIAN DOLLAR FUNDAMENTAL BACKDROP

The Australian dollar looks to be facing another challenging week after US factors weighed on the pro-growth AUD. Beginning late on Friday, Treasury Secretary Janet Yellen addressed bank CEO’s and stated there may be a need for additional mergers due to the slew of bank failures seen over the last few months. This dampened risk sentiment leaving the AUD on the backfoot against the US dollar. Market caution gained traction over the weekend as optimism around the US debt ceiling was quickly dispelled when President Joe Biden mentioned that the demands from Republicans were ‘unacceptable’. President Biden and House of Representatives Speaker Kevin McCarthy will hash it out once more later today as time runs out.

That being said, Fed Chair Jerome Powell relayed a rather dovish statement last week which was largely lost in the debt ceiling shadow, hinting that the Fed may pause their hiking cycle. In summary, the week should be dominated by debt ceiling negotiations but Fed monetary policy should be a close second.

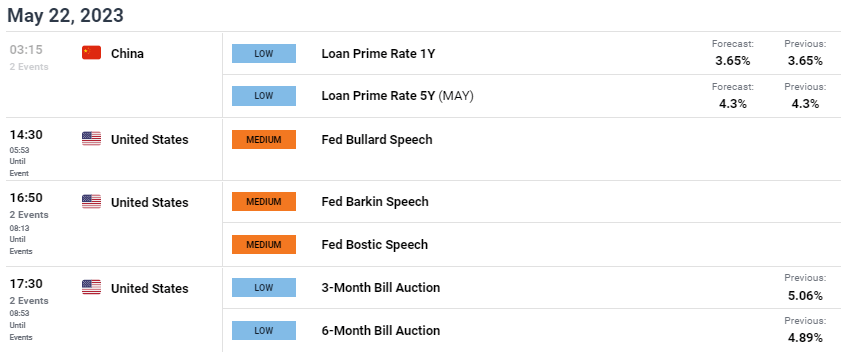
Earlier this morning China kept its 1 and 5-year Loan Prime Rates (LPR) unchanged. The increasing interest rate differential between the US and China has weighed on the Yuan and the PBoC’s desire to cut rates (as a stimulus measure) to meet their 5% GDP growth target. Commodity prices (Australian specific exports) have weakened thus exacerbating downside for the Aussie dollar.

The day ahead will be led by Fed speakers (see economic calendar below) and it will be interesting to see how the scheduled officials react to Fed Chair Powell’s recent comments.

ECONOMIC CALENDAR

image1.png

TECHNICAL ANALYSIS

AUD/USD DAILY CHART

image2.png

Chart prepared by Warren Venketas, IG

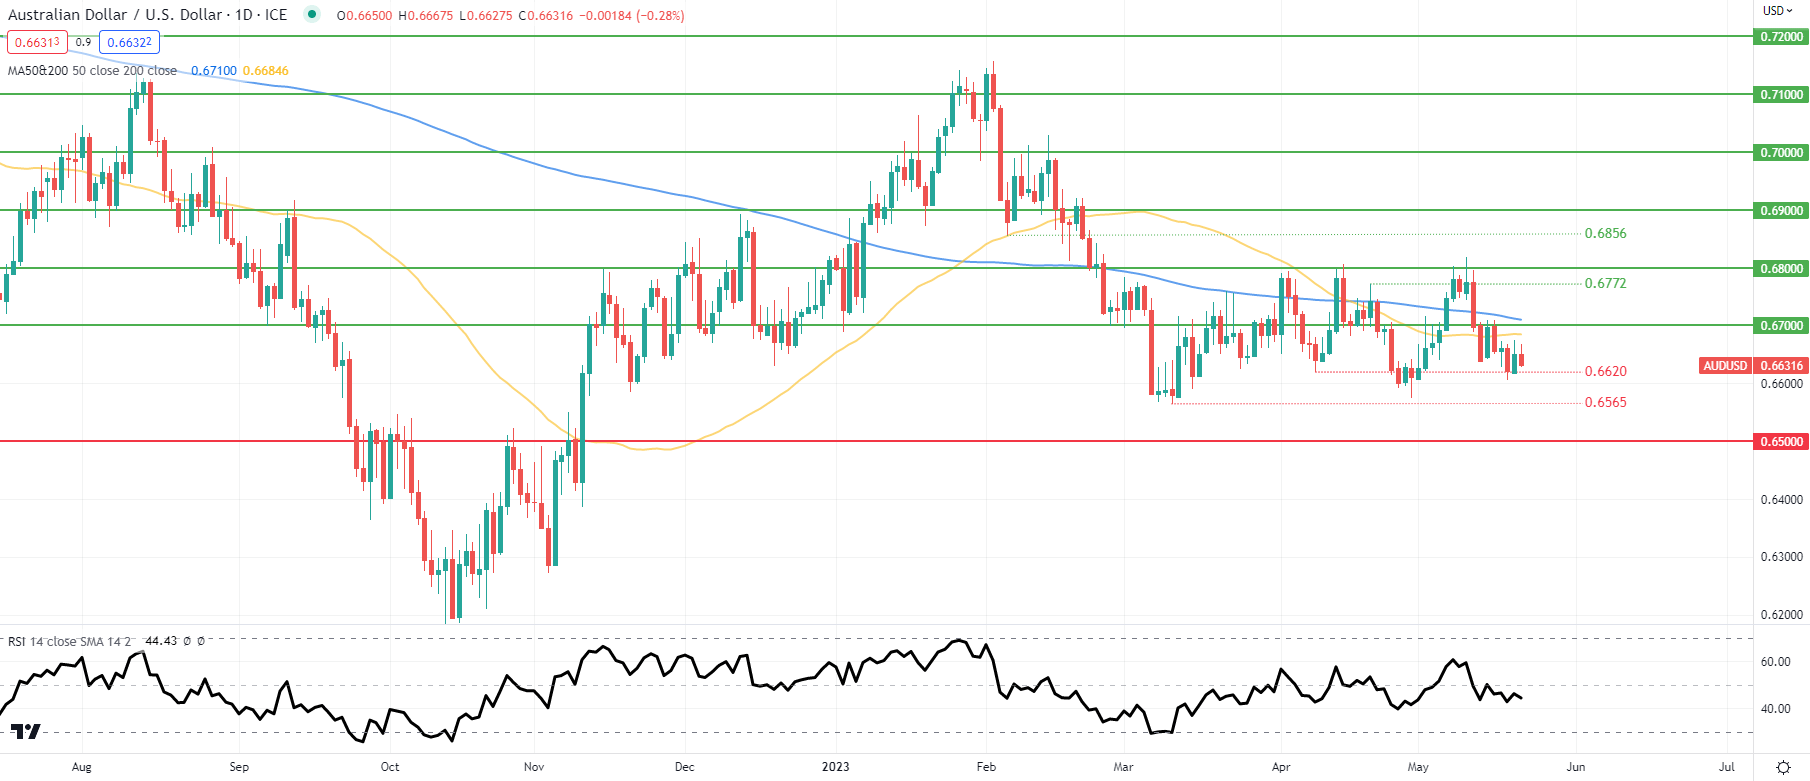
Daily AUD/USD price action reveals recent uncertainty in global markets as the pair fluctuates between the 0.6600 and 0.6800 psychological levels. The Relative Strength Index (RSI) further reiterates investor skepticism due to fundamental ambiguity. This week may be a ‘wait and see’ mindset from traders awaiting external cues.

EUR/CHF: Decline to persist on a break below support zone of 0.9710/0.9670 – SocGen

EUR/CHF: Decline to persist on a break below support zone of 0.9710/0.9670 – SocGen

Last week’s peak near 0.9770 must be overcome for affirming a meaningful up move

“EUR/CHF is now challenging the interim support zone of 0.9710/0.9670 representing the low of March and the 61.8% retracement from last year. An initial bounce is not ruled out however the peak achieved last week near 0.9770 must be overcome for affirming a meaningful up move.”

“Break below 0.9710/0.9670 could mean a persistent decline towards projections of 0.9600 and 0.9540.”

US Dollar Slides on Uncertainties While Japanese Yen Firms Despite Poor Data

US Dollar Slides on Uncertainties While Japanese Yen Firms Despite Poor Data

The US Dollar dipped again against the Suisse, Euro, Sterling and Yen to start the week with the US debt ceiling creating doubt in traders’ minds.

Talks are due to resume later today between US President Joe Biden and House Speaker Kevin McCarthy. The latter said that a phone call between the two on Sunday had been ‘productive’.

Treasury yields are a few basis points lower across the curve so far today and might be contributing to the weakening US Dollar.

US Federal Reserve Chair Jerome Powell made remarks on Friday that were seen as potentially less hawkish than previous commentary. In regard to future policy decisions, he said, “the risks of doing too much versus doing too little, have become more balanced.”

Minneapolis Federal Reserve President Neel Kashkari also stated that he would be open to skipping a hike at the next Federal Open Market Committee (FOMC) meeting in mid-June.

Interest rate markets are pencilling in a 25-basis point cut to the Fed funds target rate by November.

The Japanese Yen is firming even though core machine orders there for March came in much lower than forecasts today.

New orders fell -3.9% month-on-month in March rather than increasing by 0.4% as anticipated. Year-on-year, core machine orders dropped by -3.5% to the end of March, well below the estimates of a 1.3% increase.

USD/JPY is over a big figure lower from the 6-month peak 0f 138.75 seen last Thursday.

The People’s Bank of China (PBOC) left the 1- and 5-year loan prime rates unchanged at 3.65% and 4.30% respectively.

Hong Kong’s Hang Seng Index (HSI) is the best of the APAC equity indices, it was up over 1.5% at one stage. The rest of the major Asian bourses are mostly in the green although Australia’s ASX 200 is slightly in the red.

The buy now pay later (BNPL) sector is facing further scrutiny after the Australian government today announced measures to bring those debt providers under existing universal credit laws. The companies will now need to secure a credit license to operate.

Gold has held onto Friday’s gains but is little moved going into the European session, trading near US$ 1,980 at the time of going to print.

Crude oil is struggling today after making after spiking on Friday but remains in a broad range. The WTI futures contract is near US$ 71 bbl while the Brent contract is close to US$ 75 bbl.

It is a relatively quiet day ahead in terms of data releases, but several speakers from the ECB and the Fed will be making speeches.

USD/JPY TECHNICAL ANALYSIS

USD/JPY tried to run higher last week after breaking above a prior peak and making a high of 138.75.

It appears that the market has rejected the move for now with the price moving back below those previous resistance levels. This might be suggestive of a false and a new high will need to be made to allay these concerns.

Resistance might be at previous highs of 138.17, 138.75 and 139.90. On the downside, support may lie at the 200- and 260-day Simple Moving Averages (SMA) currently at 137.12 and 136.46 respectively.

image1.png


EUR/USD eases to 1.0800 as US Dollar recovers ahead of debt ceiling talks

EUR/USD eases to 1.0800 as US Dollar recovers ahead of debt ceiling talks

EUR/USD is easing to test 1.0800 in the European morning. The US Dollar is recovering ground amid a risk-off market profile, as traders stay cautious ahead of another round of US debt-ceiling talks.

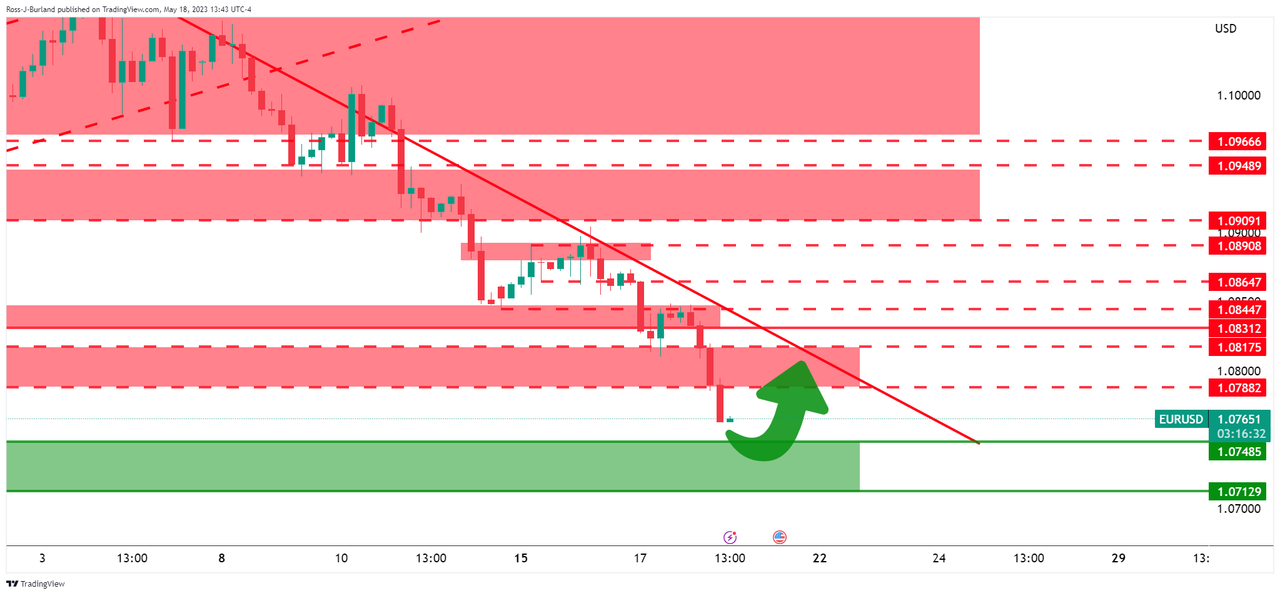
From a technical perspective, the overnight breakdown and acceptance below the 100-day Simple Moving Average (SMA) for the first time since November 2022 could be seen as a fresh trigger for bearish traders. The said support breakpoint, around the 1.0800 round-figure mark, coincided with the 50% Fibonacci retracement level of the March-May rally and should now act as a pivotal point. Meanwhile, oscillators on the daily chart are still far from being in the oversold zone and add credence to the negative outlook.

That said, any further decline is more likely to find some support near the 61.8% Fibo. level, around the 1.0730-1.0725 region. Some follow-through selling will reaffirm the bearish bias and drag the EUR/USD pair below the 1.0700 mark, towards the next relevant support near the 1.0675-1.0670 horizontal zone. Spot prices could slide further towards the 1.0635 region before eventually dropping to test the 1.0600 round figure.

On the flip side, the 1.0800 confluence now seems to act as an immediate strong barrier, above which a bout of a short-covering has the potential to lift the EUR/USD pair towards the 38.2% Fibo. level, around the 1.0865-1.0870 region. Some follow-through buying, leading to a subsequent strength beyond the 1.0900 mark, suggests that the recent pullback from over a one-year high has run its course and shift the bias in favour of bullish traders.

The shared currency fails to gain any respite from bets for more rate hikes by the European Central Bank (ECB). It is worth recalling that ECB President Christine Lagarde has already made it clear that efforts to curb stubbornly high inflation aren’t over and said that there are factors that can induce significant upside risk to the inflation outlook. This, however, fails to impress bulls or lend any support to the EUR/USD pair. Investors now look to the ECB Bulletin for some impetus, though the focus will remain glued to Fed Chair Jerome Powell’s appearance later this Friday.

Market players will closely scrutinize Powell’s remarks for fresh clues about the US central bank’s next policy move. This, along with the US bond yields, the US debt-limit negotiations and the broader risk sentiment, will influence the USD price dynamics and provide some impetus to the EUR/USD pair on the last day of the week. Nevertheless, spot prices remain on track to register heavy losses for the second straight week and the aforementioned fundamental backdrop supports prospects for additional losses. Hence, any attempted recovery might still be seen as a selling opportunity.

AUDUSD in tight range; decisive breakout needed

AUDUSD in tight range; decisive breakout needed

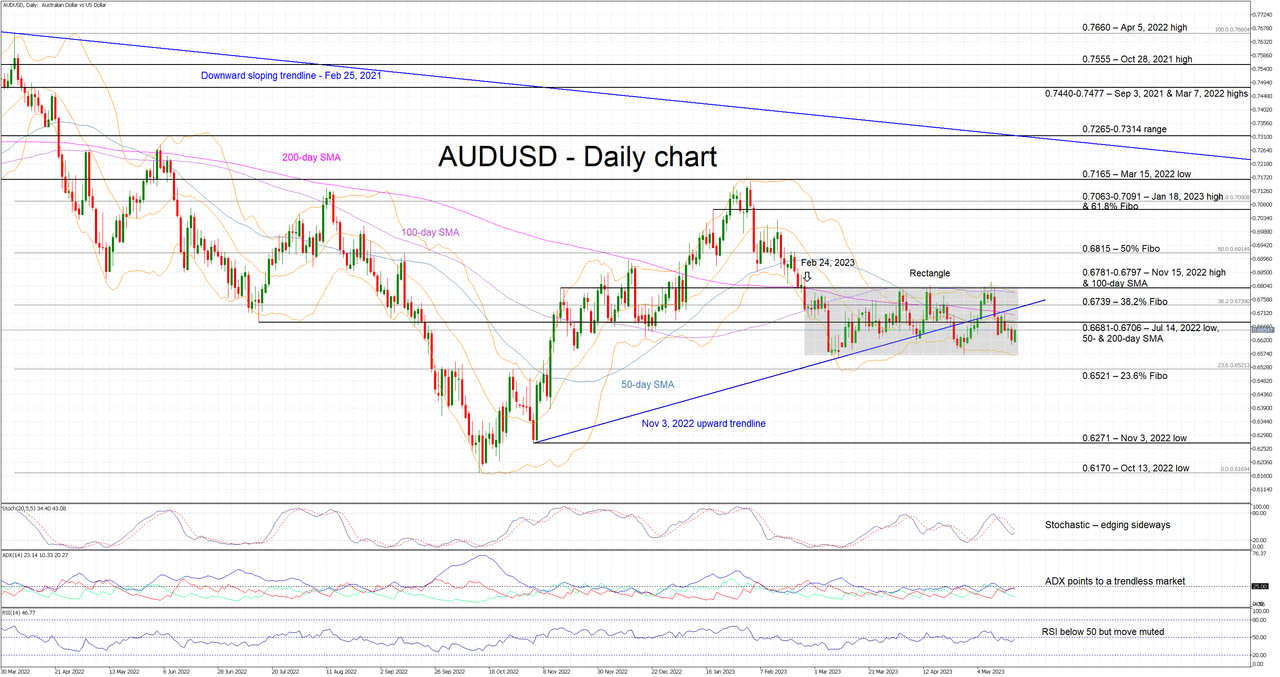
AUDUSD is edging higher today but remains well inside the rectangle that has formed since February 24. This recent range-trading is a depiction of the indecisiveness of market participants to commit to a specific move. As the direction of the breakout is unknown ahead of time, the focus turns to the momentum indicators for valuable information.However, the subdued Average Directional Movement Index (ADX) confirms the current range-trading theme, and the RSI is just a tad below its 50-threshold. In addition, the usually volatile stochastic oscillator is hovering below its moving average but appears to be moving sideways now. More interestingly, there is a convergence of the simple moving averages (SMAs), just above the current AUDUSD pricing, that is usually associated with an imminent move.

Should the bears manage to break the current rectangle, they would quickly come up against the 23.6% Fibonacci retracement of the April 5, 2022 – October 13, 2022 downtrend at 0.6521. The path then appears to be clear until the November 3, 2022 low of 0.6271.

On the other hand, if the bulls decide to take market control, they will try to clear the busy 0.6681-0.6706 area populated by the 50- and 200-day SMAs, and the July 14, 2022 low. They would then aim for 0.6739, before setting their eyes on the key 0.6781-0.6797 range, where the upper boundary of the rectangle lies.

To conclude, AUDUSD range-trading continues as market participants remain on the sidelines. A sizeable move appears to be on the cards, but a rectangle breakout is needed first.

Pivot Point Strategies for Forex Traders

Pivot Point Strategies for Forex Traders

A forex pivot point strategy could very well be a trader’s best friend as far as identifying levels to develop a bias, place stops and identify potential profit targets for a trade.

Pivot points have been a go-to for traders for decades. The basis of pivot points is such that price will often move relative to a previous limit, and unless an outside force causes the price to do so, price should stop near a prior extreme. Pivot point trading strategies vary which makes it a versatile tool for forex traders.

Keep reading to learn more about:

  • Defining the pivot point
  • How to calculate pivot points
  • Using pivot points in forex trading
  • Pivot point trading strategies
  • Difference between pivot points and Fibonacci retracements

What is a pivot point?

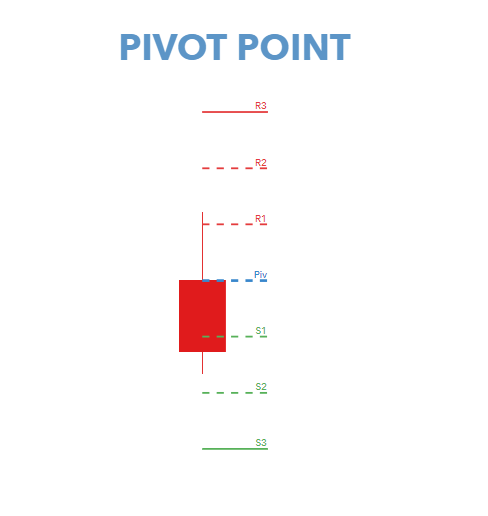
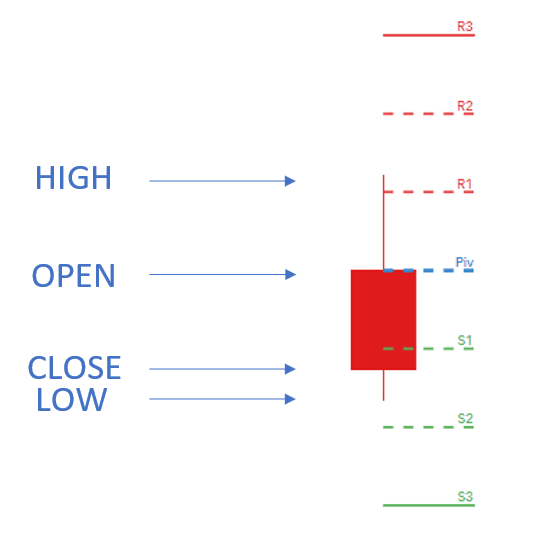
A pivot point is a is a technical indicator used by forex traders as a price level gauge for potential future market movements. The pivot point indicator is used to determine trend bias as well as levels of support and resistance, which in turn can be used as profit targets, stop losses, entries and exits.

Pivot point example:

pivot point indicator

How to calculate pivot points

The calculation for the most basic flavor of pivot points, known as ‘floor-trader pivots,’ along with their support and resistance levels:

Pivot point formula

Pivot point (PP) = (High + Low + Close) / 3

First resistance (R1) = (2 x PP) – Low

First support (S1) = (2 x PP) – High

Second resistance (R2) = PP + (High – Low)

Second support (S2) = PP – (High – Low)

Third resistance (R3) = High + 2 (PP – Low)

Third support (S3) = Low – 2 (High – PP)

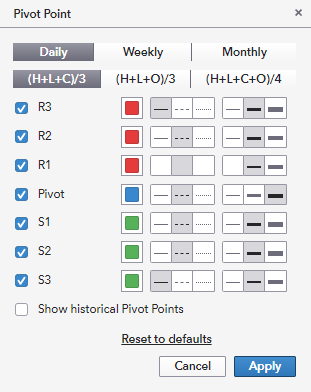
There are other ways to calculate the pivot point, which is available on most trading platforms and can be extended through different time frames. The support and resistance levels will be calculated as above. Below is an example of what is offered on the IG trading platform for daily pivots. The same calculation can be made for weekly or monthly pivots too:

pivot point calculation

How did the pivot point calculation come about?

Up until recently, computers were not available on a mass scale. Therefore, market makers and floor traders needed a way of determining whether price was ‘cheap’ or ‘expensive’ on a relative basis. From a simple mathematical calculation, pivot points were born.

Traders simply took the high, low, and closing price from the previous period and divided by three to find the ‘pivot.’ From this pivot, traders would then base their calculations for three support, and three resistance levels.

pivot point formula

How to use pivot points in forex trading

Pivot points are used by forex traders in line with traditional support and resistance trading techniques. Price tends to respect these levels as they do with support and resistance. Pivot point price levels are recurrently tested which further substantiates these levels.

Traders frequently use additional validation tools such as indicators, candlestick patterns, oscillators, fundamentals and price action to use in conjunction with the pivot to make trade decisions in the forex market.

There are a few basic guidelines to follow when trading with pivot points:

  1. Price above pivot = bullish bias
  2. Price below pivot = bearish bias
  3. Longer period pivot points are more dependable due to increased data set
  4. Support and resistance levels are extensions of the pivot which can be used as supplementary key price levels

Pivot Point trading strategies

1. Pivot point swing trading

For traders who prefer the medium to longer-term trades, swing trading with the pivot point is possible by using weekly/monthly time frames.

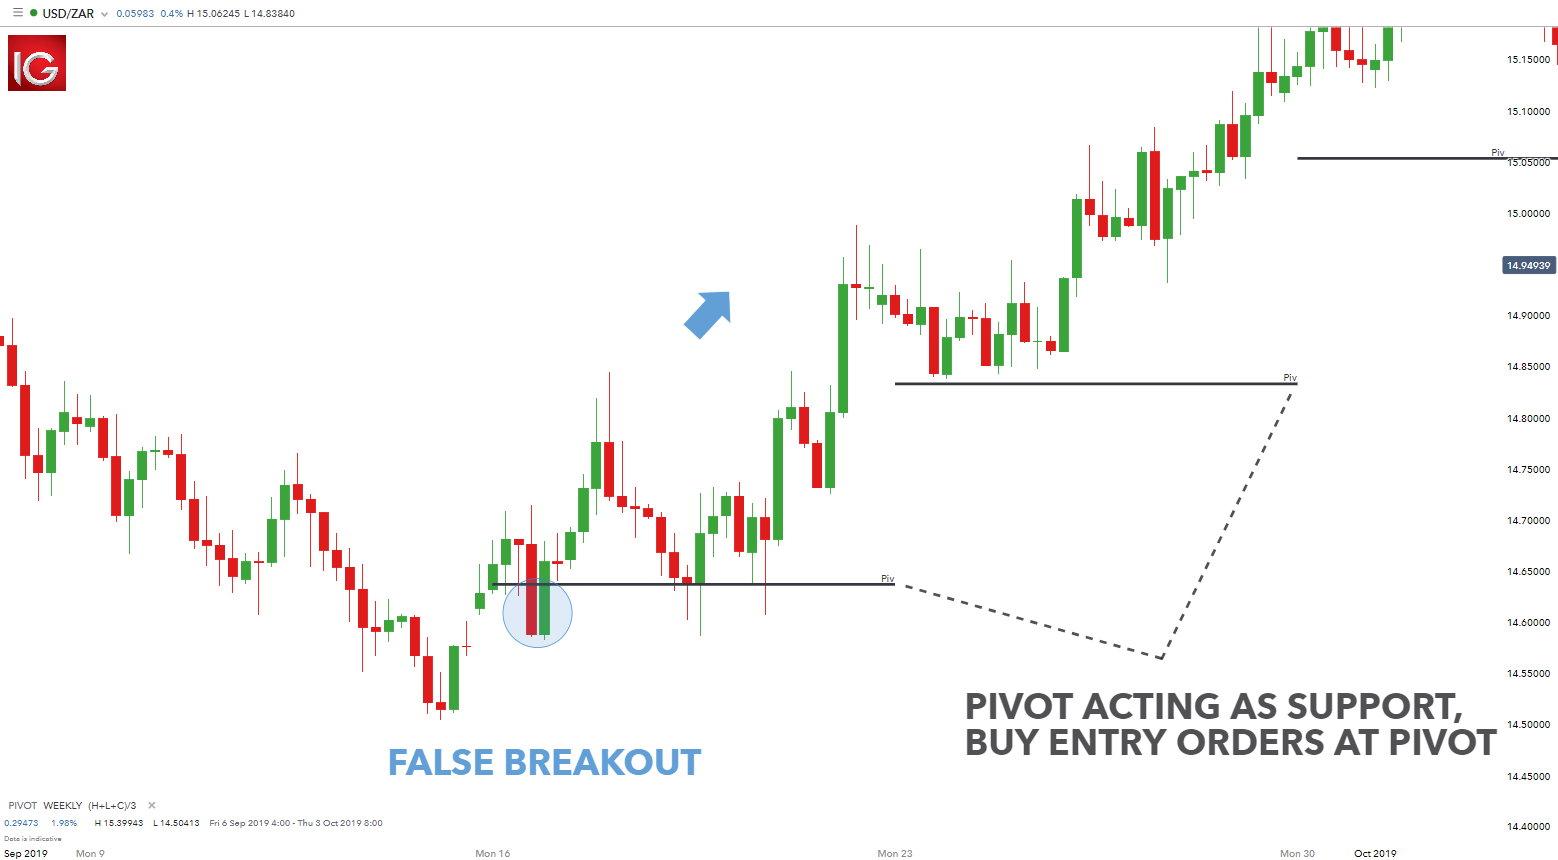
The chart below depicts a weekly chart with the addition of the pivot point only (this can be edited by changing the pivot settings on the platform). It is clear there has been a trend reversal to the upside which is evident after the price breaks through the previous pivot resistance.

Now acting as a support level, forex traders can place long entry orders at the pivot price. There is a false breakout (blue circle) but after this, there is substantial upside which could be exploited. The pivot levels won’t always contain the price, but it does offer a price level to maintain the directional bias. This would be a lengthier time horizon which would be ideal for swing traders.

USD/ZAR weekly chart

swing trading with pivot points

2. Pivot point breakout strategy

Many traders attempt to focus their trading activity to the more volatile periods in the market when the potential for large moves may be elevated.

Traders may attempt to look at breaks of each support or resistance level as an opportunity to enter a trade in a fast-moving market. This can be particularly relevant for longer-term pivot levels, with focus being paid to the weekly and monthly pivot points. The charts below will show how a trader can set up a pivot point breakout strategy using firstly the pivot alone as an indication as well as the more complex support and resistance levels.

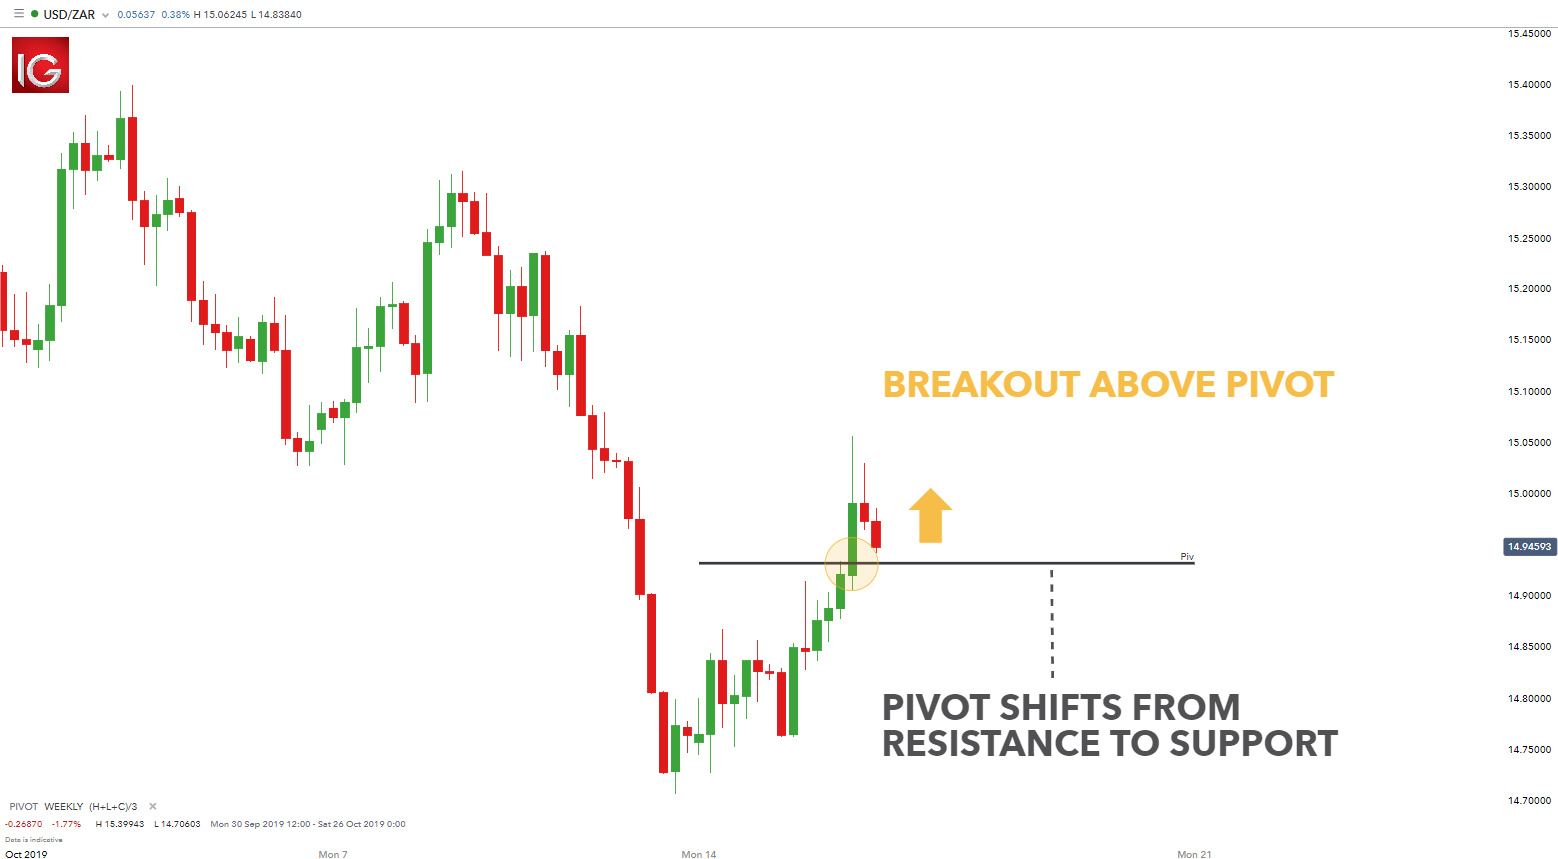
The chart below shows a pivot point with support and resistance levels excluded. In this example, the pivot indicator is based over a weekly period which provides traders with an extended data set for a more reliable key level. The pivot is used as a key price level, which was initially respected a few candles prior to the breakout. Once the breakout occurs, traders can then look to enter into a long trade as price above the pivot signals a bullish bias.

USD/ZAR four-hour chart

pivot point breakout strategy

What’s the difference between pivot points and Fibonacci retracements/extensions?

Both pivot points and Fibonacci retracements/extensions present traders with hidden levels of support and resistance. However, there are some significant differences:

EUR/USD Analysis: Bears retain control ahead of ECB Bulletin and Fed Chair Powell’s speech

EUR/USD Analysis: Bears retain control ahead of ECB Bulletin and Fed Chair Powell’s speech

The EUR/USD pair enters a bearish consolidation phase and oscillates in a narrow range near its lowest level since March 27 touched during the Asian session on Friday. A combination of supporting factors assists the US Dollar (USD) to stand tall near the seven-week high touched the previous day, which, in turn, is seen weighing on the major. Against the backdrop of the recent hawkish signals from several Federal Reserve (Fed) officials, the optimism over a US debt ceiling deal keeps the US Treasury bond yields elevated and continues to underpin the Greenback.

In fact, Dallas Fed President Lorie Logan said on Thursday that the economic data points so far don’t justify skipping a rate increase at the next policy meeting in June. This, in turn, reaffirms market expectations that the US central bank will keep interest rates higher for longer. Furthermore, top US congressional Republican Kevin McCarthy noted that negotiations are at a better place than last week and expected a bill to raise the government’s $31.4 trillion debt ceiling on the House floor next week. This, along with Thursday’s upbeat US macro data, lends support to the buck.

The US Department of Labor (DOL) reported that Initial Jobless Claims fell to 242K during the week ended May 13 as compared to the previous week’s reading of 264K and the 254K anticipated. Adding to this, the Philly Fed Manufacturing Index bounced from a three-year low of -31.3 in April and improved to -10.4 in May, beating market expectations of -19.8. This, along with worrying signs about global economic growth, benefits the Greenback’s relative safe-haven status. In fact, data from China this week showed that the world’s second-largest economy underperformed in April.

The shared currency, meanwhile, fails to gain any respite from bets for more rate hikes by the European Central Bank (ECB). It is worth recalling that ECB President Christine Lagarde has already made it clear that efforts to curb stubbornly high inflation aren’t over and said that there are factors that can induce significant upside risk to the inflation outlook. This, however, fails to impress bulls or lend any support to the EUR/USD pair. Investors now look to the ECB Bulletin for some impetus, though the focus will remain glued to Fed Chair Jerome Powell’s appearance later this Friday.

Market players will closely scrutinize Powell’s remarks for fresh clues about the US central bank’s next policy move. This, along with the US bond yields, the US debt-limit negotiations and the broader risk sentiment, will influence the USD price dynamics and provide some impetus to the EUR/USD pair on the last day of the week. Nevertheless, spot prices remain on track to register heavy losses for the second straight week and the aforementioned fundamental backdrop supports prospects for additional losses. Hence, any attempted recovery might still be seen as a selling opportunity.

Technical Outlook

From a technical perspective, the overnight breakdown and acceptance below the 100-day Simple Moving Average (SMA) for the first time since November 2022 could be seen as a fresh trigger for bearish traders. The said support breakpoint, around the 1.0800 round-figure mark, coincided with the 50% Fibonacci retracement level of the March-May rally and should now act as a pivotal point. Meanwhile, oscillators on the daily chart are still far from being in the oversold zone and add credence to the negative outlook.

That said, any further decline is more likely to find some support near the 61.8% Fibo. level, around the 1.0730-1.0725 region. Some follow-through selling will reaffirm the bearish bias and drag the EUR/USD pair below the 1.0700 mark, towards the next relevant support near the 1.0675-1.0670 horizontal zone. Spot prices could slide further towards the 1.0635 region before eventually dropping to test the 1.0600 round figure.

On the flip side, the 1.0800 confluence now seems to act as an immediate strong barrier, above which a bout of a short-covering has the potential to lift the EUR/USD pair towards the 38.2% Fibo. level, around the 1.0865-1.0870 region. Some follow-through buying, leading to a subsequent strength beyond the 1.0900 mark, suggests that the recent pullback from over a one-year high has run its course and shift the bias in favour of bullish traders.

fxsoriginal

Japan, UK leaders agree to deepen security cooperation

Japan, UK leaders agree to deepen security cooperation

The prime ministers of Japan and the United Kingdom have agreed to deepen bilateral cooperation in security and other fields.

Kishida Fumio and Rishi Sunak met over dinner in Hiroshima on Thursday, the day before the Group of Seven summit opens in the western Japanese city.

Their agreement is known as “The Hiroshima Accord.”
It covers defense, trade and investment, science and technology, and global challenges such as climate change. It commits the two countries to “an enhanced global strategic partnership.”

The accord says Japan and the UK are “the closest of partners and will stand shoulder to shoulder in … advancing the vision of a free and open Indo-Pacific.”

It refers to the possibility of allowing the Japanese Self-Defense Forces to provide protection for UK assets, such as ships and aircraft.

The document says the two countries will launch dialogue between their ministers for economy, trade and industry to further strengthen high-level collaboration.

The UK said it will double the number of troops it sends to participate in joint exercises with Japan. It pledges to dispatch its carrier strike group to the Indo-Pacific in 2025 to safeguard the region’s peace and stability, in tandem with Japan’s Maritime Self-Defense Force and other regional partners. The UK sent the carrier strike group to the region in 2021.

The UK said the two countries will also boost collaboration in areas such as cyber-security, offshore wind farms, and other clean energy technologies, as well as in the semiconductor industry.

The UK government said on Wednesday that the relationship with Japan “has grown further and faster than with any other international partner, reflecting Japan’s pivotal role in the Indo-Pacific and their centrality to the UK’s security and prosperity.”

Sunak attended the working dinner at a Japanese restaurant, wearing red socks featuring the name of Kishida’s favorite professional baseball team, the Hiroshima Toyo Carp.

New York Fed and Monetary Authority of Singapore Publish Results of Joint Wholesale Cross-Border Payments Research Study

New York Fed and Monetary Authority of Singapore Publish Results of Joint Wholesale Cross-Border Payments Research Study

NEW YORK, SINGAPORE – The Federal Reserve Bank of New York’s New York Innovation Center (NYIC) and the Monetary Authority of Singapore (MAS) today published a research report detailing the results of the joint Project Cedar Phase II x Ubin+ (Cedar x Ubin+) experiment. The Cedar x Ubin+ experiment examined whether distributed ledger technology (DLT) could be used to improve the efficiency of cross-border wholesale payments and settlements involving multiple currencies.

The technical research experiment built on previous phases of the NYIC’s Project Cedar research and the MAS’ Ubin+ initiative. It examined a cross-border multi-currency use case in which vehicle currencies are used as a bridge to exchange currency pairs that are not widely traded. Specifically, Cedar x Ubin+ explored the ability of DLT to establish connectivity across heterogeneous simulated currency ledgers, reduce settlement risk, and decrease settlement time. The experiment was conducted in a test environment and the hypothetical payments were settled using simulated wholesale central bank digital currencies.

“Cross-border payments are a major railway for facilitating the functioning of the global economy,” said Michelle Neal, Head of the Markets Group at the New York Fed. “Our research collaboration with the MAS reveals key opportunities for central bank innovation to play an important role in easing wholesale payment flows globally and improving settlement outcomes.”

Leong Sing Chiong, Deputy Managing Director (Markets & Development), MAS, said, “The Cedar x Ubin+ experiment envisages a future digital currency landscape where central banks can enable interoperability of wholesale CBDCs to facilitate more efficient cross-border payment flows including for less liquid currencies, without requiring a common infrastructure.”

The Cedar x Ubin+ experiment demonstrated that DLT could support enhancements to cross-border multi-currency payments and settlements. The findings addressed three key pain points related to network interoperability and autonomy, settlement, and speed:

  • Interoperability and Autonomy: The Cedar x Ubin + experiment interlinked the distinct central bank currency ledgers, providing flexibility in the design and operation of each ledger to the respective central bank. This enabled payments to be safely executed across multiple ledgers without the need for a central clearing authority or the establishment of a shared central network.
  • Atomic Settlement: The simulated payments were settled atomically, meaning transactions were only settled if all legs in the cross-currency payment chains were executed successfully. This improved the certainty of settlement, addressing existing pain points such as counterparty risks.
  • Near Real-Time Settlement: Each simulated payment scenario achieved end-to-end settlement in under thirty seconds on average. This enabled participants to be notified of a payment’s success in a matter of seconds.

The study revealed research areas for future experimentation and analysis, including around the viability of the network solution to manage transaction volumes at scale, with potentially, an increase in payments settled per second and the involvement of additional currencies supported by their corresponding central bank ledgers.

In addition to the Cedar x Ubin+ research report, the New York Fed published a technical appendix to the Phase I Project Cedar research report, providing further detail on the NYIC’s inaugural experiment.

Project Cedar is a multi-phase technical research effort evaluating the potential applications of financial technology solutions to improve the efficiency of wholesale cross-border payments. Phase I of Project Cedar found that wholesale payments supported by DLT could improve the speed and safety of cross-border transactions.

Project Cedar aims to contribute to a broad and transparent dialogue about innovation in the financial sector. The Cedar x Ubin+ report is not intended to advance any specific policy outcome, nor to signal that the Federal Reserve or the MAS will make any imminent decisions about the appropriateness of issuing a central bank digital currency, or any other product or service, nor indicate how one would necessarily be designed.

While DLT was explored as a potential solution in Cedar x Ubin+, alternative technical designs may also provide viable solutions. No decisions as to optimal technical design have been made by the Federal Reserve System.

Ubin+ is MAS’ initiative focused on wholesale digital currency connectivity with international partners to improve the efficiency in cross-border foreign exchange settlement and successful interlinking with diverse DLT and non-DLT financial networks in the future. Its focus includes: the study of business models and governance structures for cross-border foreign exchange settlement, development of technical standards and infrastructure for cross-border connectivity, interoperability and atomic settlement, and establishment of policy guidelines for digital currency infrastructure connectivity across borders.

About the New York Innovation Center
As part of the Federal Reserve Bank of New York, the New York Innovation Center (NYIC) bridges the worlds of finance, technology, and innovation. Launched in 2021 and established in partnership with the Bank for International Settlements Innovation Hub, the NYIC generates insights into high-value central bank-related opportunities through technical research, experimentation, and prototyping, to drive advancements in central banking and enhance the functioning of the global financial system.

About Monetary Authority of Singapore
The Monetary Authority of Singapore (MAS) is Singapore’s central bank and integrated financial regulator. As a central bank, MAS promotes sustained, non-inflationary economic growth through the conduct of monetary policy and close macroeconomic surveillance and analysis. It manages Singapore’s exchange rate, official foreign reserves, and liquidity in the banking sector. As an integrated financial supervisor, MAS fosters a sound financial services sector through its prudential oversight of all financial institutions in Singapore – banks, insurers, capital market intermediaries, financial advisors and financial market infrastructures. It is also responsible for well-functioning financial markets, sound conduct, and investor education. MAS also works with the financial industry to promote Singapore as a dynamic international financial centre. It facilitates the development of infrastructure, adoption of technology, and upgrading of skills in the financial industry.